S&P 500 52-Week Highs & Lows Radar: Apple (AAPL), Howmet Aerospace (HWM) and more
MarketsFN Team

Screening all 503 S&P 500 constituents for stocks nearest to their 52-week high and their 52-week low. Data as of October 23, 2026. % Realized = 52-week total return.
Legend: RSI > 70 = overbought · RSI < 30 = oversold · Green % Realized = positive 52W return · Red = negative.
📈 Nearest to 52-Week High
Sectors represented: Energy (2), Technology (1), Financial (1), Healthcare (1)
| Ticker | Company | Sector | Price Last | % Realized | 52-Week High Date | RSI | % above MA200 | Trend |
|---|---|---|---|---|---|---|---|---|
| AAPL | Apple Inc | Technology | $349.48 | +34.63% | 2026-10-23 | 65.8 | +18.7% | Above MA20, MA50, MA200 |
| BRK-B | Berkshire Hathaway Inc | Financial | $547.28 | +11.65% | 2026-10-23 | 81.5 | +10.6% | Above MA20, MA50, MA200 |
| XOM | Exxon Mobil Corp | Energy | $181.30 | +56.32% | 2026-10-23 | 74.3 | +18.4% | Above MA20, MA50, MA200 |
| CVX | Chevron Corp | Energy | $230.76 | +47.40% | 2026-10-23 | 75.1 | +20.4% | Above MA20, MA50, MA200 |
| GILD | Gilead Sciences, Inc | Healthcare | $157.42 | +30.38% | 2026-10-23 | 61.0 | +13.4% | Above MA20, MA50, MA200 |
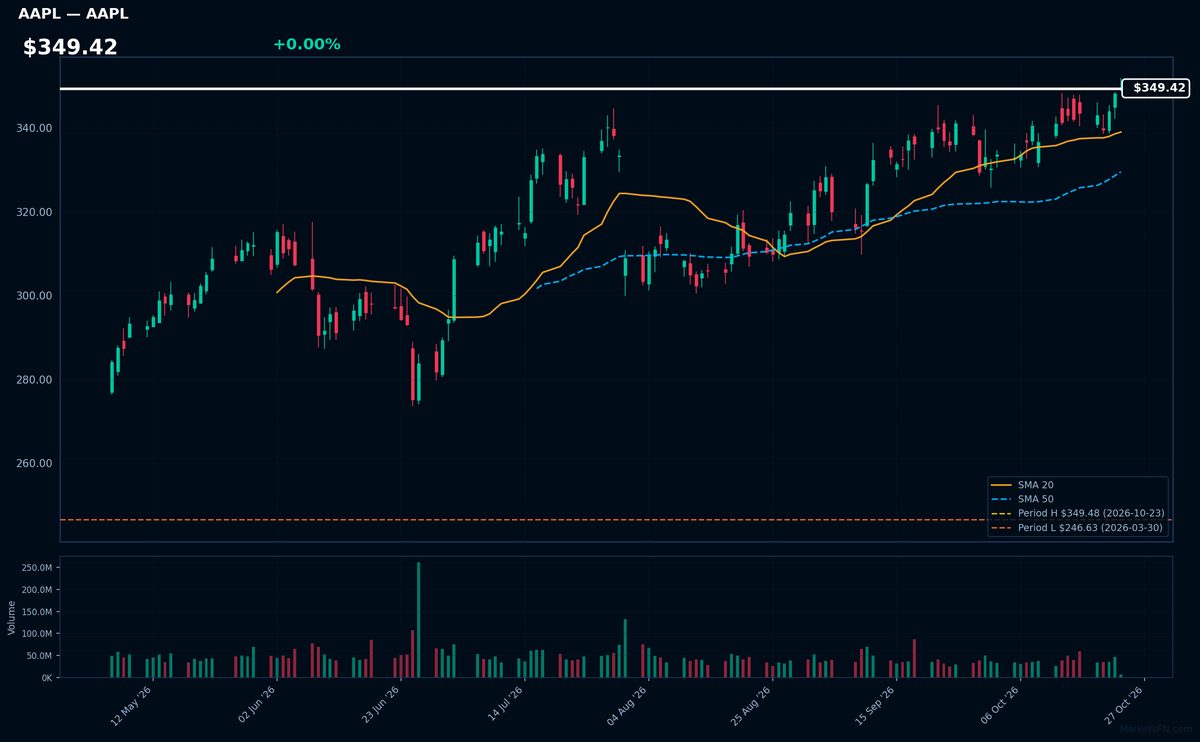
AAPL | Apple Inc | Technology | Price Last: $349.48 | % Realized: +34.63% | RSI: 65.8 | % above MA200: +18.7% | Trend: Above MA20, MA50, MA200
Apple Inc designs premium consumer electronics (iPhone, Mac), offers digital services (App Store, iCloud), and operates a fast-growing wearables segment (AirPods, Apple Watch). Investors care due to its ecosystem lock-in, pricing power, and recurring services revenue — critical in hardware slowdowns.
AAPL shows bullish momentum (RSI 65.8, price > MA20 > MA50 > MA200) and tests 52-week highs after a 34.6% yearly gain. Extreme proximity to all-time highs suggests breakout potential but warrants caution on overextension.
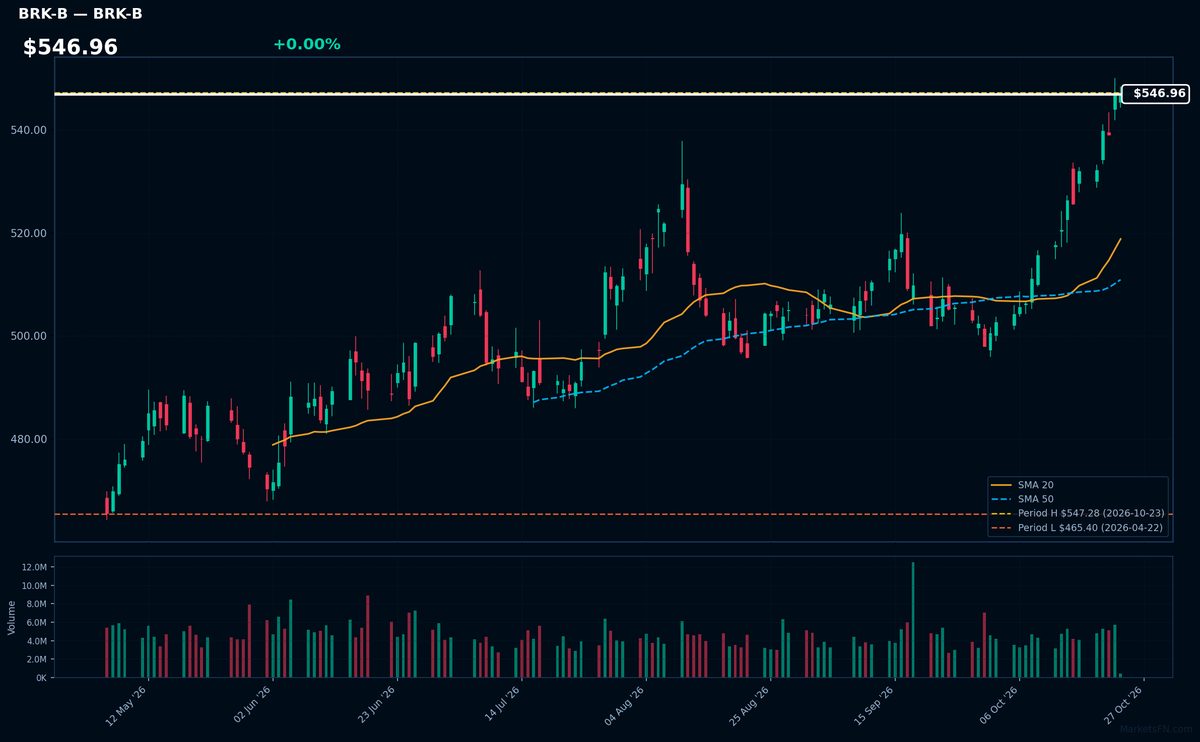
BRK-B | Berkshire Hathaway Inc | Financial | Price Last: $547.28 | % Realized: +11.65% | RSI: 81.5 | % above MA200: +10.6% | Trend: Above MA20, MA50, MA200
Berkshire Hathaway operates a diversified portfolio of insurance, manufacturing, and energy businesses alongside major equity holdings like Apple and Bank of America. Investors value its unique conglomerate structure, disciplined capital allocation under Warren Buffett, and exposure to both cyclical and defensive sectors through wholly-owned subsidiaries and public stock investments.
BRK-B shows strong bullish momentum with an overbought RSI(14) at 81.5 and a sustained uptrend (price > MA20 > MA50 > MA200). The stock trades at its 52-week high after gaining 11.7% annually, suggesting continued buying pressure but warranting caution given extreme RSI levels.
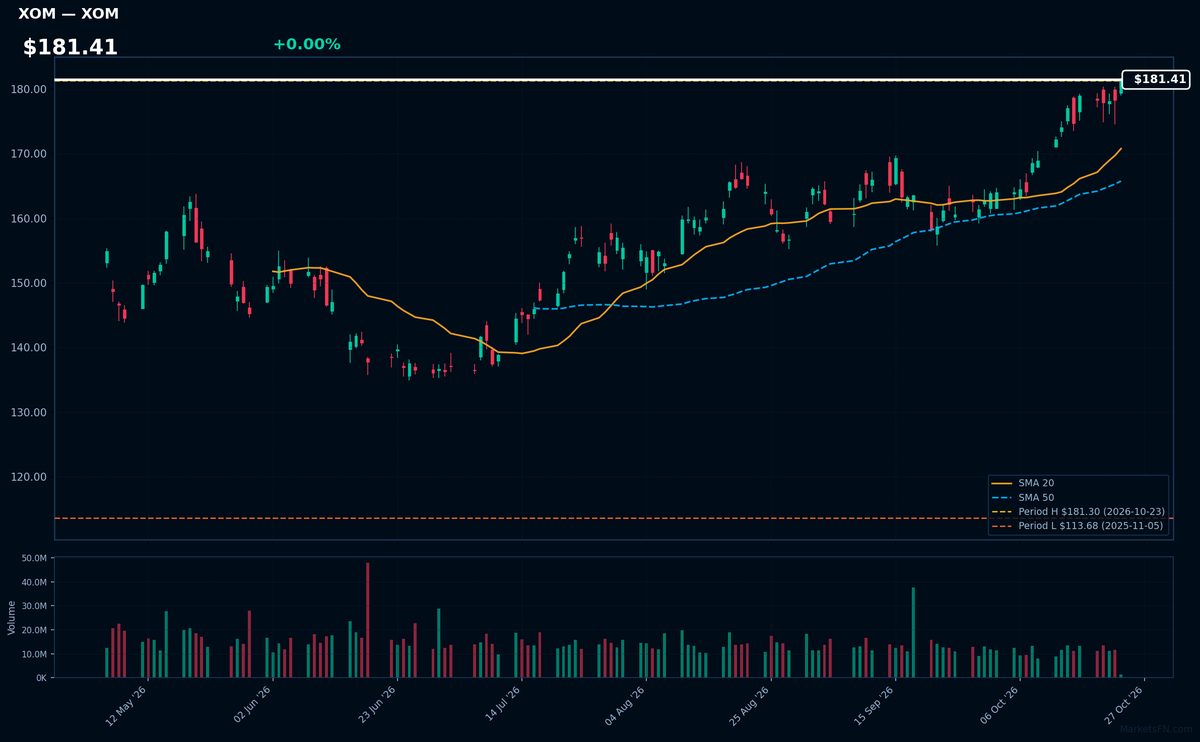
XOM | Exxon Mobil Corp | Energy | Price Last: $181.30 | % Realized: +56.32% | RSI: 74.3 | % above MA200: +18.4% | Trend: Above MA20, MA50, MA200
Exxon Mobil Corp (XOM) is an integrated energy giant engaged in oil/gas exploration, production, refining, and chemical manufacturing. Investors care due to its scale, dividend reliability, and sensitivity to energy prices, making it a bellwether for the sector.
Technically, XOM shows strong momentum (RSI 74.3, bullish MA alignment) but trades at its 52-week high after a 56.3% rally, warranting caution near overbought levels.
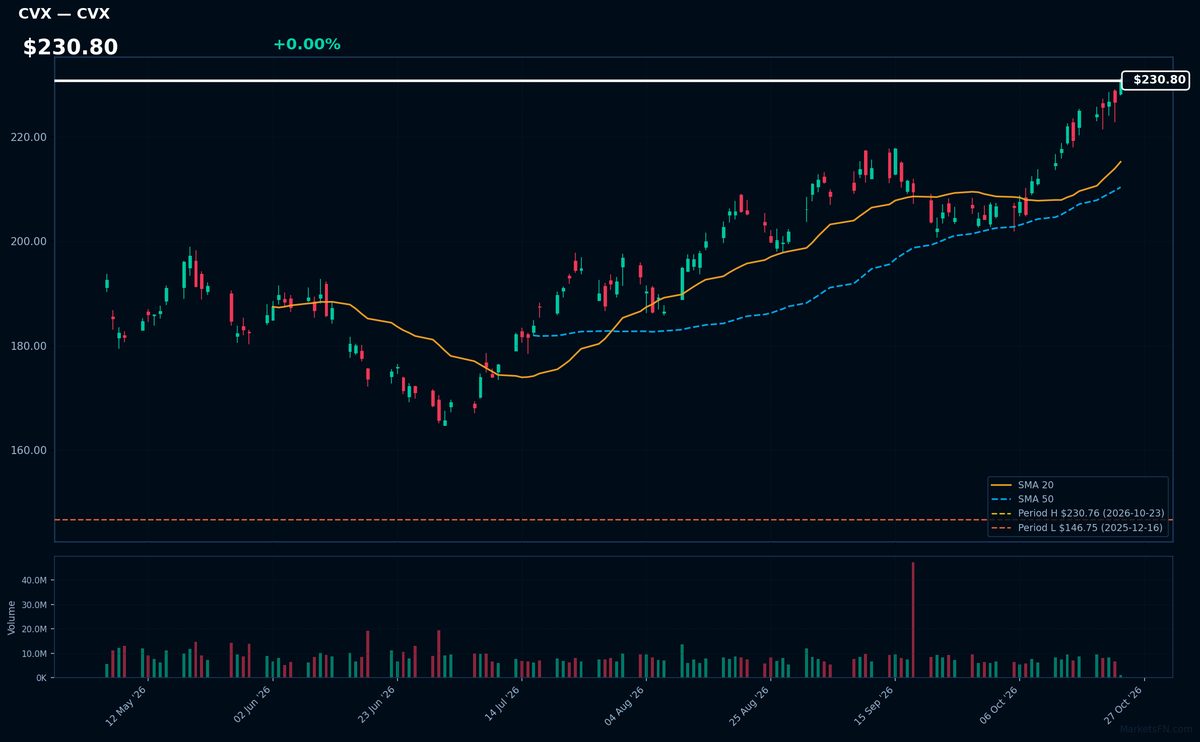
CVX | Chevron Corp | Energy | Price Last: $230.76 | % Realized: +47.40% | RSI: 75.1 | % above MA200: +20.4% | Trend: Above MA20, MA50, MA200
Chevron explores, produces, and refines oil/gas globally. Investors care because it's a top-5 global energy supplier with integrated operations (upstream to downstream), paying reliable dividends while benefiting from volatile commodity prices.
Technically bullish: RSI(14) at 75.1 shows overbought momentum, but sustained uptrend (price > MA20 > MA50 > MA200) and 47.4% 52W return suggest strength. Extreme proximity to 52W high (0.0% below) flags breakout potential.
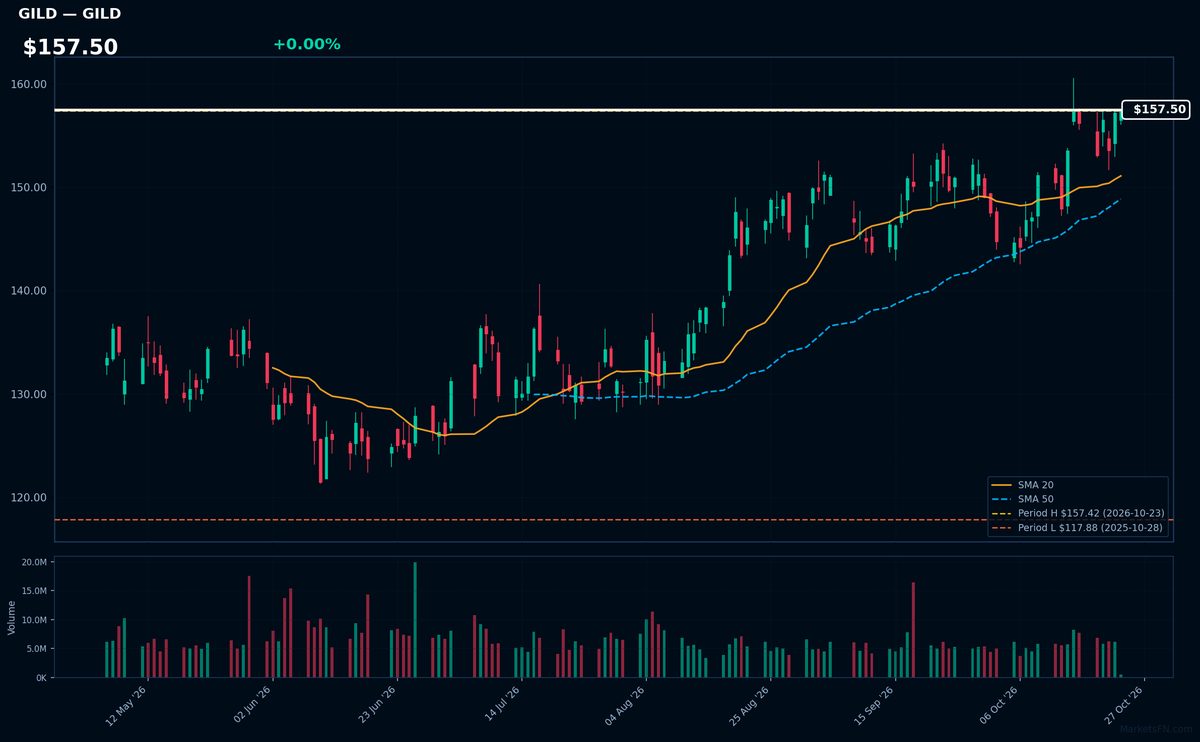
GILD | Gilead Sciences, Inc | Healthcare | Price Last: $157.42 | % Realized: +30.38% | RSI: 61.0 | % above MA200: +13.4% | Trend: Above MA20, MA50, MA200
Gilead Sciences develops antiviral drugs including HIV treatments (Biktarvy) and COVID-19 therapy Veklury. Investors care because its $30B+ HIV franchise generates reliable cash flows while its oncology pipeline (Trodelvy) offers growth.
GILD shows bullish momentum: RSI(14) at 61.0 confirms uptrend without overbought risk, while price > MA20 > MA50 > MA200 alignment suggests sustained strength. The stock tests 52-week highs after 30.4% annual return.
📉 Nearest to 52-Week Low
Sectors represented: Consumer Cyclical (2), Industrials (1), Utilities (1), Technology (1)
| Ticker | Company | Sector | Price Last | % Realized | 52-Week Low Date | RSI | % above MA200 | Trend |
|---|---|---|---|---|---|---|---|---|
| HWM | Howmet Aerospace Inc | Industrials | $186.15 | -6.97% | 2026-10-23 | 19.6 | -25.3% | Below MA20, MA50, MA200 |
| CMG | Chipotle Mexican Grill | Consumer Cyclical | $27.67 | -33.82% | 2026-10-23 | 25.2 | -19.4% | Below MA20, MA50, MA200 |
| NRG | NRG Energy Inc | Utilities | $91.54 | -44.12% | 2026-10-23 | 34.6 | -33.0% | Below MA20, MA50, MA200 |
| FSLR | First Solar Inc | Technology | $170.59 | -25.51% | 2026-10-23 | 37.6 | -21.6% | Below MA20, MA50, MA200 |
| APTV | Aptiv PLC | Consumer Cyclical | $42.49 | -49.99% | 2026-10-23 | 38.7 | -30.1% | Below MA20, MA50, MA200 |
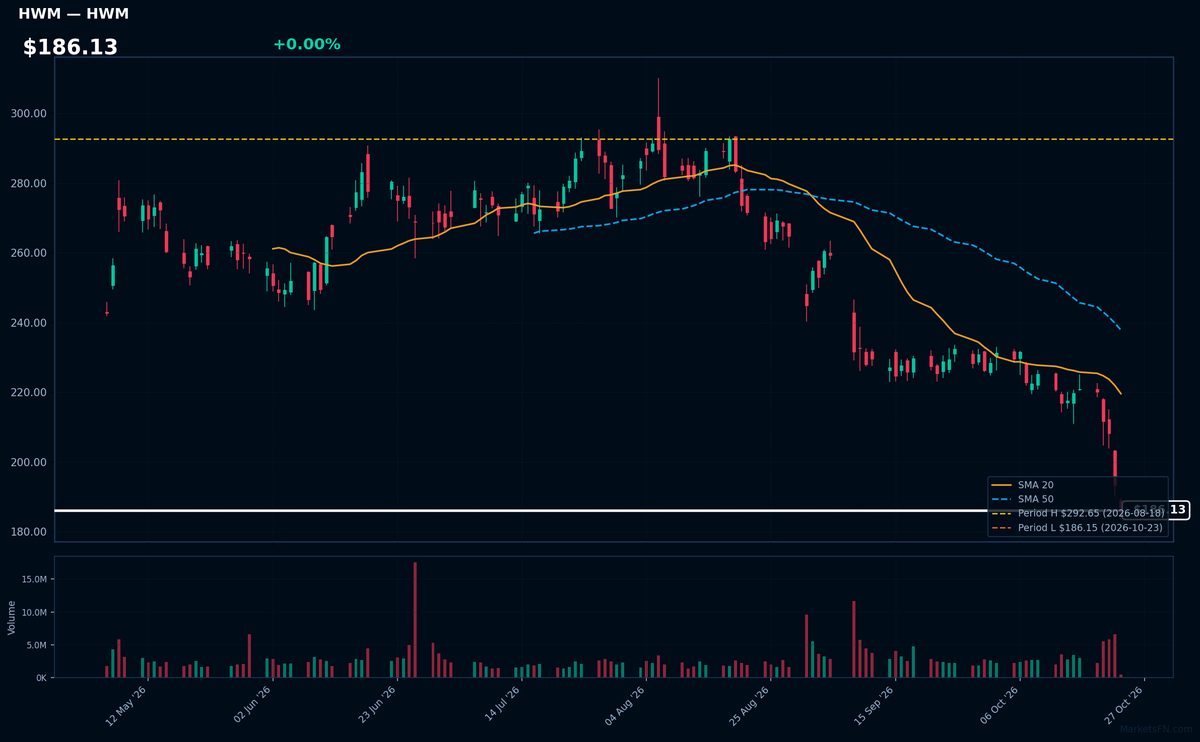
HWM | Howmet Aerospace Inc | Industrials | Price Last: $186.15 | % Realized: -6.97% | RSI: 19.6 | % above MA200: -25.3% | Trend: Below MA20, MA50, MA200
Howmet Aerospace Inc produces engineered components for jet engines, fastening systems, and titanium structures, critical to aerospace/defense OEMs. Investors track its exposure to Boeing/Airbus production cycles and aftermarket demand.
Technically distressed: RSI(14) at 19.6 (severely oversold) with bearish MA alignment (price<$186.13
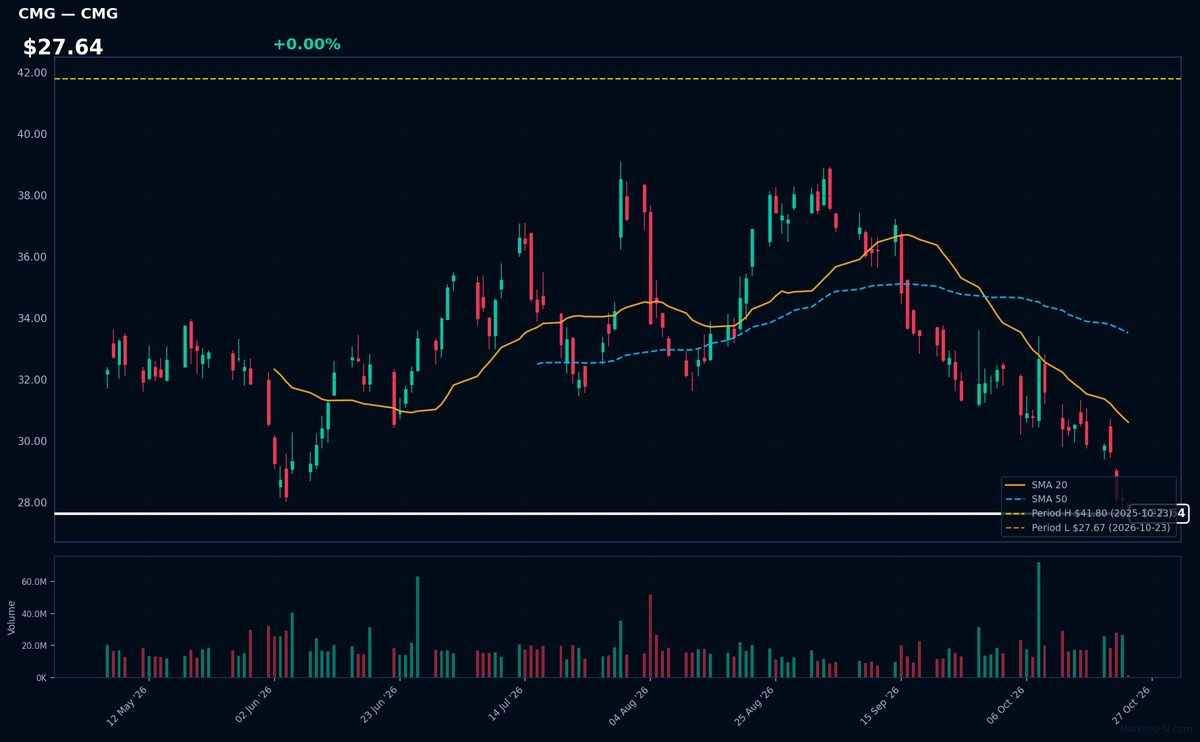
CMG | Chipotle Mexican Grill | Consumer Cyclical | Price Last: $27.67 | % Realized: -33.82% | RSI: 25.2 | % above MA200: -19.4% | Trend: Below MA20, MA50, MA200
Chipotle Mexican Grill operates a fast-casual restaurant chain specializing in customizable Mexican fare, with a focus on fresh ingredients and sustainability. Investors watch CMG for its premium positioning in quick-service dining and direct exposure to consumer discretionary spending trends.
CMG shows extreme technical weakness: RSI(14) at 25.2 (oversold) with sustained downtrend (price < MA20 < MA50 < MA200). The stock tests 52-week lows (-33.8% YoY) with 0.0% upside to support — a clear warning sign absent fundamental catalysts.
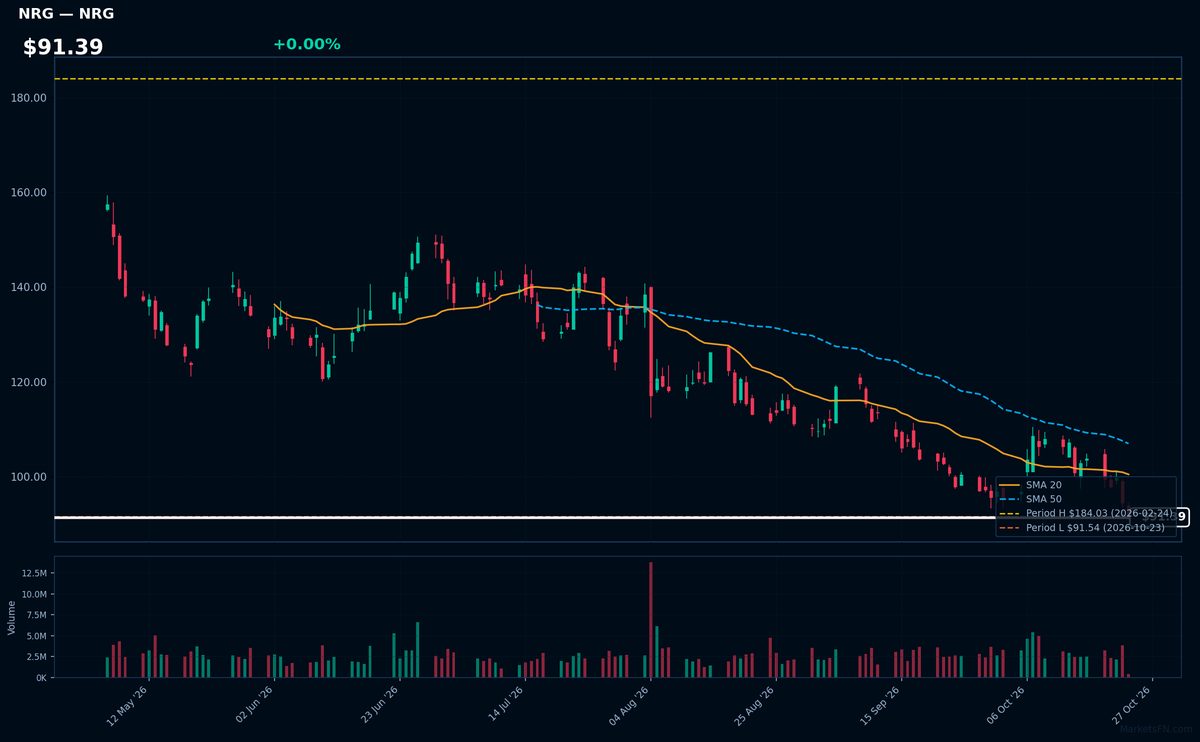
NRG | NRG Energy Inc | Utilities | Price Last: $91.54 | % Realized: -44.12% | RSI: 34.6 | % above MA200: -33.0% | Trend: Below MA20, MA50, MA200
NRG Energy operates competitive power generation and retail electricity across U.S. markets. Investors watch its merchant power exposure and retail margins, which drive volatile earnings. The stock serves as a liquid proxy for U.S. power price swings and retail energy competition.
NRG shows extreme technical weakness: RSI(14) at 34.6 confirms oversold conditions while bearish MA alignment (price < MA20 < MA50 < MA200) and -44.1% 52-week return signal persistent downtrend. Trading 0.0% above 52-week lows suggests capitulation risk.
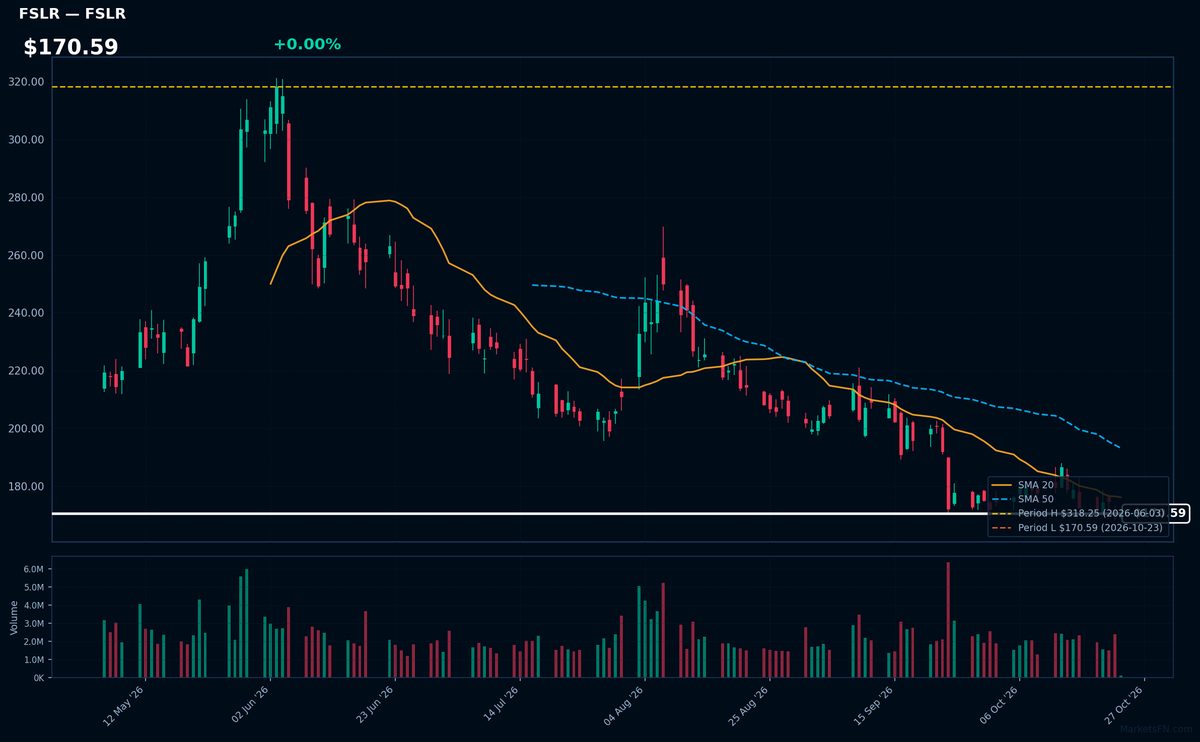
FSLR | First Solar Inc | Technology | Price Last: $170.59 | % Realized: -25.51% | RSI: 37.6 | % above MA200: -21.6% | Trend: Below MA20, MA50, MA200
First Solar manufactures thin-film solar panels using proprietary cadmium telluride technology, offering cost and efficiency advantages in utility-scale projects. Investors watch FSLR as a pure-play on solar energy adoption, particularly in U.S. markets benefiting from Inflation Reduction Act incentives.
FSLR shows extreme technical weakness: RSI(14) at 37.6 confirms bearish momentum, with sustained downtrend (price < MA20 < MA50 < MA200). The stock tests 52-week lows (-25.5% YoY), indicating severe selling pressure and potential support breakdown risk.
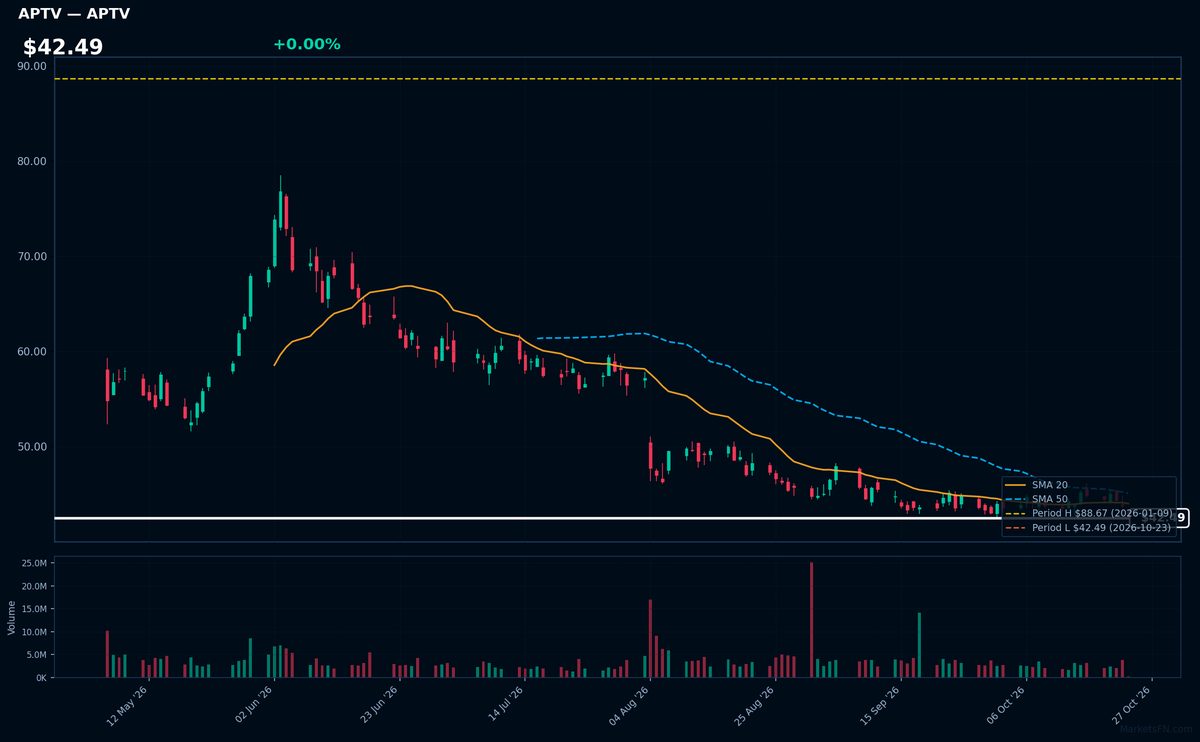
APTV | Aptiv PLC | Consumer Cyclical | Price Last: $42.49 | % Realized: -49.99% | RSI: 38.7 | % above MA200: -30.1% | Trend: Below MA20, MA50, MA200
Aptiv PLC designs and manufactures vehicle components and autonomous driving technologies for automakers. Investors watch Aptiv as a key player in the electrification and automation megatrends reshaping the auto industry.
Aptiv shows severe technical weakness: RSI(14) at 38.7 signals oversold conditions amid a sustained downtrend (price < MA20 < MA50 < MA200). The stock tests its 52-week low after a 50.0% annual decline — a clear warning sign.
Market Commentary
The clustering of S&P 500 stocks at 52-week extremes reflects divergent market momentum, with Apple (AAPL), Berkshire Hathaway (BRK-B), and energy giants Exxon (XOM) and Chevron (CVX) at highs, while Howmet (HWM), Chipotle (CMG), and First Solar (FSLR) hover near lows. This polarization suggests investor preference for cash-rich megacaps and energy beneficiaries of elevated oil prices, contrasted with weakness in cyclical industrials and select consumer discretionary names. The simultaneous extremes indicate a market grappling with sector-specific risks rather than broad-based trends.
Sector rotation appears driven by macro uncertainty: energy (XOM, CVX) benefits from geopolitical supply risks, while defensive tech (AAPL) and diversified conglomerates (BRK-B) attract capital. Conversely, solar (FSLR) faces regulatory headwinds, and industrials (HWM, APTV) reflect manufacturing slowdown concerns. Chipotle's (CMG) proximity to lows may signal consumer spending fatigue in premium QSR, contrasting with Gilead's (GILD) biotech resilience at highs.
Key levels to monitor include the 52-week highs for AAPL and BRK-B as sentiment gauges, while CMG and FSLR must hold their 52-week lows to avoid breakdowns. Catalysts include oil price volatility for energy names, Fed policy impacts on consumer stocks (CMG), and tech earnings resilience (AAPL). Any break beyond these extremes could accelerate momentum trades in either direction.
Methodology: All 503 S&P 500 constituents screened. 52-week high = highest daily close over the past 252 trading days (approx. 1 year). 52-week low = lowest daily close over the same period. Distance = (current price / extreme − 1) × 100. Technical indicators computed on up to 1 year of daily OHLCV data.
Disclaimer: For informational purposes only. Not investment advice. Past performance is not indicative of future results.