S&P 500 2026 YTD Highs & Lows Radar: Thermo Fisher Scientific (TMO), Home Depot, (HD) and more
MarketsFN Team

S&P 500 2026 YTD Highs & Lows Radar: Thermo Fisher Scientific (TMO), Home Depot, (HD) and more
Screening all 503 S&P 500 constituents for stocks nearest to their 2026 year-to-date high and their 2026 YTD low. Data as of September 30, 2026. % Realized = total return since Jan 1 2026.
Legend: RSI > 70 = overbought · RSI < 30 = oversold · Green % Realized = positive YTD return · Red = negative.
📈 Nearest to 2026 High
Sectors represented: Healthcare (3), Technology (2)
| Ticker | Company | Sector | Price Last | % Realized | 2026 YTD High Date | RSI | % above MA200 | Trend |
|---|---|---|---|---|---|---|---|---|
| TMO | Thermo Fisher Scientific Inc | Healthcare | $679.61 | +14.70% | 2026-09-29 | 70.7 | +25.4% | Above MA20, MA50, MA200 |
| CRWD | Crowdstrike Holdings Inc | Technology | $262.74 | +131.70% | 2026-09-29 | 66.5 | +72.7% | Above MA20, MA50, MA200 |
| NTAP | Netapp Inc | Technology | $209.18 | +96.47% | 2026-09-29 | 68.9 | +51.9% | Above MA20, MA50, MA200 |
| WST | West Pharmaceutical Services, Inc | Healthcare | $376.63 | +36.26% | 2026-09-29 | 64.4 | +25.0% | Above MA20, MA50, MA200 |
| WAT | Waters Corp | Healthcare | $443.26 | +16.05% | 2026-09-29 | 69.2 | +22.1% | Above MA20, MA50, MA200 |
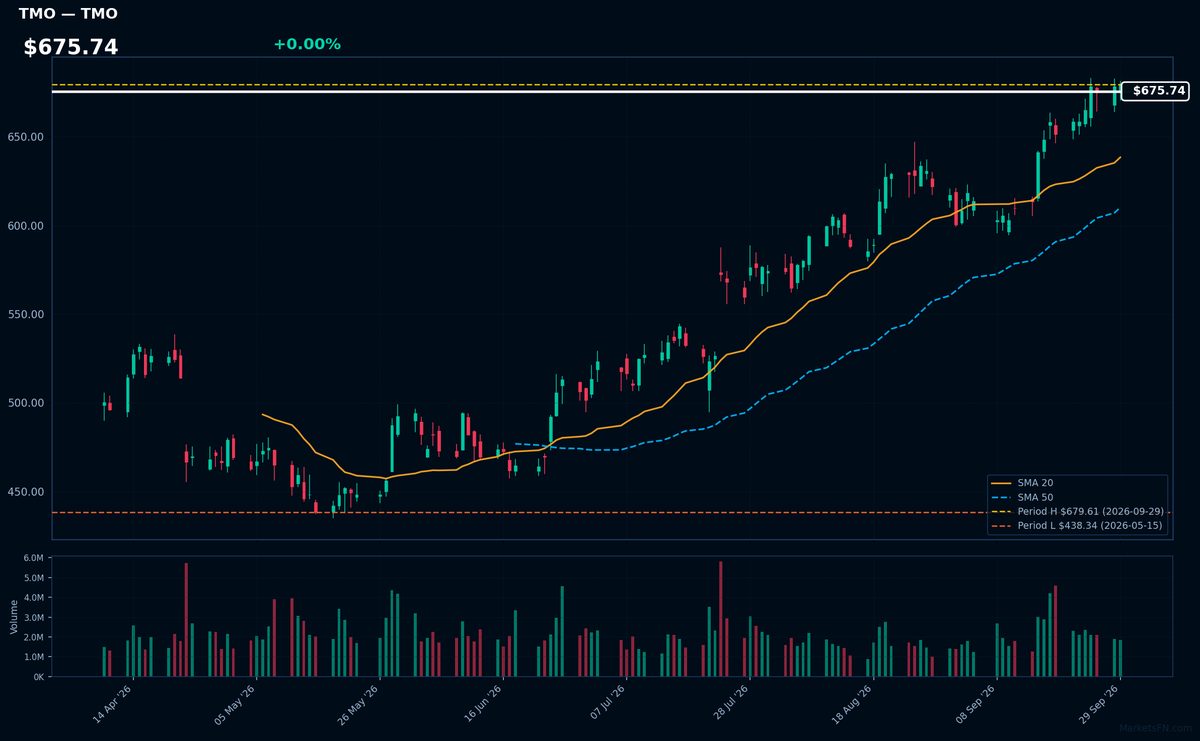
TMO | Thermo Fisher Scientific Inc | Healthcare | Price Last: $679.61 | % Realized: +14.70% | RSI: 70.7 | % above MA200: +25.4% | Trend: Above MA20, MA50, MA200
Thermo Fisher Scientific Inc is a life sciences and laboratory equipment company providing analytical instruments, laboratory equipment, and services to pharmaceutical, biotech, and research institutions, enabling them to advance scientific discovery and product development.
Thermo Fisher's current technical situation indicates strong momentum: RSI(14) is 70.7, with a bullish MA alignment (price > MA20 > MA50 > MA200) and the stock is 0.0% below its 2026 YTD high, suggesting a potential breakout.
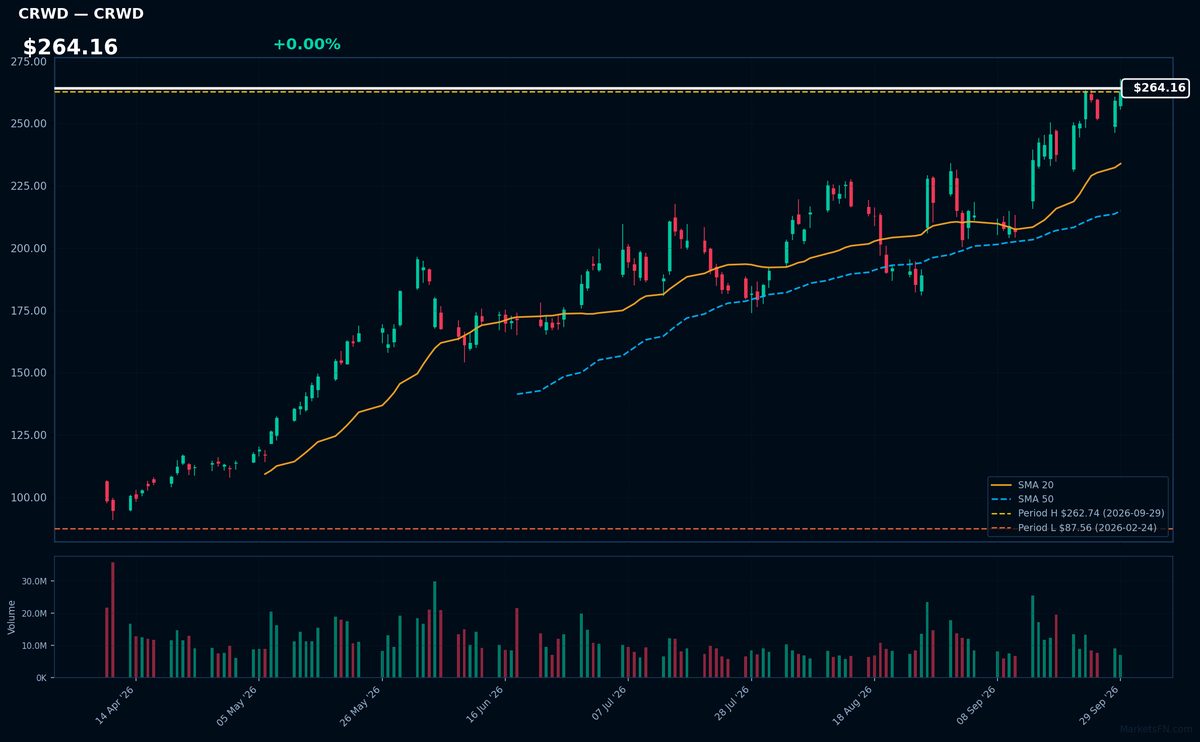
CRWD | Crowdstrike Holdings Inc | Technology | Price Last: $262.74 | % Realized: +131.70% | RSI: 66.5 | % above MA200: +72.7% | Trend: Above MA20, MA50, MA200
Crowdstrike Holdings Inc is a cybersecurity company providing cloud-delivered endpoint and cloud workload protection. Investors should care because its innovative solutions are in high demand, driving growth. Specific details about its products and services are not provided in the data.
Crowdstrike's current technical situation indicates strong momentum: RSI(14) is 66.5, and the stock is in a sustained uptrend with price > MA20 > MA50 > MA200. It's 0.0% below its 2026 YTD high, suggesting a potential breakout.
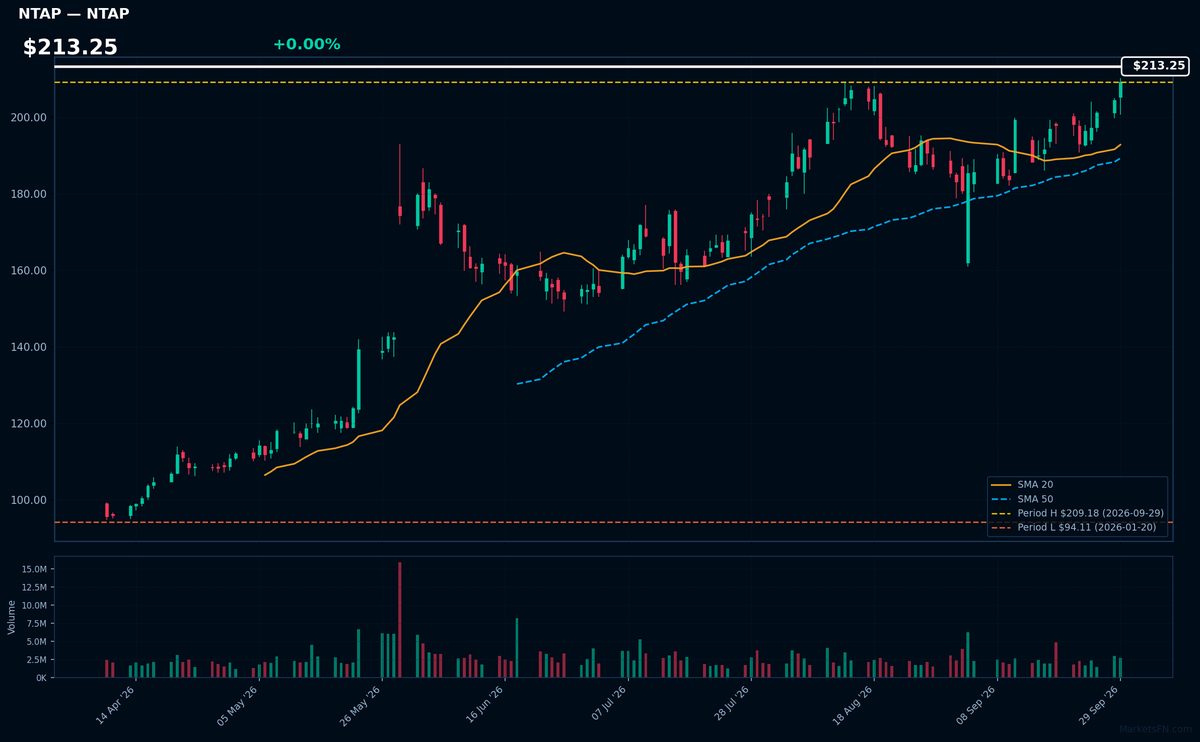
NTAP | Netapp Inc | Technology | Price Last: $209.18 | % Realized: +96.47% | RSI: 68.9 | % above MA200: +51.9% | Trend: Above MA20, MA50, MA200
Netapp Inc (NTAP) provides data storage and management solutions, helping organizations efficiently manage and secure their data. Investors should care as the company's technology is crucial for cloud infrastructure and data-driven businesses.
NTAP's RSI(14) is 68.9, indicating strong momentum. The MA alignment (price > MA20 > MA50 > MA200) confirms a sustained uptrend. With the stock at its 2026 YTD high, it's near a potential breakout level, having returned 96.5% YTD.
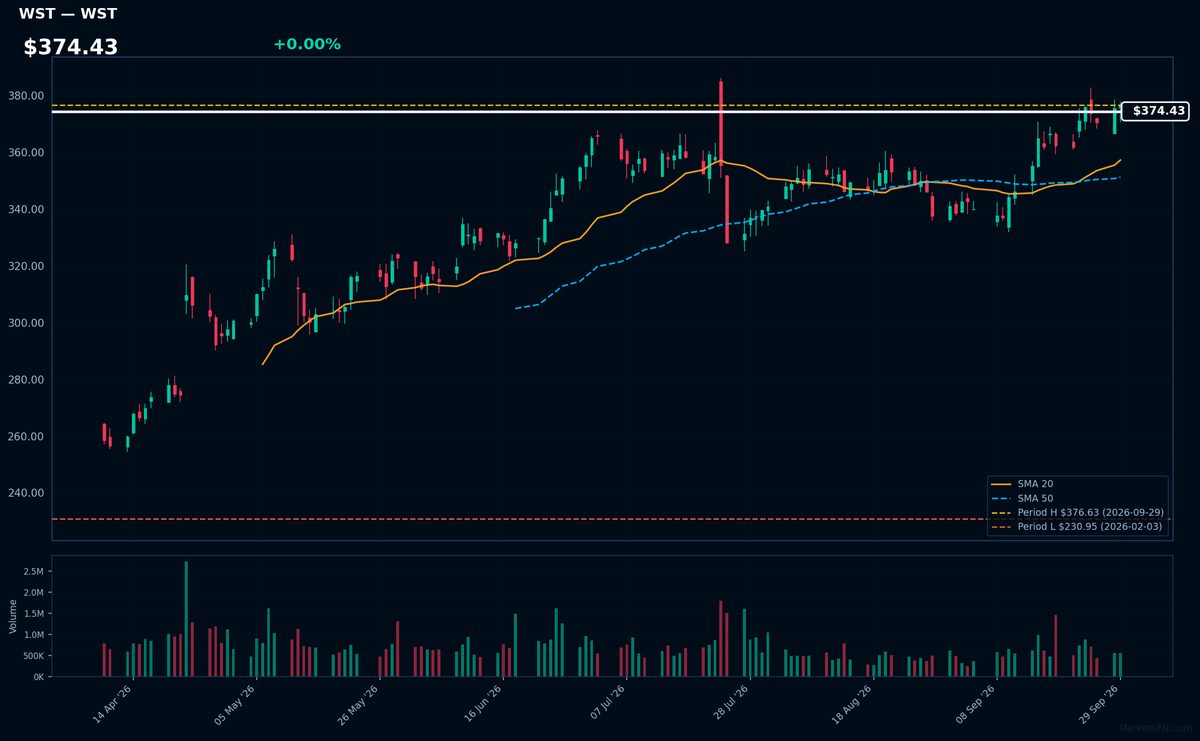
WST | West Pharmaceutical Services, Inc | Healthcare | Price Last: $376.63 | % Realized: +36.26% | RSI: 64.4 | % above MA200: +25.0% | Trend: Above MA20, MA50, MA200
West Pharmaceutical Services, Inc is a global manufacturer of packaging components and delivery systems for injectable drugs and other pharmaceutical products; investors should care because of its critical role in the pharmaceutical supply chain and potential for growth driven by increasing demand for injectables.
The stock exhibits a bullish MA alignment with price > MA20 > MA50 > MA200, an RSI(14) of 64.4 indicating rising momentum, and is 0.0% below its 2026 YTD high, suggesting a potential breakout; the 36.3% 2026 YTD return reinforces this positive technical picture.
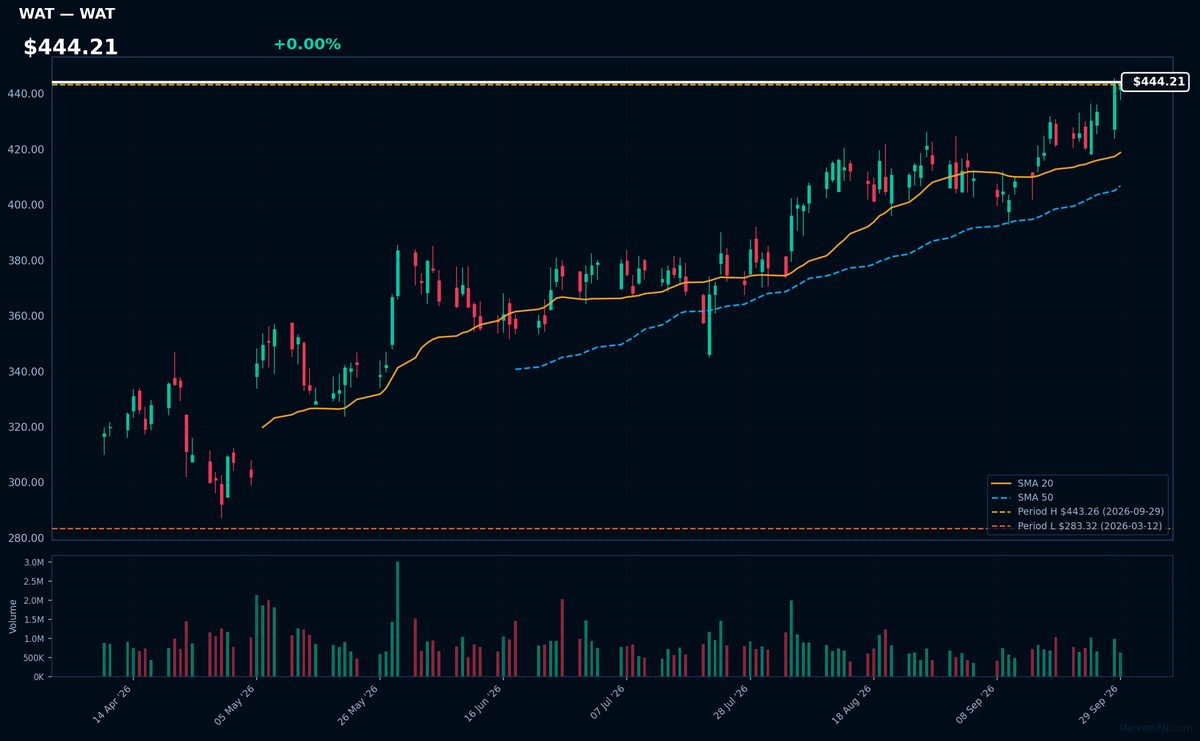
WAT | Waters Corp | Healthcare | Price Last: $443.26 | % Realized: +16.05% | RSI: 69.2 | % above MA200: +22.1% | Trend: Above MA20, MA50, MA200
Waters Corp is a leading manufacturer of analytical instruments used in pharmaceutical, biotechnology, and chemical industries. Investors should care because its products are crucial for quality control and research, driving demand and revenue growth.
Waters Corp is near a potential breakout at $444.21, 0.0% below its 2026 YTD high, with RSI(14) at 69.2 and a bullish MA alignment: price > MA20 > MA50 > MA200, indicating sustained uptrend and strong momentum.
📉 Nearest to 2026 Low
Sectors represented: Consumer Cyclical (2), Communication Services (1), Real Estate (1), Industrials (1)
| Ticker | Company | Sector | Price Last | % Realized | 2026 YTD Low Date | RSI | % above MA200 | Trend |
|---|---|---|---|---|---|---|---|---|
| HD | Home Depot, Inc | Consumer Cyclical | $288.04 | -16.71% | 2026-09-29 | 28.9 | -15.2% | Below MA20, MA50, MA200 |
| LOW | Lowe's Cos., Inc | Consumer Cyclical | $187.26 | -24.15% | 2026-09-29 | 31.3 | -19.4% | Below MA20, MA50, MA200 |
| CMCSA | Comcast Corp | Communication Services | $21.60 | -21.98% | 2026-09-29 | 29.2 | -19.3% | Below MA20, MA50, MA200 |
| O | Realty Income Corp | Real Estate | $55.14 | -3.79% | 2026-09-29 | 14.3 | -10.9% | Below MA20, MA50, MA200 |
| LHX | L3Harris Technologies Inc | Industrials | $236.47 | -22.34% | 2026-09-29 | 22.2 | -24.0% | Below MA20, MA50, MA200 |
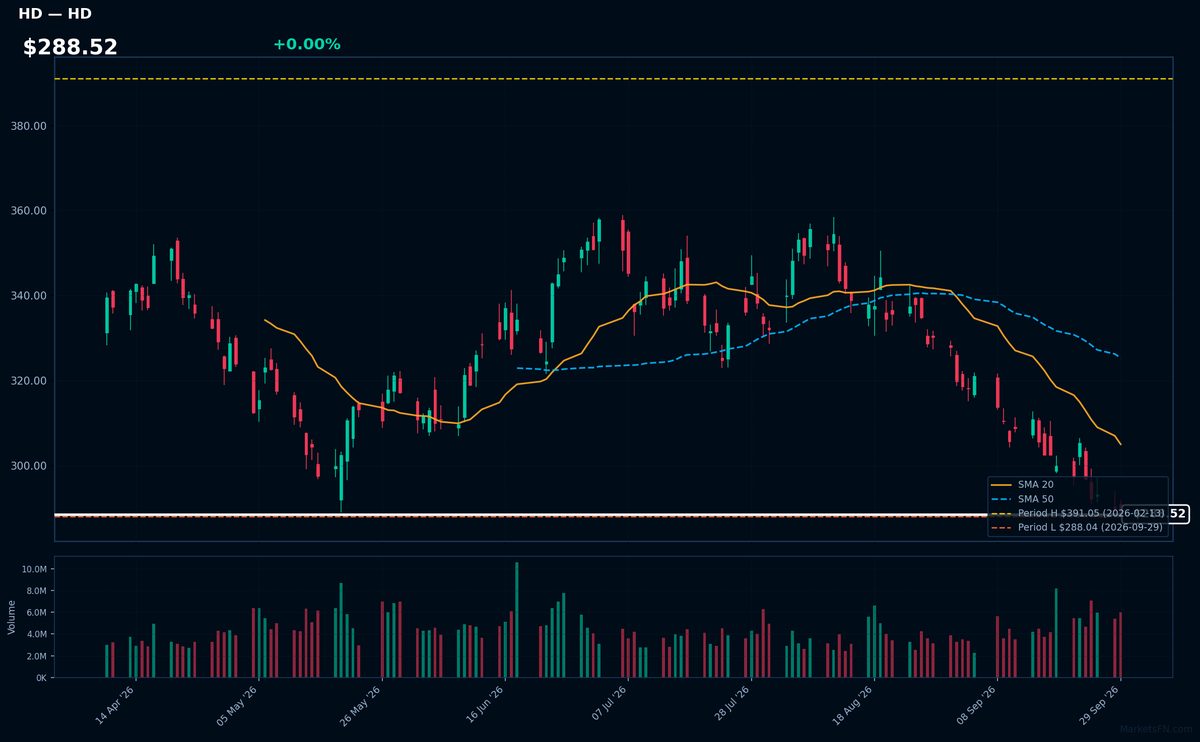
HD | Home Depot, Inc | Consumer Cyclical | Price Last: $288.04 | % Realized: -16.71% | RSI: 28.9 | % above MA200: -15.2% | Trend: Below MA20, MA50, MA200
Home Depot, Inc operates as a home improvement retailer, selling products such as building materials, tools, and appliances. Investors care about its performance as it reflects housing market trends and consumer spending habits.
Home Depot's technical situation is bearish, with an RSI(14) of 28.9 indicating oversold conditions, and a sustained downtrend as price ($288.52) remains below MA20, MA50, and MA200, testing major support at its 2026 YTD low.
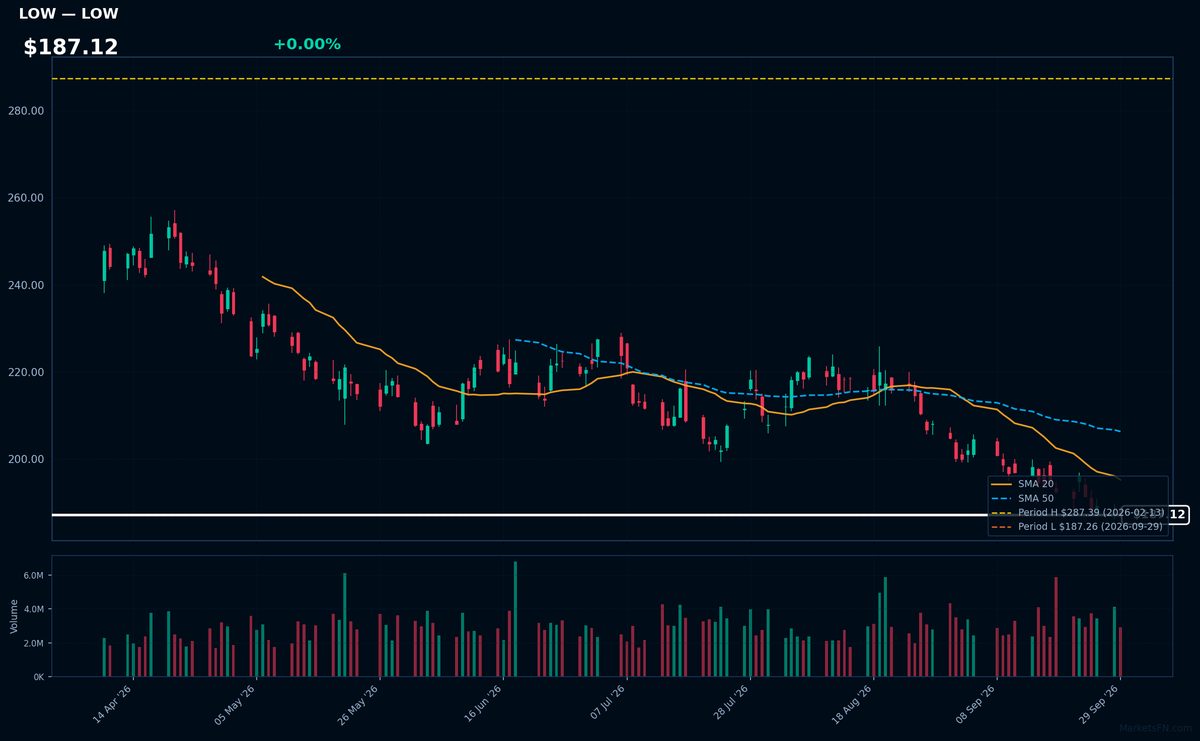
LOW | Lowe's Cos., Inc | Consumer Cyclical | Price Last: $187.26 | % Realized: -24.15% | RSI: 31.3 | % above MA200: -19.4% | Trend: Below MA20, MA50, MA200
Lowe's Cos., Inc operates as a home improvement retailer, selling products such as building materials, tools, and appliances. Investors should care because its performance reflects housing market trends and consumer spending habits.
Lowe's is in a sustained downtrend with price ($187.12) below MA20, MA50, and MA200. RSI(14) is 31.3, near oversold territory, and the stock is testing major support at its 2026 YTD low.
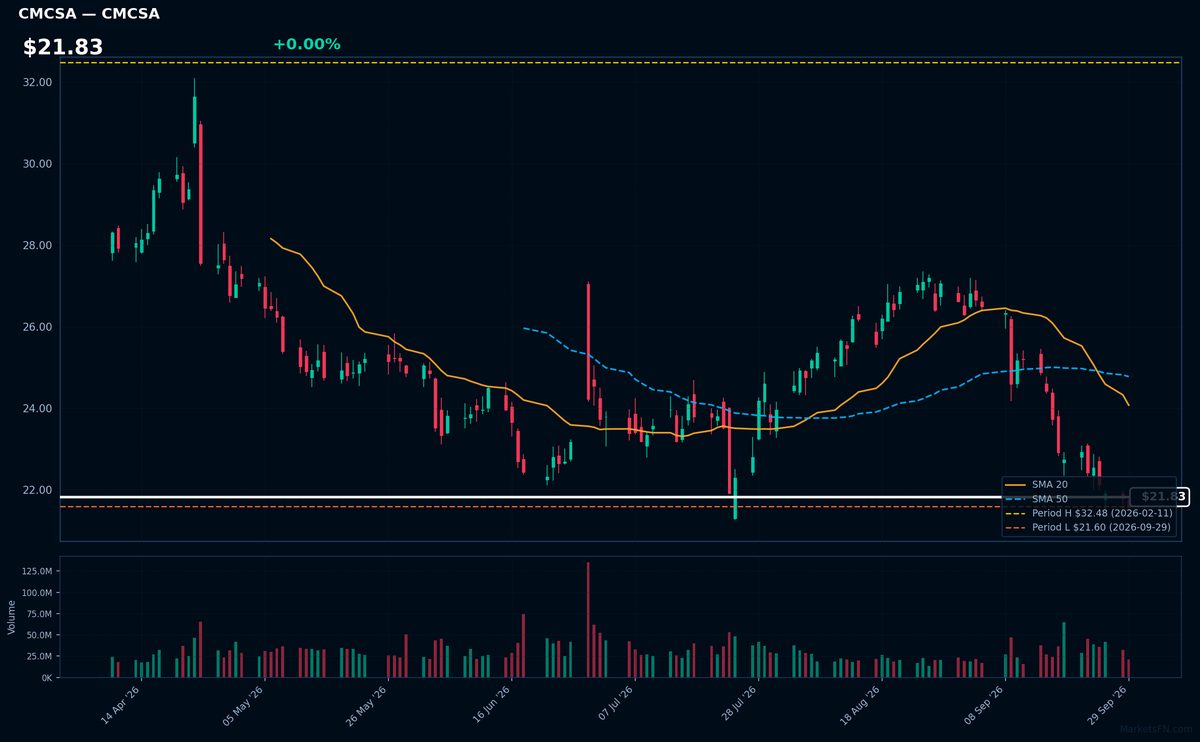
CMCSA | Comcast Corp | Communication Services | Price Last: $21.60 | % Realized: -21.98% | RSI: 29.2 | % above MA200: -19.3% | Trend: Below MA20, MA50, MA200
Comcast Corp is a media and telecommunications conglomerate providing cable television, internet, and phone services, as well as owning NBCUniversal, a major media company with film, television, and theme park assets, making it a significant player in both consumer connectivity and entertainment.
Comcast Corp's technical situation is bearish, with an RSI(14) of 29.2 indicating oversold conditions, and a sustained downtrend as price ($21.83) remains below MA20, MA50, and MA200, with the stock testing major support at its 2026 YTD low.
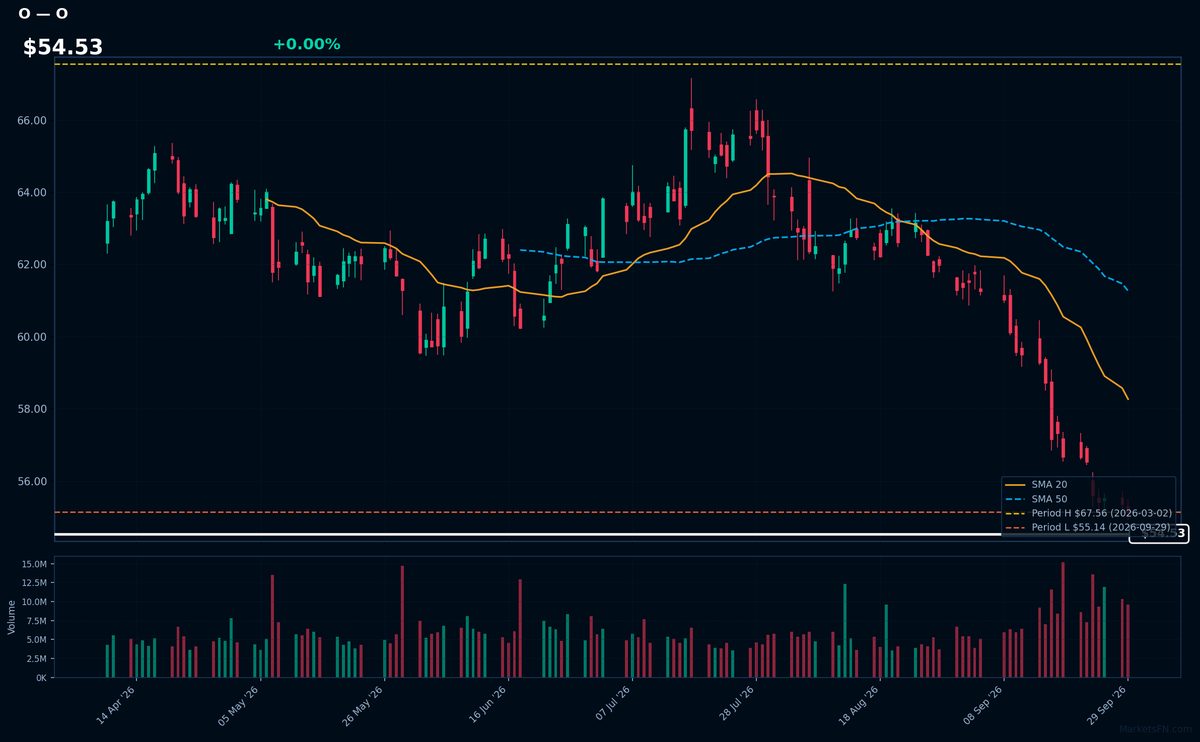
O | Realty Income Corp | Real Estate | Price Last: $55.14 | % Realized: -3.79% | RSI: 14.3 | % above MA200: -10.9% | Trend: Below MA20, MA50, MA200
Realty Income Corp is a real estate investment trust that invests in commercial properties, providing monthly dividend distributions to shareholders; investors care about its stable income stream and property portfolio performance.
Realty Income Corp's technical situation is bearish, with an RSI(14) of 14.3 indicating oversold conditions, and a sustained downtrend as price ($54.53) remains below MA20, MA50, and MA200, testing major support at its 2026 YTD low.
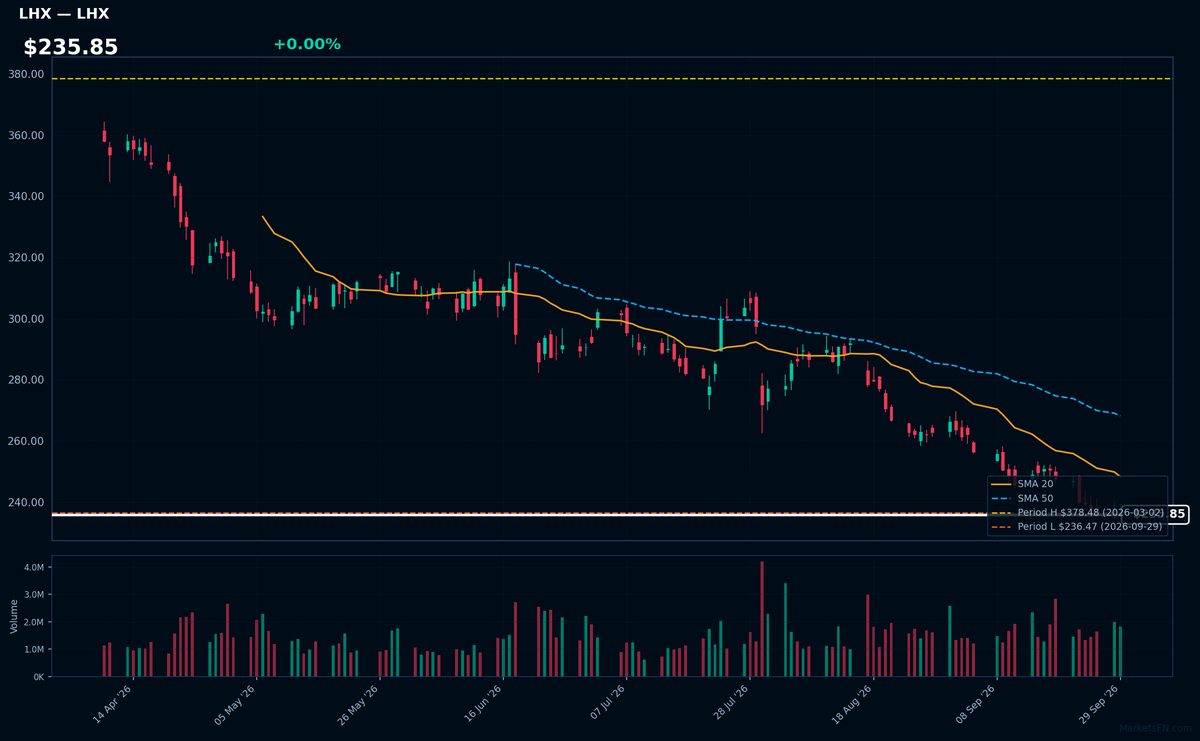
LHX | L3Harris Technologies Inc | Industrials | Price Last: $236.47 | % Realized: -22.34% | RSI: 22.2 | % above MA200: -24.0% | Trend: Below MA20, MA50, MA200
L3Harris Technologies Inc is a defense technology company providing advanced defense and commercial technologies. Investors should care due to its significant role in the defense industry, with potential impacts from geopolitical tensions and government spending.
L3Harris is in a sustained downtrend with price ($235.85) below MA20, MA50, and MA200. The RSI(14) is 22.2, near oversold territory, and the stock is testing its 2026 YTD low, having fallen -22.3% YTD, indicating a potential warning sign.
Market Commentary
The S&P 500 stocks listed are currently trading near their year-to-date (YTD) extremes for 2026. Specifically, TMO, CRWD, NTAP, WST, and WAT are at their YTD highs, while HD, LOW, CMCSA, O, and LHX are at their YTD lows. This indicates that these stocks have either reached new highs or lows since the beginning of 2026 and are currently trading at or very near those levels.
The stocks near their 2026 highs are primarily from the healthcare and technology sectors, suggesting strong performance in these areas. Conversely, the stocks near their 2026 lows are from the consumer discretionary, real estate, and industrials sectors, indicating potential challenges or weaker demand in these sectors. This divergence may reflect varying market conditions and investor sentiment towards different sectors.
Investors should monitor these stocks and their respective sectors for signs of continued strength or weakness. Watching for catalysts such as earnings reports, industry trends, and macroeconomic indicators will be crucial in determining whether these stocks continue to trade near their YTD extremes or if new trends emerge.
Methodology: All 503 S&P 500 constituents screened. Close prices downloaded from 2026-01-01. Period high = highest close since Jan 1 2026; period low = lowest close since Jan 1 2026. Distance = (current price / period extreme − 1) × 100. Technical indicators computed on up to 1 year of daily OHLCV data.
Disclaimer: For informational purposes only. Not investment advice. Past performance is not indicative of future results.

