S&P 500 2026 YTD Highs & Lows Radar: Palo Alto Networks (PANW), Home Depot, (HD) and more
MarketsFN Team

S&P 500 2026 YTD Highs & Lows Radar: Palo Alto Networks (PANW), Home Depot, (HD) and more
Screening all 503 S&P 500 constituents for stocks nearest to their 2026 year-to-date high and their 2026 YTD low. Data as of October 01, 2026. % Realized = total return since Jan 1 2026.
Legend: RSI > 70 = overbought · RSI < 30 = oversold · Green % Realized = positive YTD return · Red = negative.
📈 Nearest to 2026 High
Sectors represented: Technology (4), Communication Services (1)
| Ticker | Company | Sector | Price Last | % Realized | 2026 YTD High Date | RSI | % above MA200 | Trend |
|---|---|---|---|---|---|---|---|---|
| PANW | Palo Alto Networks Inc | Technology | $397.31 | +121.50% | 2026-09-30 | 57.3 | +59.4% | Above MA20, MA50, MA200 |
| CRWD | Crowdstrike Holdings Inc | Technology | $264.75 | +133.48% | 2026-09-30 | 63.6 | +73.3% | Above MA20, MA50, MA200 |
| FTNT | Fortinet Inc | Technology | $178.76 | +129.53% | 2026-09-30 | 58.2 | +51.4% | Above MA20, MA50, MA200 |
| HPE | Hewlett Packard Enterprise Co | Technology | $63.89 | +164.34% | 2026-09-30 | 60.6 | +74.2% | Above MA20, MA50, MA200 |
| WBD | Warner Bros. Discovery Inc | Communication Services | $30.95 | +8.56% | 2026-09-30 | 75.4 | +11.9% | Above MA20, MA50, MA200 |
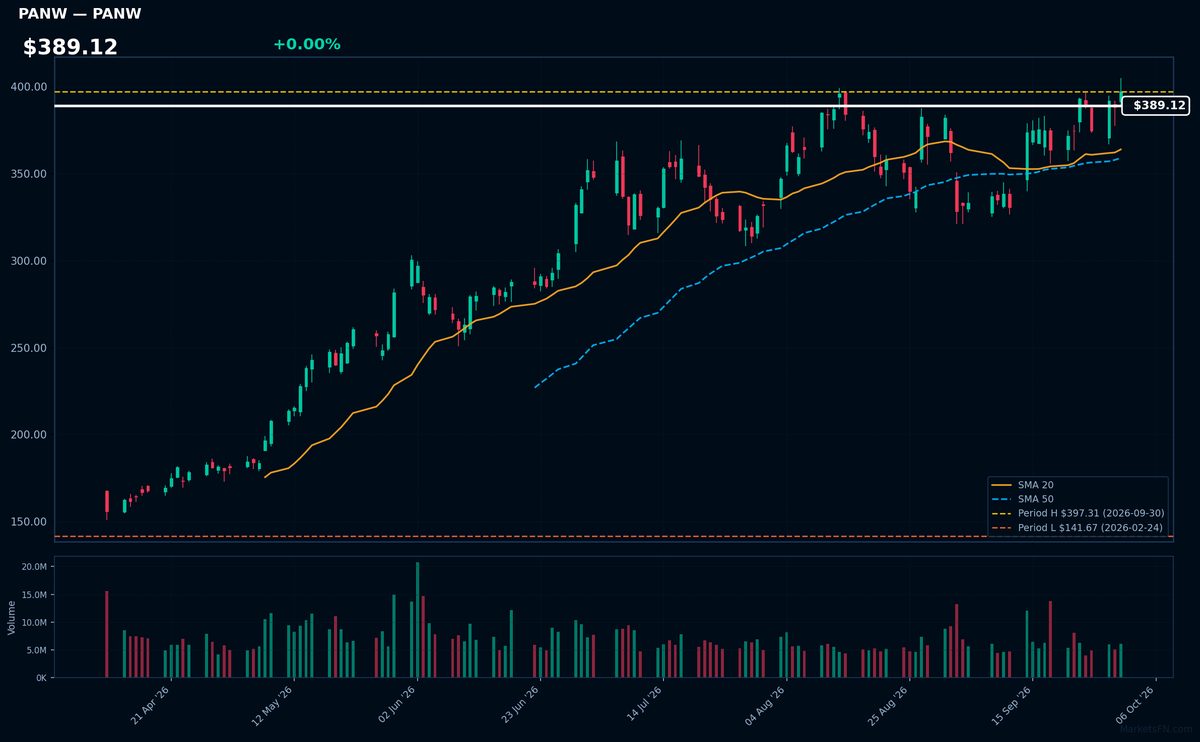
PANW | Palo Alto Networks Inc | Technology | Price Last: $397.31 | % Realized: +121.50% | RSI: 57.3 | % above MA200: +59.4% | Trend: Above MA20, MA50, MA200
Palo Alto Networks Inc is a cybersecurity company providing advanced threat prevention and security solutions. Investors should care due to its strong market position and innovative products that address evolving cyber threats, potentially driving growth.
Palo Alto Networks Inc is in a sustained uptrend with price ($389.12) above MA20 > MA50 > MA200. RSI(14) is 57.3, indicating moderate momentum. The stock is 0.0% below its 2026 YTD high, suggesting a potential breakout.
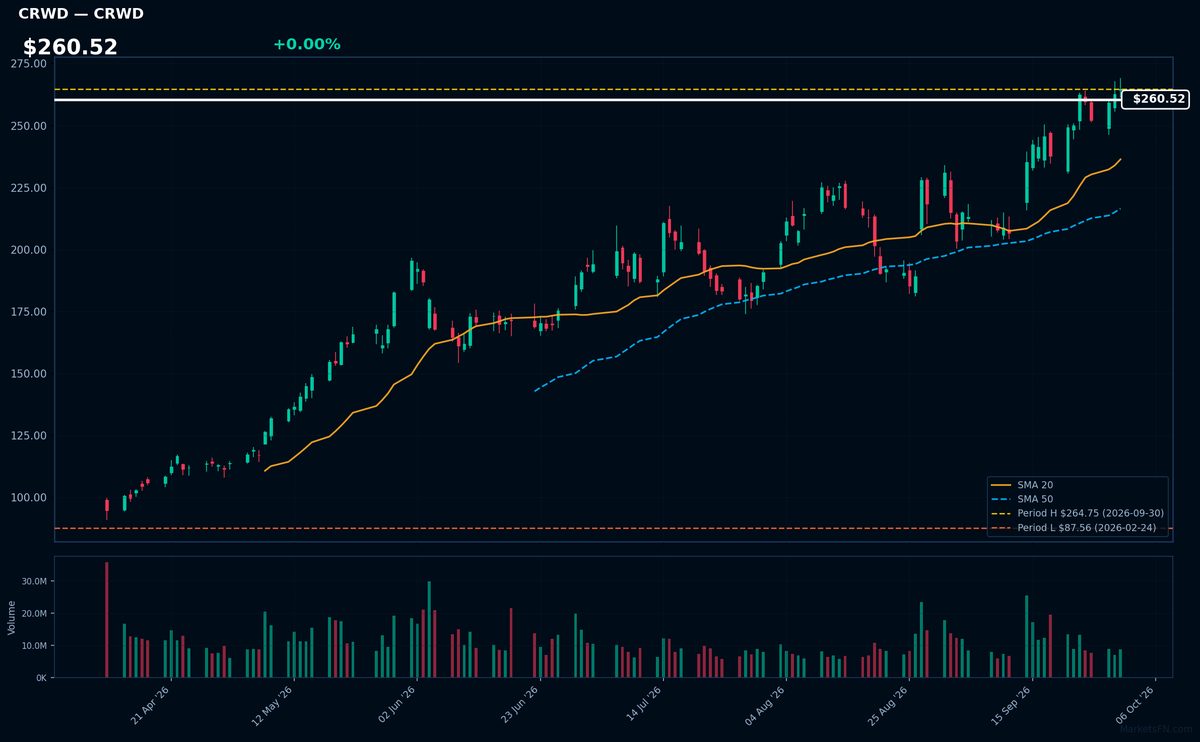
CRWD | Crowdstrike Holdings Inc | Technology | Price Last: $264.75 | % Realized: +133.48% | RSI: 63.6 | % above MA200: +73.3% | Trend: Above MA20, MA50, MA200
Crowdstrike Holdings Inc is a cybersecurity company providing cloud-delivered endpoint and cloud workload protection. Investors should care because its innovative solutions are in high demand, driving growth. Specific details about its products and services are not provided in the data.
Crowdstrike's technical situation indicates strong momentum: RSI(14) is 63.6, and MA alignment is bullish with price > MA20 > MA50 > MA200. The stock is 0.0% below its 2026 YTD high, suggesting a potential breakout.
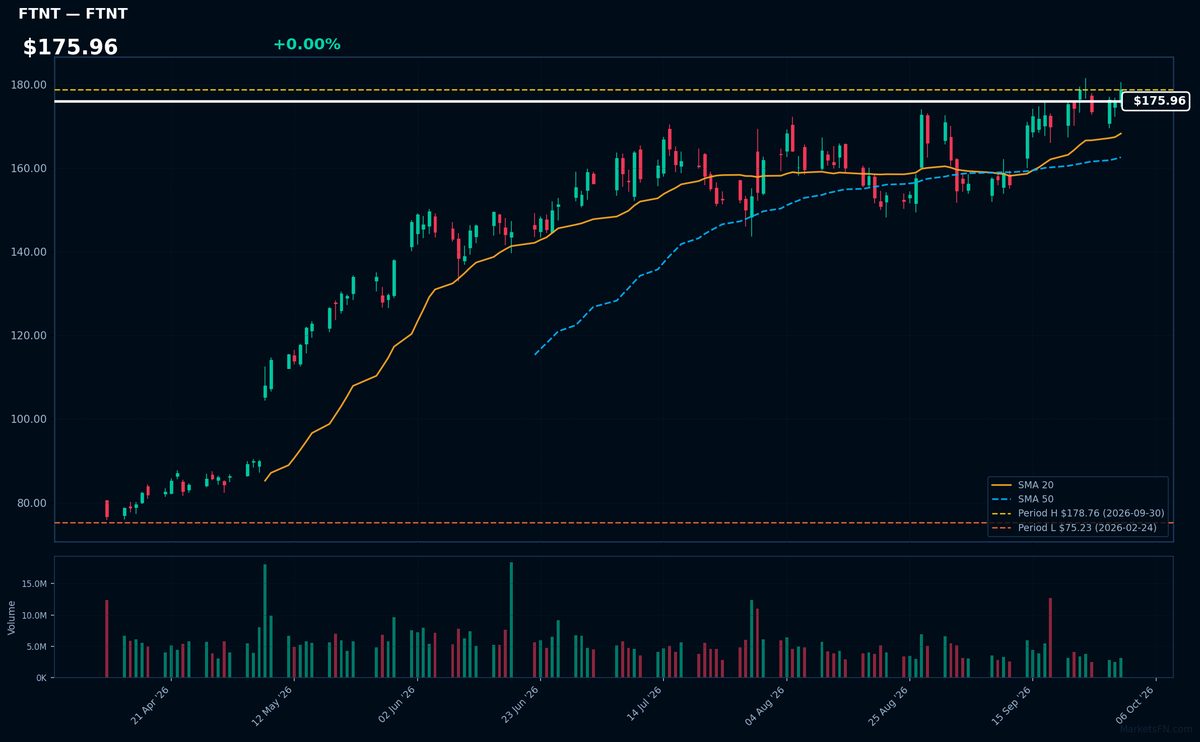
FTNT | Fortinet Inc | Technology | Price Last: $178.76 | % Realized: +129.53% | RSI: 58.2 | % above MA200: +51.4% | Trend: Above MA20, MA50, MA200
Fortinet Inc is a cybersecurity company providing network security solutions, including firewalls and threat intelligence. Investors should care because its products protect against evolving cyber threats, making its growth tied to the expanding cybersecurity market.
Fortinet Inc shows bullish technicals with RSI(14) at 58.2 and a sustained uptrend as price ($175.96) > MA20 > MA50 > MA200. It's near its 2026 YTD high, up 129.5% YTD, indicating strong momentum with no immediate signs of reversal.
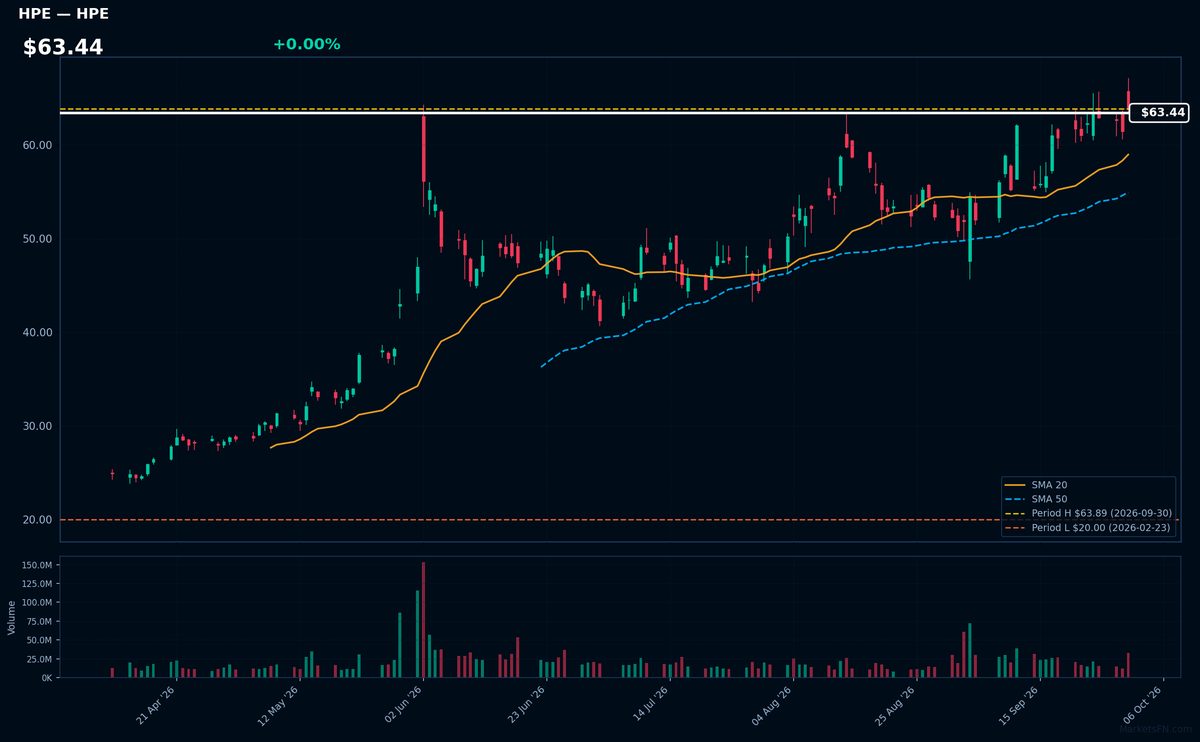
HPE | Hewlett Packard Enterprise Co | Technology | Price Last: $63.89 | % Realized: +164.34% | RSI: 60.6 | % above MA200: +74.2% | Trend: Above MA20, MA50, MA200
Hewlett Packard Enterprise Co is a technology company providing products and services across enterprise infrastructure, cloud, and security. Investors should care about its progress in these areas as it indicates potential for long-term growth.
HPE's RSI(14) is 60.6 with a bullish MA alignment: price ($63.44) > MA20 > MA50 > MA200, indicating sustained uptrend and momentum. The stock is 0.0% below its 2026 YTD high, near a potential breakout.
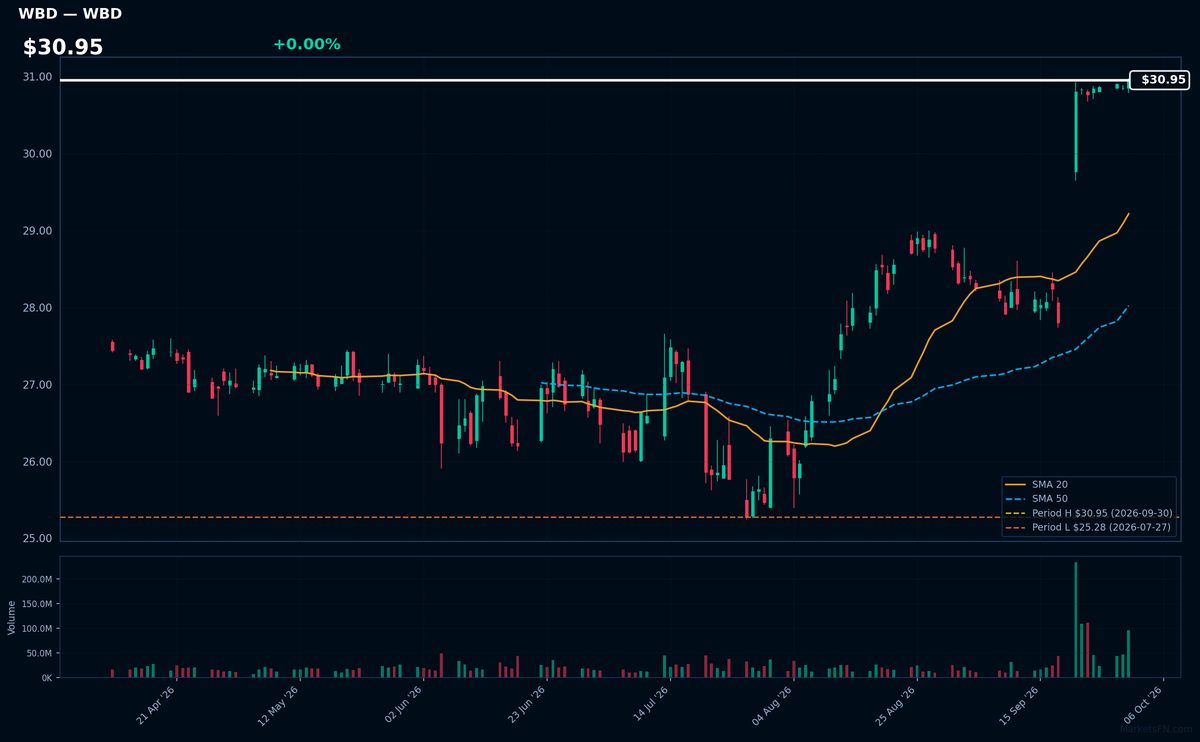
WBD | Warner Bros. Discovery Inc | Communication Services | Price Last: $30.95 | % Realized: +8.56% | RSI: 75.4 | % above MA200: +11.9% | Trend: Above MA20, MA50, MA200
Warner Bros. Discovery Inc is a media conglomerate with a diverse portfolio of entertainment and news assets, including Warner Bros. film studio, HBO, and Discovery networks. Investors care due to its significant influence on global media consumption trends.
WBD's RSI(14) is 75.4, indicating strong momentum. The MA alignment (price > MA20 > MA50 > MA200) suggests a sustained uptrend. With the stock 0.0% below its 2026 YTD high, it nears a potential breakout level, reinforcing the bullish technical outlook.
📉 Nearest to 2026 Low
Sectors represented: Consumer Cyclical (4), Consumer Defensive (1)
| Ticker | Company | Sector | Price Last | % Realized | 2026 YTD Low Date | RSI | % above MA200 | Trend |
|---|---|---|---|---|---|---|---|---|
| HD | Home Depot, Inc | Consumer Cyclical | $284.49 | -17.73% | 2026-09-30 | 25.4 | -16.2% | Below MA20, MA50, MA200 |
| MCD | McDonald's Corp | Consumer Cyclical | $230.94 | -23.85% | 2026-09-30 | 24.0 | -20.4% | Below MA20, MA50, MA200 |
| PEP | PepsiCo Inc | Consumer Defensive | $126.72 | -10.90% | 2026-09-30 | 27.3 | -14.0% | Below MA20, MA50, MA200 |
| LOW | Lowe's Cos., Inc | Consumer Cyclical | $184.29 | -25.36% | 2026-09-30 | 27.7 | -20.5% | Below MA20, MA50, MA200 |
| NKE | Nike, Inc | Consumer Cyclical | $35.40 | -44.06% | 2026-09-30 | 39.3 | -27.6% | Below MA20, MA50, MA200 |
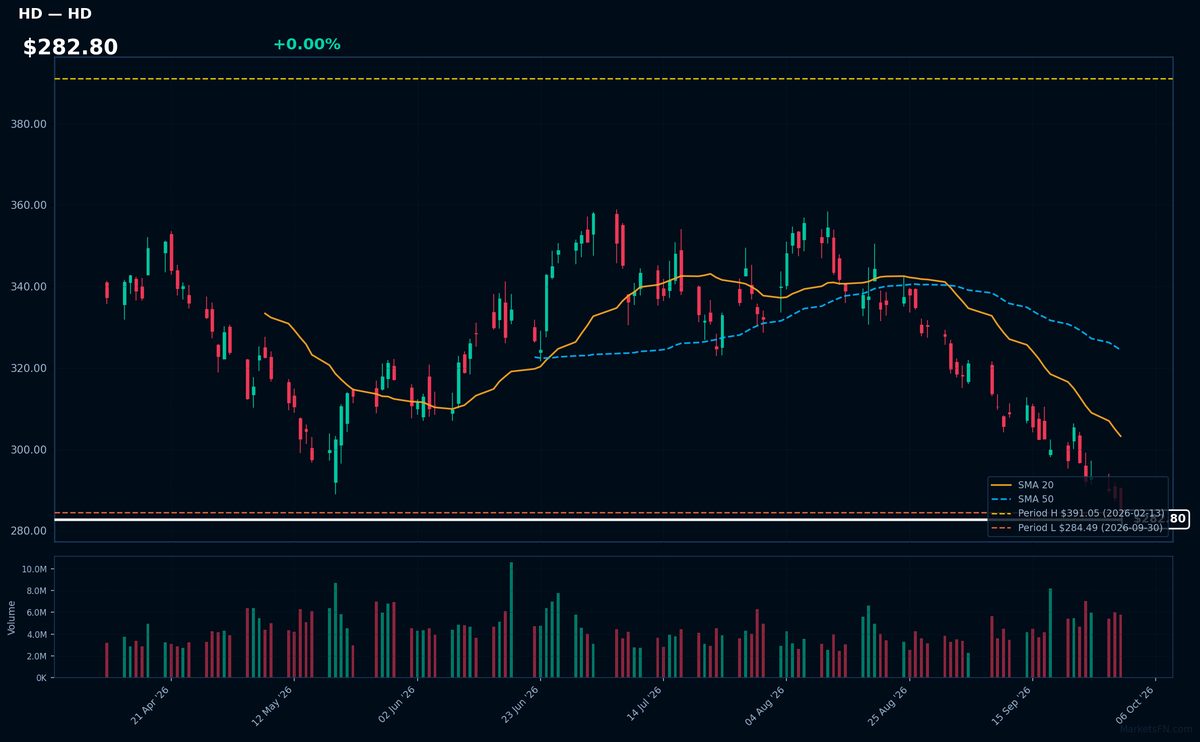
HD | Home Depot, Inc | Consumer Cyclical | Price Last: $284.49 | % Realized: -17.73% | RSI: 25.4 | % above MA200: -16.2% | Trend: Below MA20, MA50, MA200
Home Depot, Inc (HD) operates home improvement retail stores, offering a wide range of products for construction, renovation, and decoration. Investors care about its performance as it reflects housing market trends and consumer spending habits.
HD's technical situation is bearish, with RSI(14) at 25.4 indicating oversold conditions, and a sustained downtrend as price ($282.80) remains below MA20, MA50, and MA200, testing major support at its 2026 YTD low.
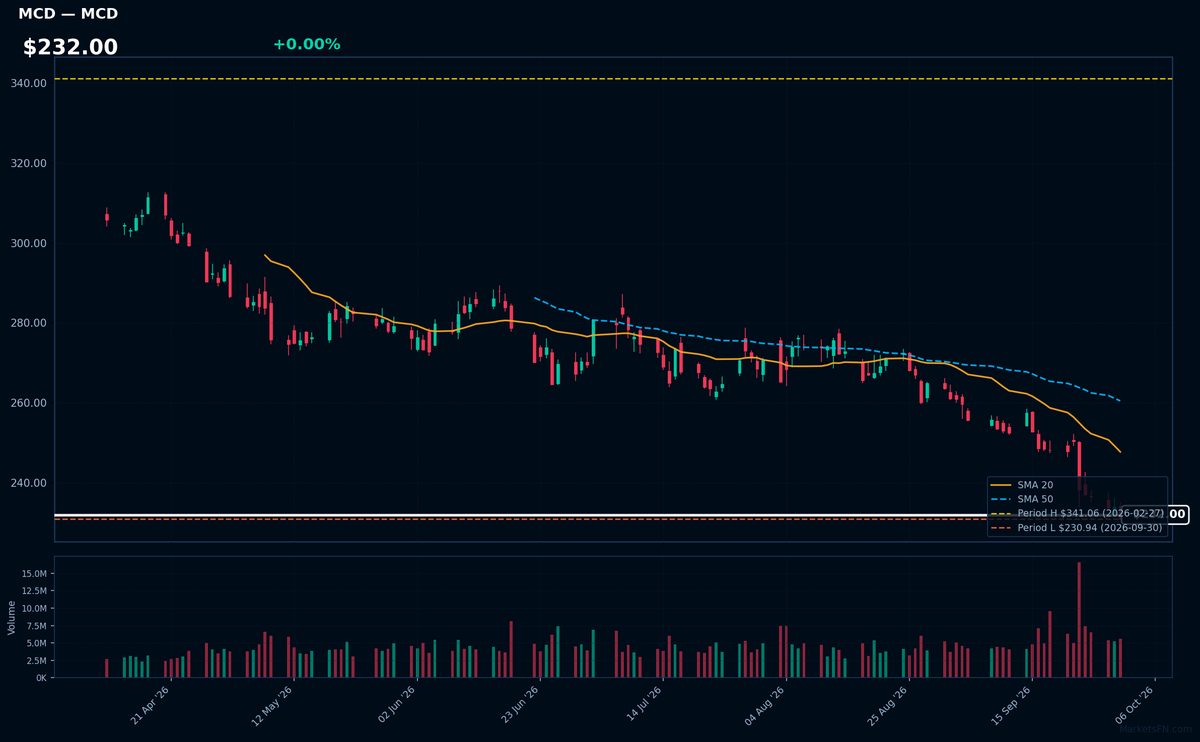
MCD | McDonald's Corp | Consumer Cyclical | Price Last: $230.94 | % Realized: -23.85% | RSI: 24.0 | % above MA200: -20.4% | Trend: Below MA20, MA50, MA200
McDonald's Corp operates a global fast-food chain, serving burgers, fries, and beverages. Investors care about its brand strength, operational efficiency, and market penetration, as these factors influence revenue growth and profitability.
McDonald's Corp is in a sustained downtrend with price ($232.00) below MA20, MA50, and MA200. The RSI(14) is 24.0, near oversold territory. The stock is testing major support at its 2026 YTD low, having fallen 23.8% YTD, indicating a potential warning sign.
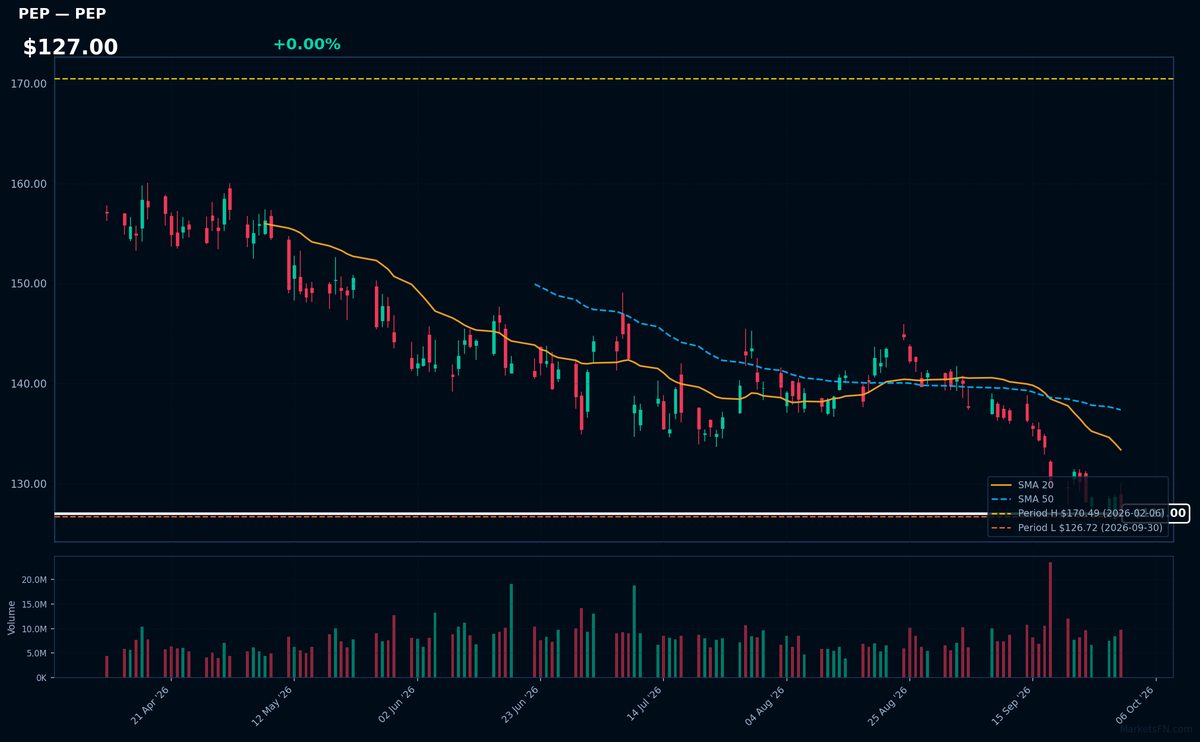
PEP | PepsiCo Inc | Consumer Defensive | Price Last: $126.72 | % Realized: -10.90% | RSI: 27.3 | % above MA200: -14.0% | Trend: Below MA20, MA50, MA200
PepsiCo Inc is a multinational food and beverage corporation that generates revenue through the sale of popular brands such as Pepsi, Lay's, and Gatorade, making it a significant player in the consumer staples sector, with investors caring about its stable dividend and market share.
PepsiCo Inc's current technical situation indicates a sustained downtrend with a bearish MA alignment (price < MA20 < MA50 < MA200), RSI(14) at 27.3, and a 2026 YTD return of -10.9%, warning of potential further decline as it tests major support at its YTD low.
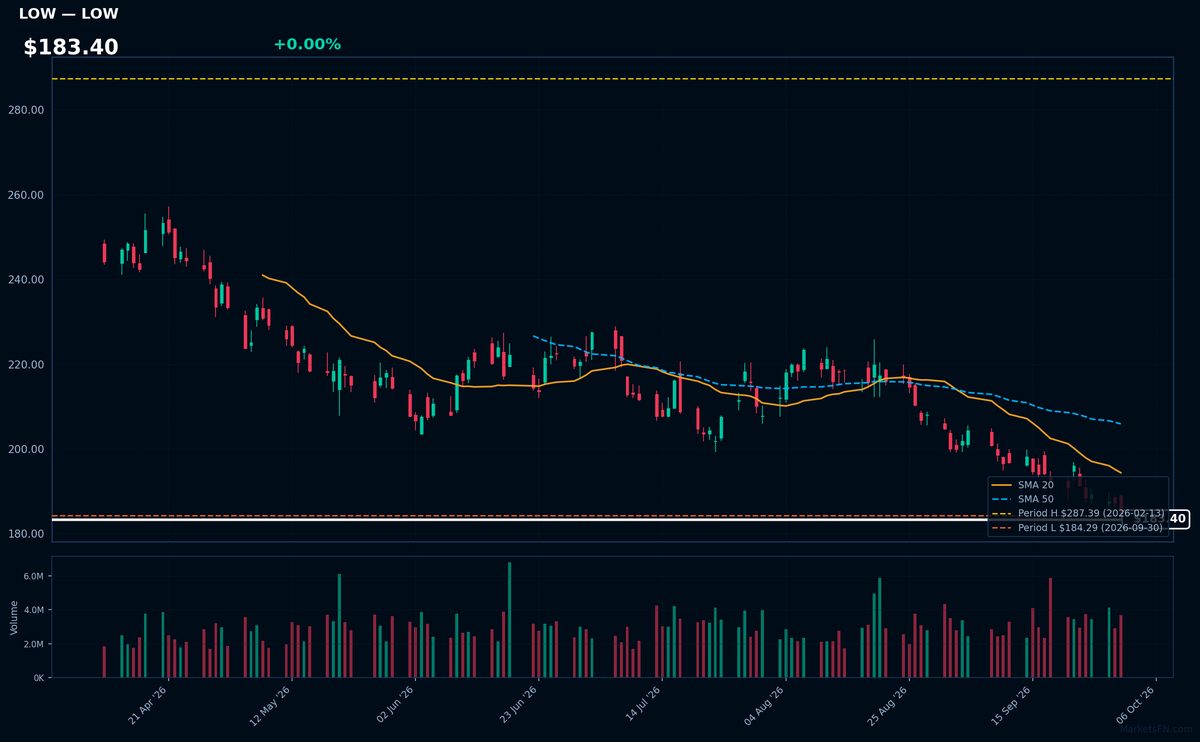
LOW | Lowe's Cos., Inc | Consumer Cyclical | Price Last: $184.29 | % Realized: -25.36% | RSI: 27.7 | % above MA200: -20.5% | Trend: Below MA20, MA50, MA200
Lowe's Cos., Inc operates as a home improvement retailer, selling products such as building materials, tools, and appliances. Investors should care because its performance reflects housing market trends and consumer spending habits.
Lowe's is in a sustained downtrend with price ($183.40) below MA20, MA50, and MA200. RSI(14) is 27.7, indicating oversold conditions. The stock is testing major support at its 2026 YTD low, having fallen -25.4% YTD.
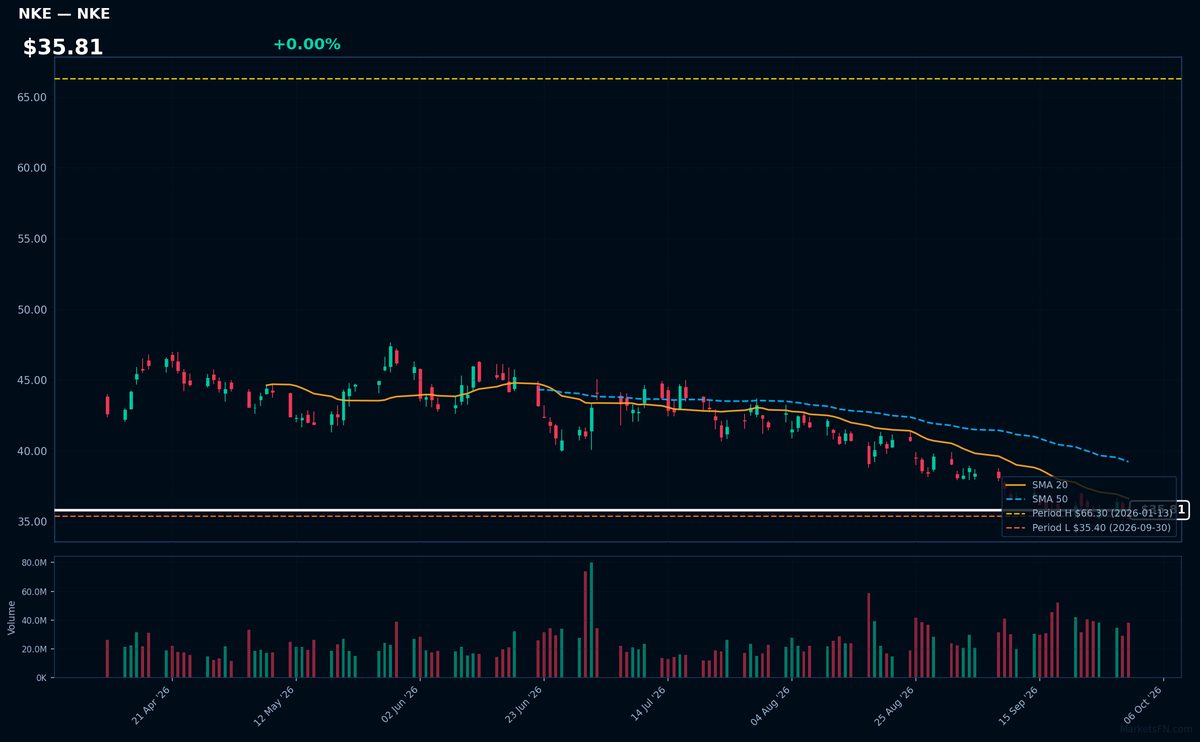
NKE | Nike, Inc | Consumer Cyclical | Price Last: $35.40 | % Realized: -44.06% | RSI: 39.3 | % above MA200: -27.6% | Trend: Below MA20, MA50, MA200
Nike, Inc designs and sells athletic footwear, apparel, and equipment. Investors should care about its brand strength, product innovation, and global distribution network, which drive revenue growth and profitability.
Nike's technicals indicate a sustained downtrend with price ($35.81) below all MAs (MA20, MA50, MA200) and RSI(14) at 39.3, near oversold territory. Testing its 2026 YTD low, a further decline is possible, warning of continued weakness.
Market Commentary
The S&P 500 stocks listed are currently trading near their year-to-date (YTD) extremes for 2026. Specifically, PANW, CRWD, FTNT, HPE, and WBD are at their YTD highs, while HD, MCD, PEP, LOW, and NKE are at their YTD lows. This indicates that these stocks have either reached new highs or lows since the beginning of 2026 and are currently trading at or very near those levels.
The stocks near their YTD highs are primarily from the technology and communications sectors, with a focus on cybersecurity (PANW, CRWD, FTNT) and technology infrastructure (HPE). In contrast, the stocks near their YTD lows are from the consumer staples and discretionary sectors, including retail (HD, LOW) and consumer goods (MCD, PEP, NKE). This divergence may be driven by sector-specific themes and market conditions, such as investor sentiment towards technology and cybersecurity versus consumer spending.
Investors should monitor market trends and sector rotations to understand the drivers behind these extreme price levels. Watching for changes in investor sentiment, earnings reports, and macroeconomic indicators will be crucial in determining whether these stocks continue to trade near their YTD extremes or experience a shift.
Methodology: All 503 S&P 500 constituents screened. Close prices downloaded from 2026-01-01. Period high = highest close since Jan 1 2026; period low = lowest close since Jan 1 2026. Distance = (current price / period extreme − 1) × 100. Technical indicators computed on up to 1 year of daily OHLCV data.
Disclaimer: For informational purposes only. Not investment advice. Past performance is not indicative of future results.