S&P 500 2026 YTD Highs & Lows Radar: Palantir (PLTR), TJXmpanies, (TJX) and more
MarketsFN Team

S&P 500 2026 YTD Highs & Lows Radar: Palantir (PLTR), TJXmpanies, (TJX) and more
Screening all 503 S&P 500 constituents for stocks nearest to their 2026 year-to-date high and their 2026 YTD low. Data as of September 01, 2026. % Realized = total return since Jan 1 2026.
Legend: RSI > 70 = overbought · RSI < 30 = oversold · Green % Realized = positive YTD return · Red = negative.
📈 Nearest to 2026 High
Sectors represented: Energy (3), Technology (2)
| Ticker | Company | Sector | Price Last | % Realized | 2026 YTD High Date | RSI | % above MA200 | Trend |
|---|---|---|---|---|---|---|---|---|
| PLTR | Palantir Technologies Inc | Technology | $186.38 | +11.03% | 2026-08-31 | 65.6 | +23.2% | Above MA20, MA50, MA200 |
| CRWD | Crowdstrike Holdings Inc | Technology | $231.00 | +103.71% | 2026-08-31 | 60.1 | +63.4% | Above MA20, MA50, MA200 |
| MPC | Marathon Petroleum Corp | Energy | $373.32 | +126.06% | 2026-08-31 | 74.1 | +56.3% | Above MA20, MA50, MA200 |
| SLB | Schlumberger Ltd | Energy | $60.10 | +49.50% | 2026-08-31 | 71.4 | +23.3% | Above MA20, MA50, MA200 |
| PSX | Phillips 66 | Energy | $246.58 | +88.85% | 2026-08-31 | 73.0 | +44.5% | Above MA20, MA50, MA200 |
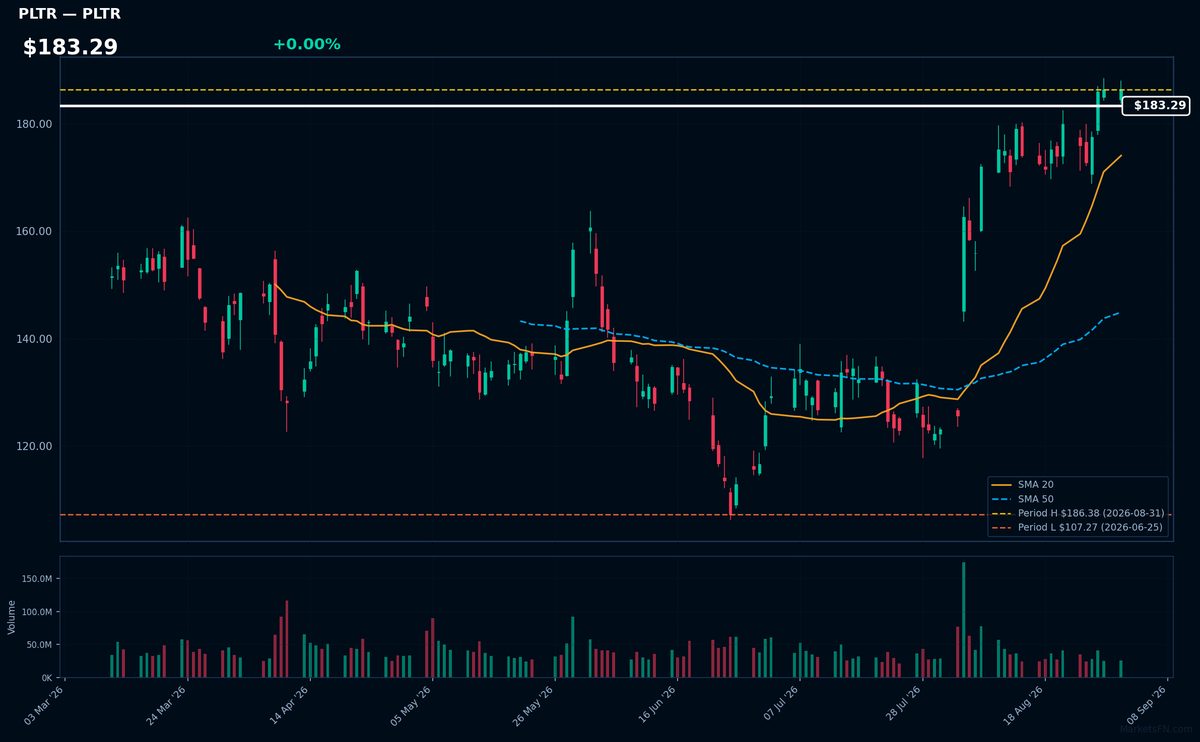
PLTR | Palantir Technologies Inc | Technology | Price Last: $186.38 | % Realized: +11.03% | RSI: 65.6 | % above MA200: +23.2% | Trend: Above MA20, MA50, MA200
Palantir Technologies Inc provides data integration and analytics software to governments and corporations, enabling data-driven decision-making. Investors should care as its platforms help organizations like defense agencies and healthcare providers derive insights from complex data sets.
PLTR's RSI(14) is 65.6, indicating rising momentum. The stock is above MA20, MA50, and MA200, showing a bullish trend. With the stock at its 2026 YTD high, a potential breakout is near, having returned 11.0% YTD.
Related headlines
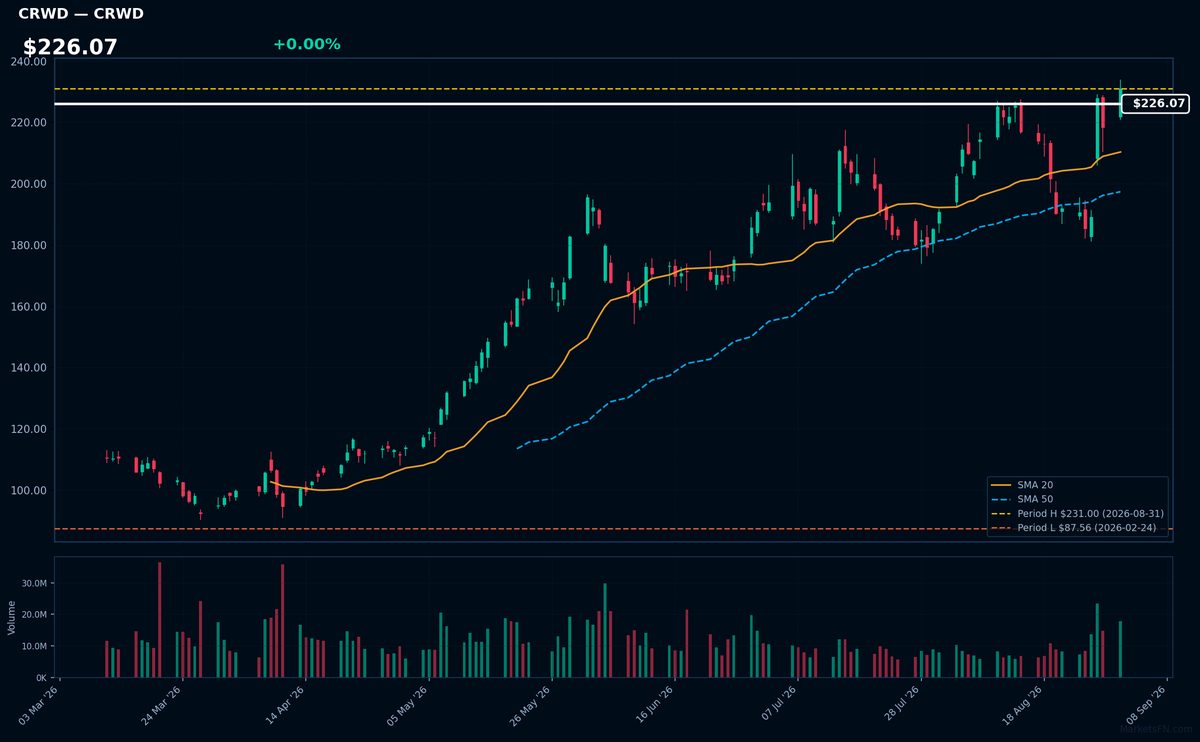
CRWD | Crowdstrike Holdings Inc | Technology | Price Last: $231.00 | % Realized: +103.71% | RSI: 60.1 | % above MA200: +63.4% | Trend: Above MA20, MA50, MA200
Crowdstrike Holdings Inc is a cybersecurity company providing cloud-delivered endpoint and cloud workload protection. Investors should care because its innovative solutions are in high demand, driving growth.
Crowdstrike's technicals indicate sustained uptrend with price > MA20 > MA50 > MA200, RSI(14) at 60.1. Near its 2026 YTD high, it's 0.0% below, suggesting potential breakout momentum.
Related headlines
- PANW Vs CRWD Vs OKTA Vs ZS: AI Threats Are Fueling Cybersecurity Stocks Which Has The Biggest Wall Street Upside?
- CrowdStrike Launches AI Partner Specialization, Defining Cybersecuritys Ecosystem for the Agentic Era
- Cognizant and CrowdStrike Protect Critical Operations Across Converged IT and OT Environments
- CrowdStrike Brings the Falcon Platform to Snowflake, Unifying Security and Data at Enterprise Scale
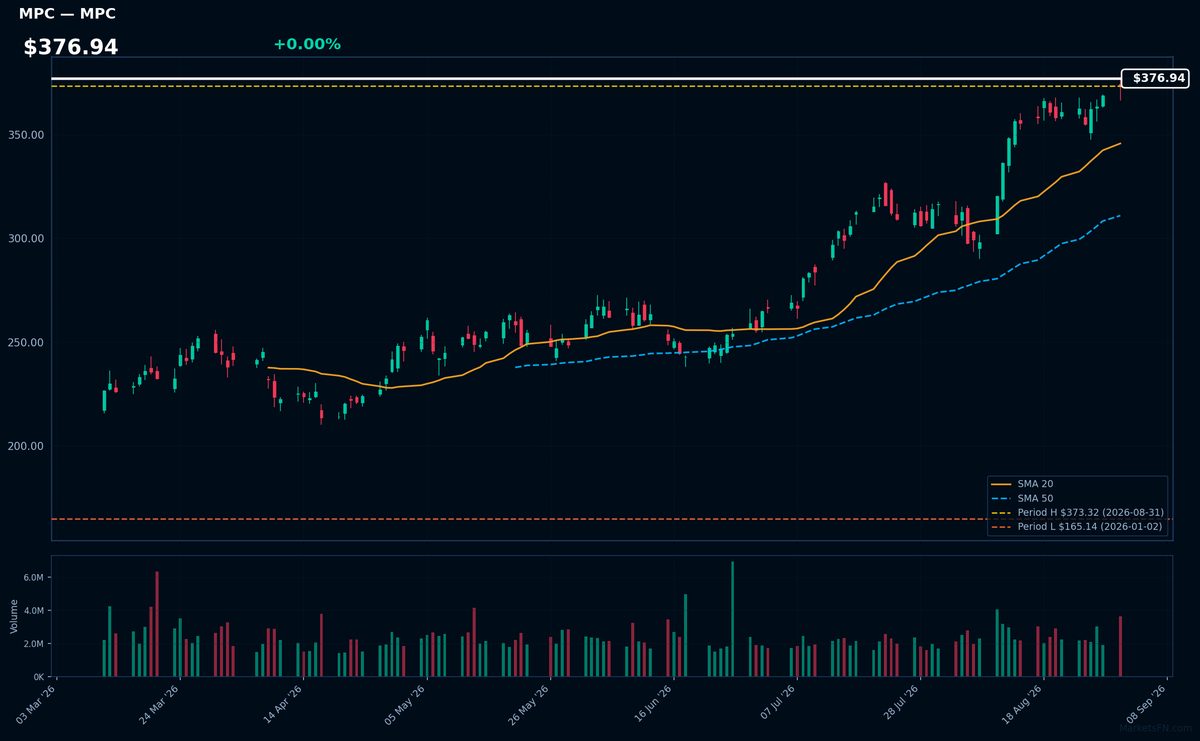
MPC | Marathon Petroleum Corp | Energy | Price Last: $373.32 | % Realized: +126.06% | RSI: 74.1 | % above MA200: +56.3% | Trend: Above MA20, MA50, MA200
Marathon Petroleum Corp is a refining and marketing company operating the largest refining system in the US. Investors should care about its refining capacity, margins, and distribution network, which drive profitability and cash flow.
MPC's RSI(14) is 74.1, nearing overbought territory, with a bullish MA alignment: price ($376.94) > MA20 > MA50 > MA200, indicating sustained uptrend. The stock is 0.0% below its 2026 YTD high, suggesting potential breakout momentum.
Related headlines
- Marathon Petroleum Named a Top 100 Internship Program for the Third Consecutive Year
- PSX, MPC Reportedly Weighed A Giant Merger What Sank The $180B Deal Between Phillips 66 And Marathon Petroleum
- MPC, PSX Stocks Hit All-Time Highs Whats Driving The Rally In These Energy Stocks?
- Marathon Petroleum Corp. stock outperforms competitors on strong trading day
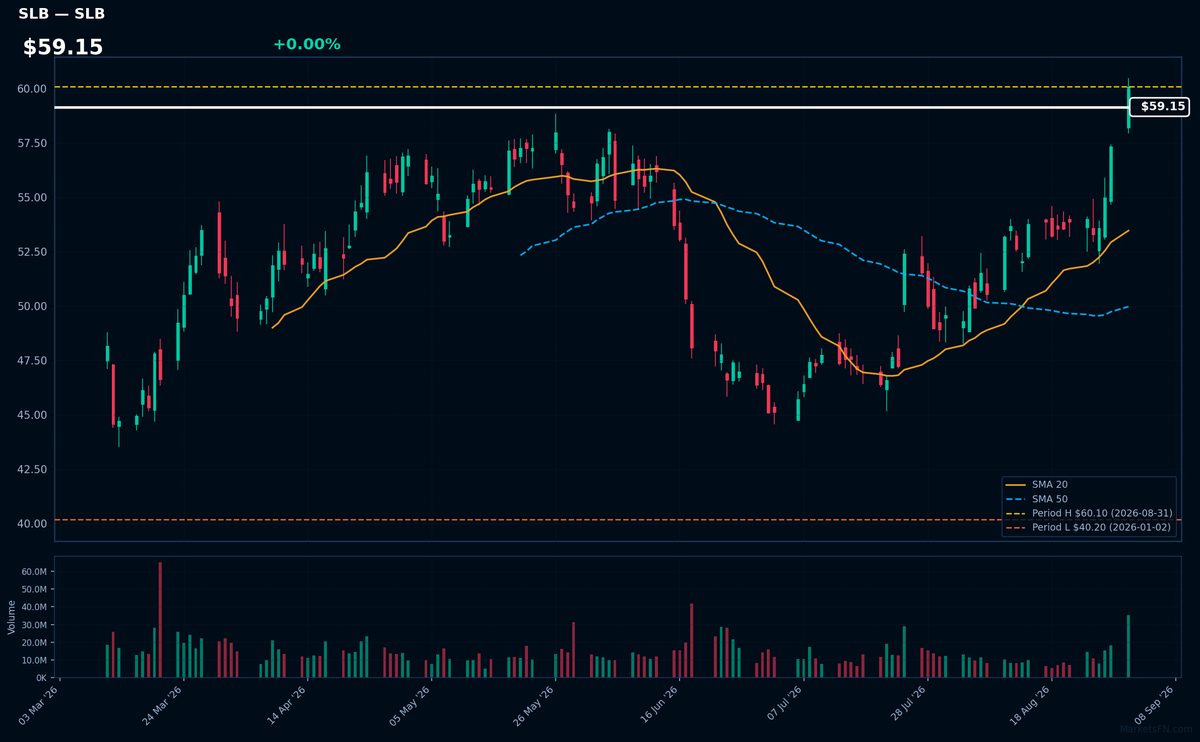
SLB | Schlumberger Ltd | Energy | Price Last: $60.10 | % Realized: +49.50% | RSI: 71.4 | % above MA200: +23.3% | Trend: Above MA20, MA50, MA200
Schlumberger Ltd (SLB) is a leading oilfield services company providing technology solutions for reservoir characterization, drilling, production, and processing. Investors should care because its performance is closely tied to global energy demand and oil prices.
SLB's current technical situation indicates strong momentum: RSI(14) is 71.4, and the stock is in a sustained uptrend with price > MA20 > MA50 > MA200. It's near a potential breakout level, 0.0% below its 2026 YTD high.
Related headlines
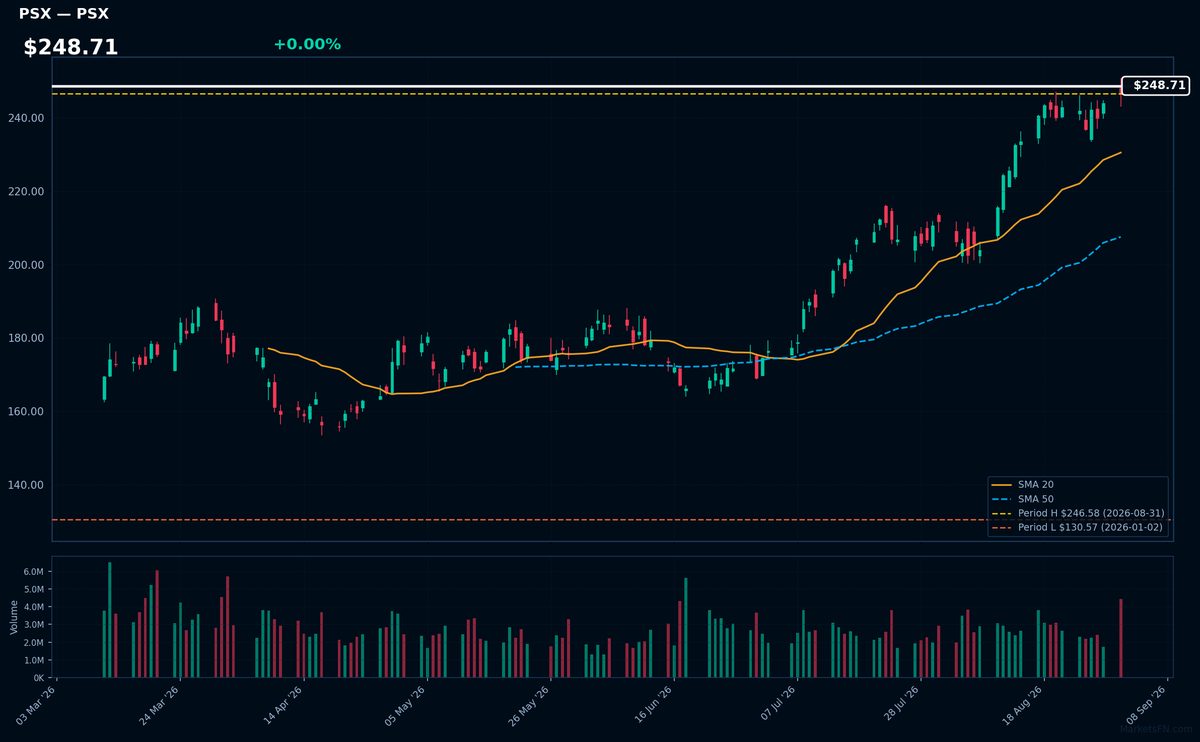
PSX | Phillips 66 | Energy | Price Last: $246.58 | % Realized: +88.85% | RSI: 73.0 | % above MA200: +44.5% | Trend: Above MA20, MA50, MA200
Phillips 66 is a diversified energy company with refining, midstream, and marketing businesses. Investors should care about its refining margins, pipeline throughput, and fuel demand trends, which drive its profitability and cash flow generation.
Phillips 66's RSI is 73.0, indicating strong momentum. The stock is in a sustained uptrend with price > MA20 > MA50 > MA200, and is 0.0% below its 2026 YTD high, suggesting a potential breakout.
Related headlines
- Bill Nygren's Bold Q2 2026 Move: Trimming Phillips 66 for a -1.81% Portfolio Impact
- PSX, MPC Reportedly Weighed A Giant Merger What Sank The $180B Deal Between Phillips 66 And Marathon Petroleum
- Phillips 66 and partners approve $5bn Western Gateway Pipeline
- MPC, PSX Stocks Hit All-Time Highs Whats Driving The Rally In These Energy Stocks?
📉 Nearest to 2026 Low
Sectors represented: Consumer Cyclical (3), Utilities (1), Basic Materials (1)
| Ticker | Company | Sector | Price Last | % Realized | 2026 YTD Low Date | RSI | % above MA200 | Trend |
|---|---|---|---|---|---|---|---|---|
| TJX | TJX Companies, Inc | Consumer Cyclical | $133.91 | -13.20% | 2026-08-31 | 22.1 | -13.6% | Below MA20, MA50, MA200 |
| SRE | Sempra | Utilities | $81.70 | -8.93% | 2026-08-31 | 40.2 | -10.3% | Below MA20, MA50, MA200 |
| CCL | Carnival Corp | Consumer Cyclical | $23.89 | -22.74% | 2026-05-19 | 29.7 | -14.1% | Below MA20, MA50, MA200 |
| LVS | Las Vegas Sands Corp | Consumer Cyclical | $43.81 | -32.82% | 2026-08-31 | 36.8 | -19.7% | Below MA20, MA50, MA200 |
| MLM | Martin Marietta Materials, Inc | Basic Materials | $518.70 | -18.24% | 2026-08-31 | 35.0 | -13.9% | Below MA20, MA50, MA200 |
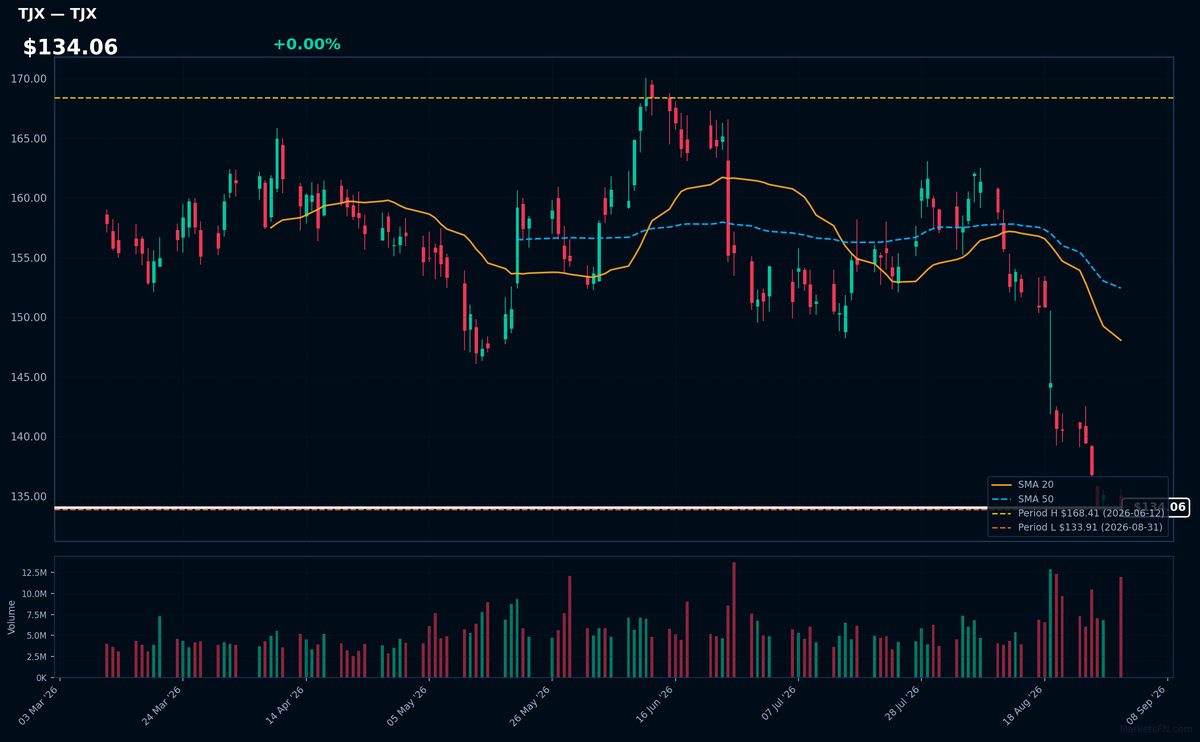
TJX | TJX Companies, Inc | Consumer Cyclical | Price Last: $133.91 | % Realized: -13.20% | RSI: 22.1 | % above MA200: -13.6% | Trend: Below MA20, MA50, MA200
TJX Companies, Inc operates off-price retail stores, offering brand-name merchandise at discounted prices. Investors should care about its ability to maintain margins and sales growth amidst changing consumer behavior and competitive pressures.
TJX is in a sustained downtrend with price ($134.06) below MA20, MA50, and MA200. The RSI(14) is 22.1, near oversold territory, and the stock is testing major support at its 2026 YTD low, indicating a potential warning sign.
Related headlines
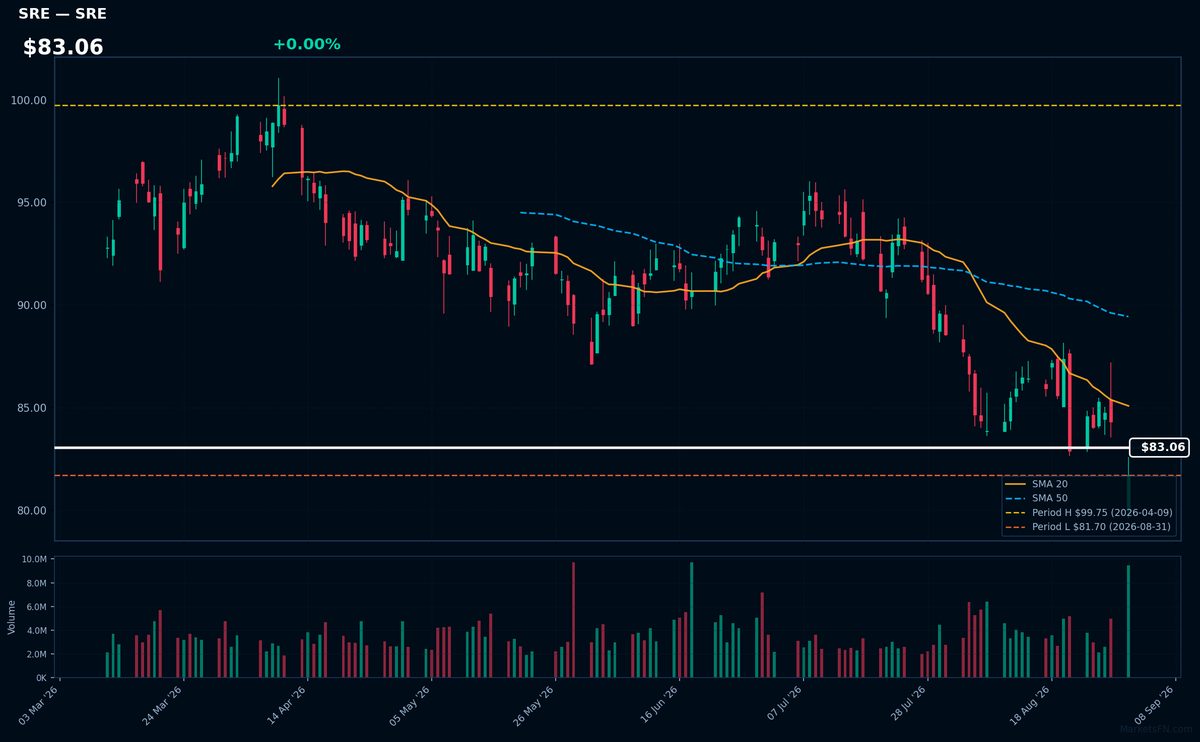
SRE | Sempra | Utilities | Price Last: $81.70 | % Realized: -8.93% | RSI: 40.2 | % above MA200: -10.3% | Trend: Below MA20, MA50, MA200
Sempra is an energy infrastructure company operating in North America, primarily involved in natural gas and electricity transmission and distribution. Investors should care about its regulated utility operations and exposure to growing energy demand.
Sempra is testing major support at its 2026 YTD low with an RSI(14) of 40.2, indicating potential oversold conditions, and a bearish MA alignment (price < $83.06 < MA20 < MA50 < MA200), signaling a sustained downtrend and potential further downside.
Related headlines
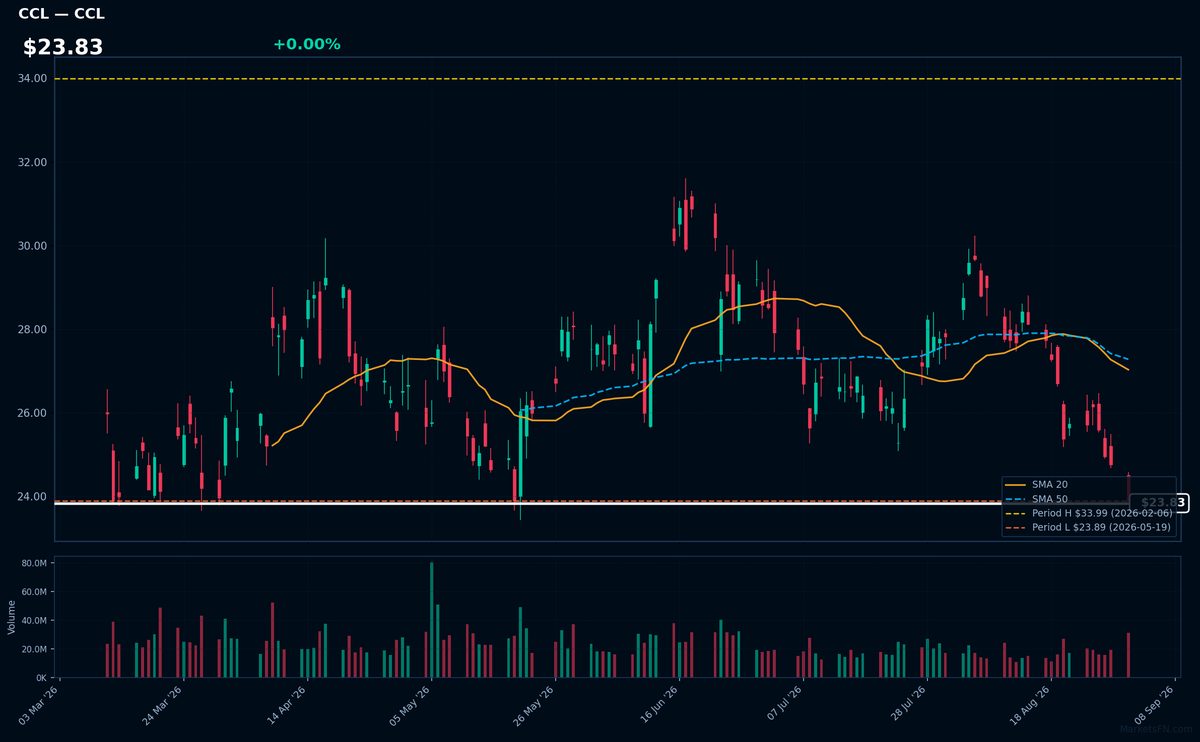
CCL | Carnival Corp | Consumer Cyclical | Price Last: $23.89 | % Realized: -22.74% | RSI: 29.7 | % above MA200: -14.1% | Trend: Below MA20, MA50, MA200
Carnival Corp operates cruise lines, offering vacation experiences globally. Investors should care about its performance as it reflects demand for leisure travel and the company's ability to manage costs and capacity amidst economic fluctuations.
Carnival Corp is testing major support at its 2026 YTD low with an RSI(14) of 29.7, indicating oversold conditions. The bearish MA alignment (price < MA20 < MA50 < MA200) suggests a sustained downtrend, potentially a warning sign. The stock has returned -22.7% YTD.
Related headlines
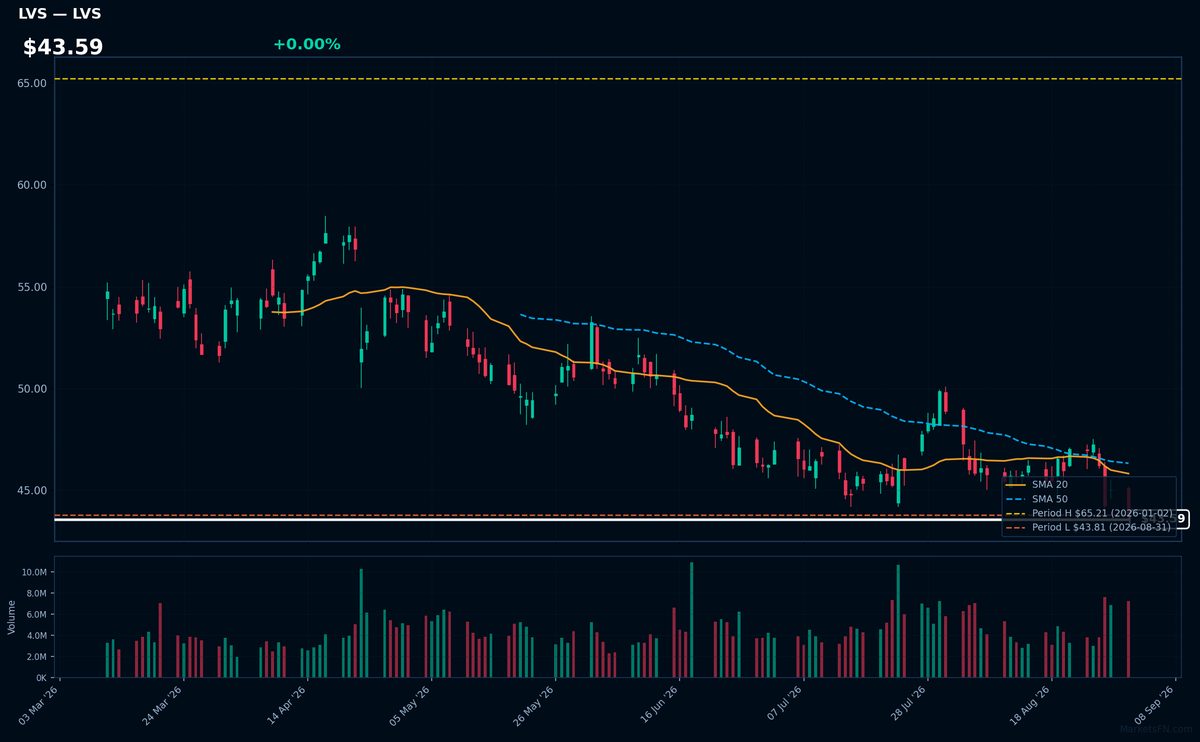
LVS | Las Vegas Sands Corp | Consumer Cyclical | Price Last: $43.81 | % Realized: -32.82% | RSI: 36.8 | % above MA200: -19.7% | Trend: Below MA20, MA50, MA200
Las Vegas Sands Corp operates integrated resorts with casino gaming, entertainment, and hospitality services, generating revenue primarily from gaming and hotel operations. Investors should care about its performance as it reflects demand for luxury leisure and travel experiences.
The stock is in a sustained downtrend with price ($43.59) below MA20, MA50, and MA200. RSI(14) is 36.8, near oversold territory. It's testing major support at its 2026 YTD low, having fallen 32.8% YTD, indicating a potential warning sign for investors.
Related headlines
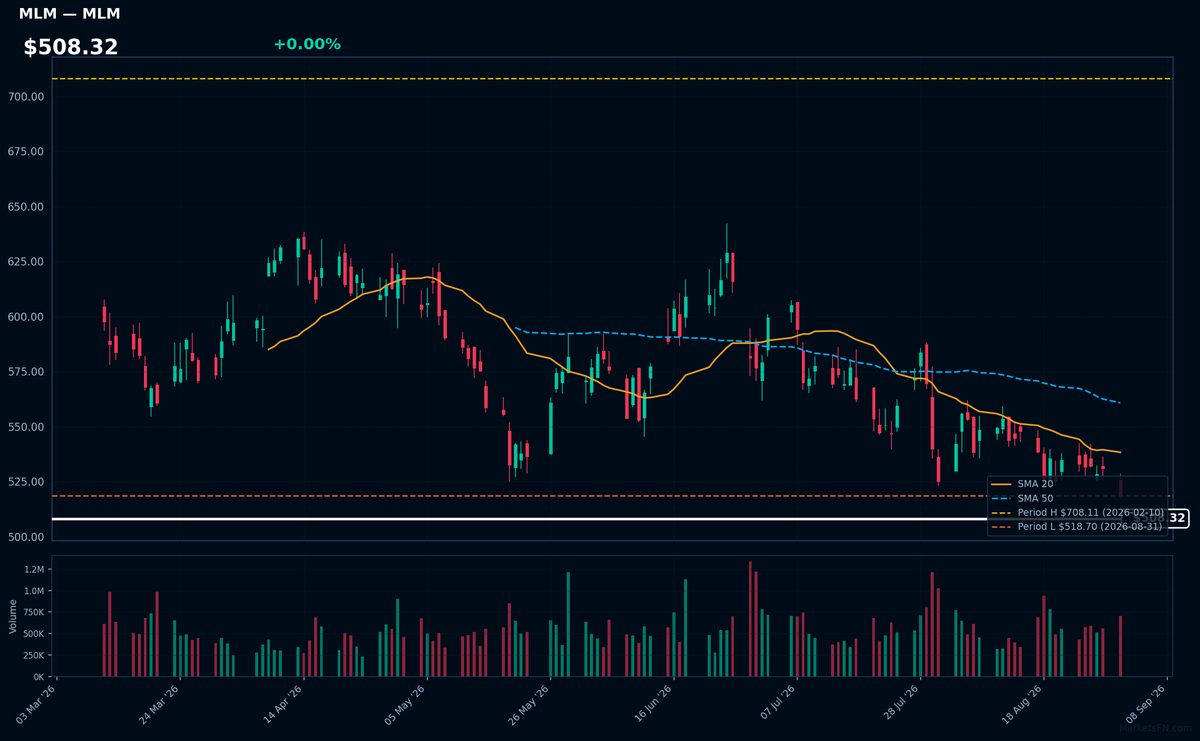
MLM | Martin Marietta Materials, Inc | Basic Materials | Price Last: $518.70 | % Realized: -18.24% | RSI: 35.0 | % above MA200: -13.9% | Trend: Below MA20, MA50, MA200
Martin Marietta Materials, Inc (MLM) is a leading aggregates producer, supplying crushed stone, sand, and gravel for construction projects, including infrastructure and commercial developments. Investors should care due to its exposure to cyclical industries like construction and government spending.
MLM's technical situation is bearish, with an RSI(14) of 35.0 indicating oversold conditions, and a sustained downtrend as price ($508.32) remains below MA20, MA50, and MA200. The stock is testing major support near its 2026 YTD low.
Related headlines
Market Commentary
Several S&P 500 stocks are currently trading near their 2026 year-to-date (YTD) extremes. Stocks like PLTR, CRWD, MPC, SLB, and PSX are at their 2026 YTD highs, while TJX, SRE, CCL, LVS, and MLM are at their 2026 YTD lows. This indicates that these stocks have either reached new highs or lows so far this year and are not far from these extremes.
The stocks at their 2026 YTD highs are from the technology and energy sectors, suggesting strong performance in these areas. Conversely, the stocks at their 2026 YTD lows are from the consumer discretionary and industrials sectors, indicating challenges in these segments. The divergence in performance between these sectors may be driven by various market conditions, including investor sentiment and economic trends.
Investors should monitor the factors driving these stocks to their extremes, such as earnings reports, industry trends, and macroeconomic indicators. Continued observation of these stocks' movements and the broader market conditions will be crucial in understanding whether these extremes will be sustained or if there will be a shift in the current trends.
Methodology: All 503 S&P 500 constituents screened. Close prices downloaded from 2026-01-01. Period high = highest close since Jan 1 2026; period low = lowest close since Jan 1 2026. Distance = (current price / period extreme − 1) × 100. Technical indicators computed on up to 1 year of daily OHLCV data.
Disclaimer: For informational purposes only. Not investment advice. Past performance is not indicative of future results.


