S&P 500 2026 YTD Highs & Lows Radar: Johnson & Johnson (JNJ), TJXmpanies, (TJX) and more
MarketsFN Team

S&P 500 2026 YTD Highs & Lows Radar: Johnson & Johnson (JNJ), TJXmpanies, (TJX) and more
Screening all 503 S&P 500 constituents for stocks nearest to their 2026 year-to-date high and their 2026 YTD low. Data as of September 03, 2026. % Realized = total return since Jan 1 2026.
Legend: RSI > 70 = overbought · RSI < 30 = oversold · Green % Realized = positive YTD return · Red = negative.
📈 Nearest to 2026 High
Sectors represented: Healthcare (2), Energy (2), Industrials (1)
| Ticker | Company | Sector | Price Last | % Realized | 2026 YTD High Date | RSI | % above MA200 | Trend |
|---|---|---|---|---|---|---|---|---|
| JNJ | Johnson & Johnson | Healthcare | $275.21 | +32.73% | 2026-09-02 | 64.7 | +16.9% | Above MA20, MA50, MA200 |
| CVX | Chevron Corp | Energy | $211.78 | +35.84% | 2026-09-02 | 71.7 | +17.1% | Above MA20, MA50, MA200 |
| PFE | Pfizer Inc | Healthcare | $29.02 | +15.25% | 2026-09-02 | 71.5 | +11.0% | Above MA20, MA50, MA200 |
| DE | Deere & Co | Industrials | $698.37 | +49.61% | 2026-09-02 | 70.6 | +23.1% | Above MA20, MA50, MA200 |
| COP | Conoco Phillips | Energy | $137.20 | +41.88% | 2026-09-02 | 69.8 | +21.9% | Above MA20, MA50, MA200 |
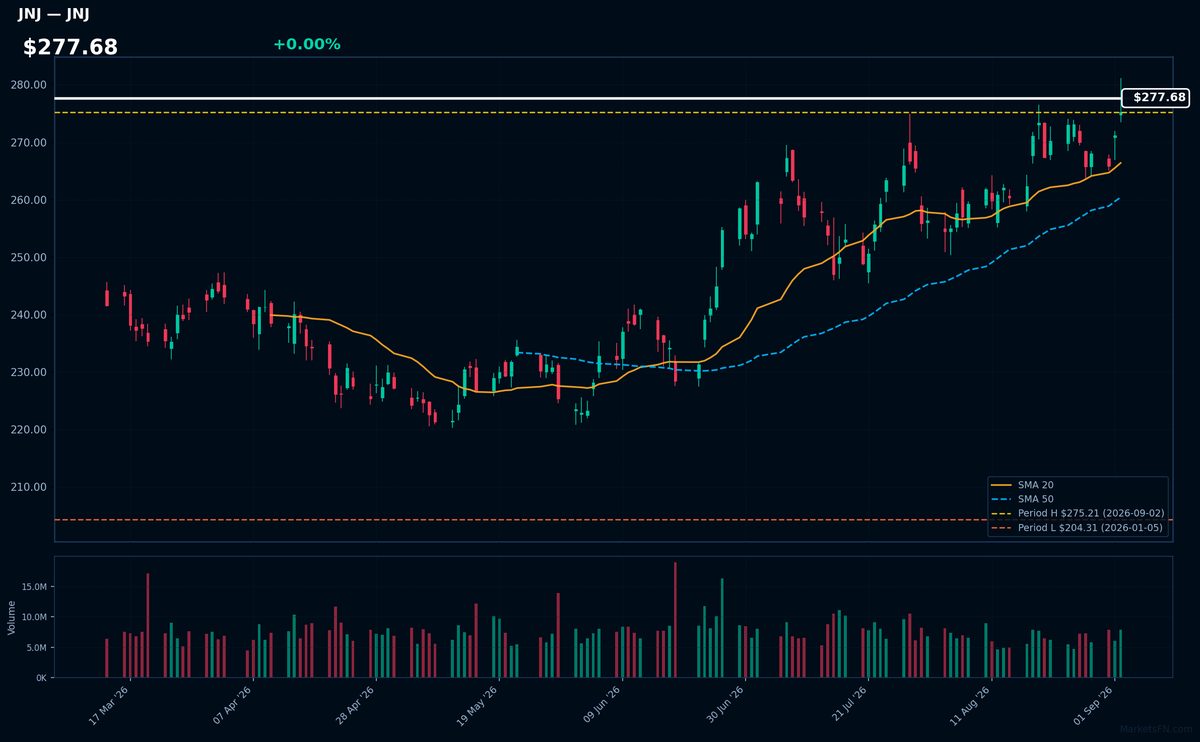
JNJ | Johnson & Johnson | Healthcare | Price Last: $275.21 | % Realized: +32.73% | RSI: 64.7 | % above MA200: +16.9% | Trend: Above MA20, MA50, MA200
Johnson & Johnson is a diversified healthcare company with significant pharmaceutical, medical devices, and consumer products segments. Investors should care about its broad portfolio and innovation pipeline, which drive growth and stability.
JNJ's technicals indicate sustained uptrend with price > MA20 > MA50 > MA200 and RSI(14) at 64.7, suggesting momentum. Near its 2026 YTD high, the stock is poised for a potential breakout, having already returned 32.7% YTD.
Related headlines
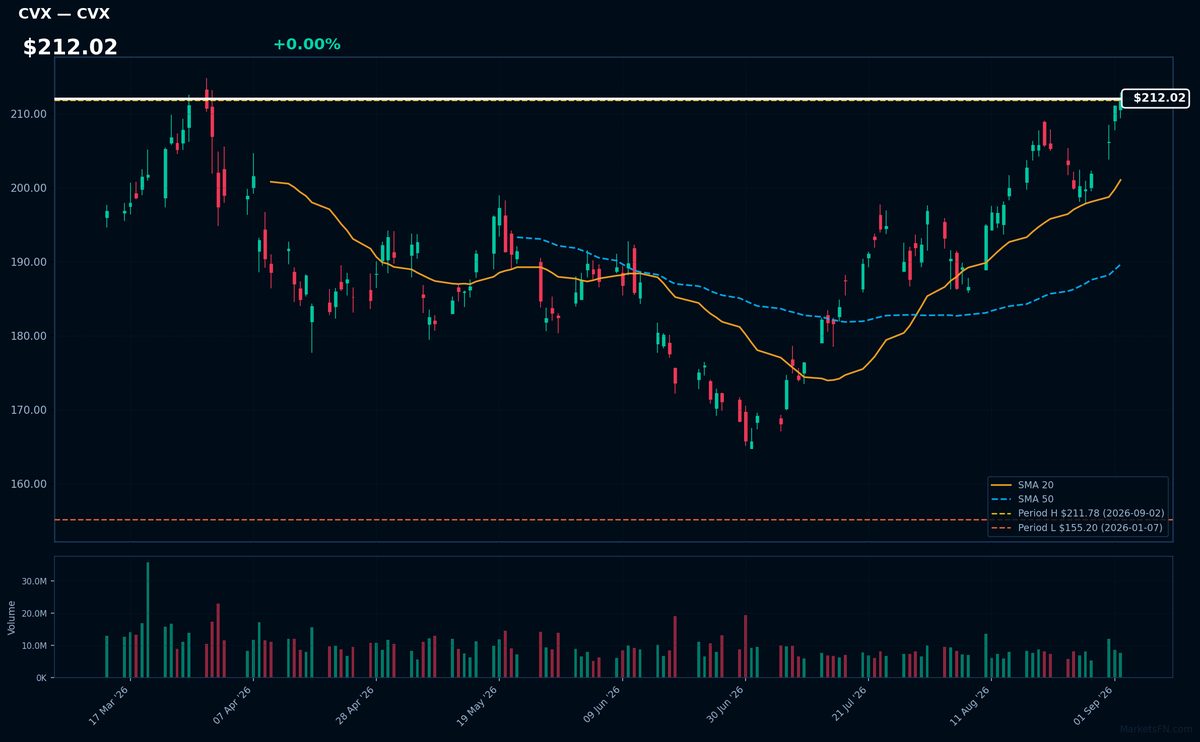
CVX | Chevron Corp | Energy | Price Last: $211.78 | % Realized: +35.84% | RSI: 71.7 | % above MA200: +17.1% | Trend: Above MA20, MA50, MA200
Chevron Corp is a multinational energy corporation that engages in the exploration, production, and refining of oil and natural gas. Investors care about its ability to navigate the energy transition while maintaining profitability.
Chevron Corp's RSI(14) is 71.7, indicating strong momentum. The MA alignment (price > MA20 > MA50 > MA200) suggests a sustained uptrend. With the stock 0.0% below its 2026 YTD high, it may be nearing a breakout.
Related headlines
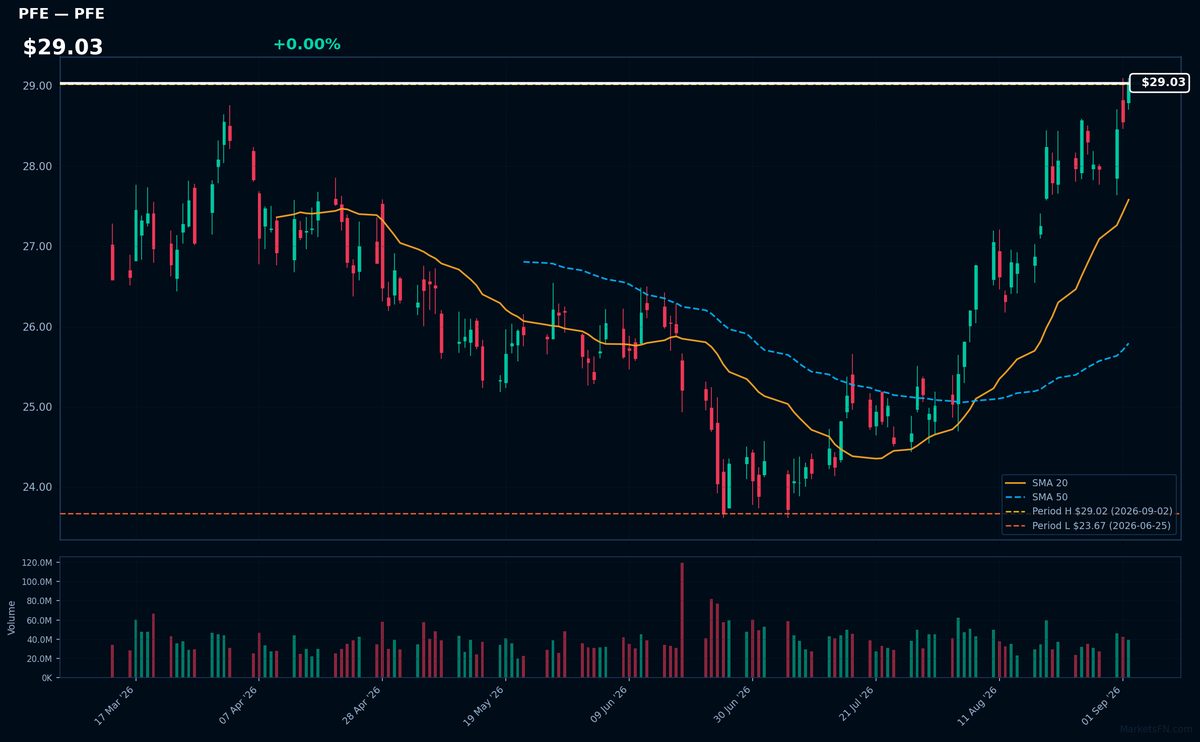
PFE | Pfizer Inc | Healthcare | Price Last: $29.02 | % Realized: +15.25% | RSI: 71.5 | % above MA200: +11.0% | Trend: Above MA20, MA50, MA200
Pfizer Inc is a pharmaceutical company that develops and markets medicines, vaccines, and consumer healthcare products. Investors should care about its pipeline, regulatory approvals, and market competition, which impact its revenue growth and profitability.
Pfizer's RSI(14) is 71.5, indicating overbought conditions. The stock is above MA20, MA50, and MA200, showing a strong uptrend. With a 15.3% 2026 YTD return and 0.0% below its 2026 YTD high, this suggests momentum, but may also be a warning sign of a potential reversal.
Related headlines
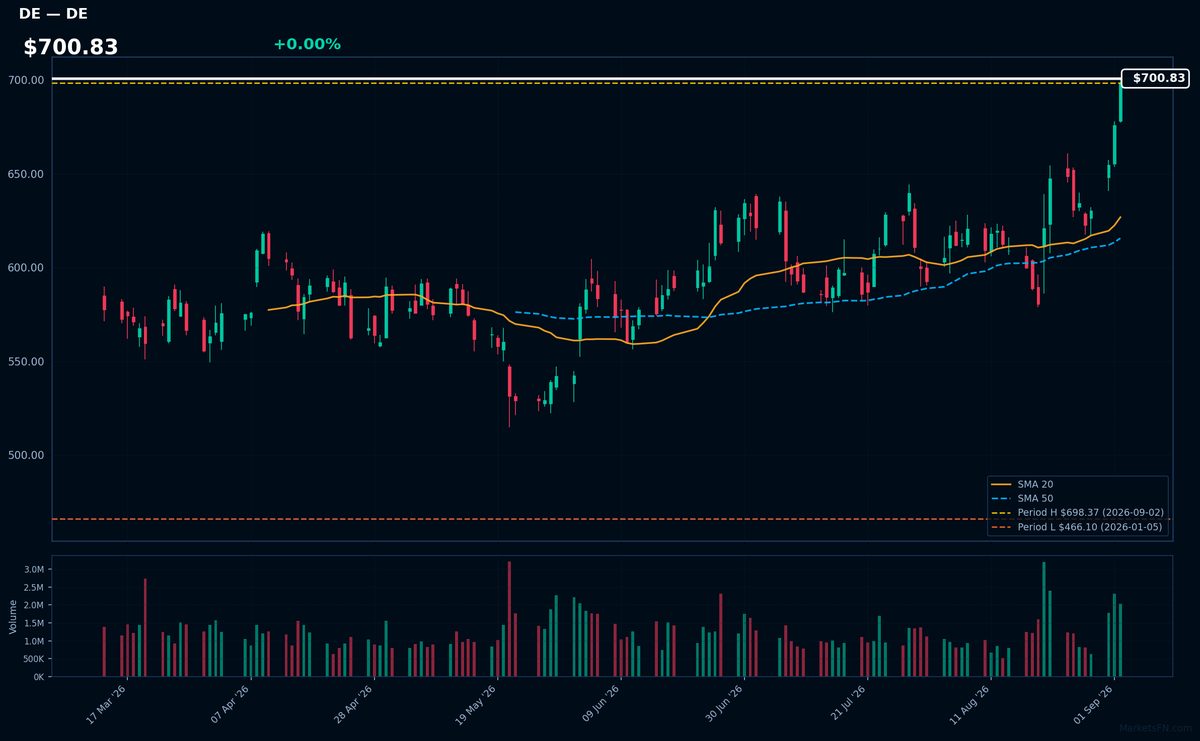
DE | Deere & Co | Industrials | Price Last: $698.37 | % Realized: +49.61% | RSI: 70.6 | % above MA200: +23.1% | Trend: Above MA20, MA50, MA200
Deere & Co manufactures agricultural, construction, and forestry machinery, serving farmers and infrastructure developers worldwide. Investors should care about its performance as it reflects global demand for agricultural equipment and infrastructure spending.
Deere & Co's RSI(14) is 70.6, indicating strong momentum. The MA alignment (price > MA20 > MA50 > MA200) confirms a sustained uptrend. With the stock 0.0% below its 2026 YTD high, it nears a potential breakout level, suggesting continued upward momentum.
Related headlines
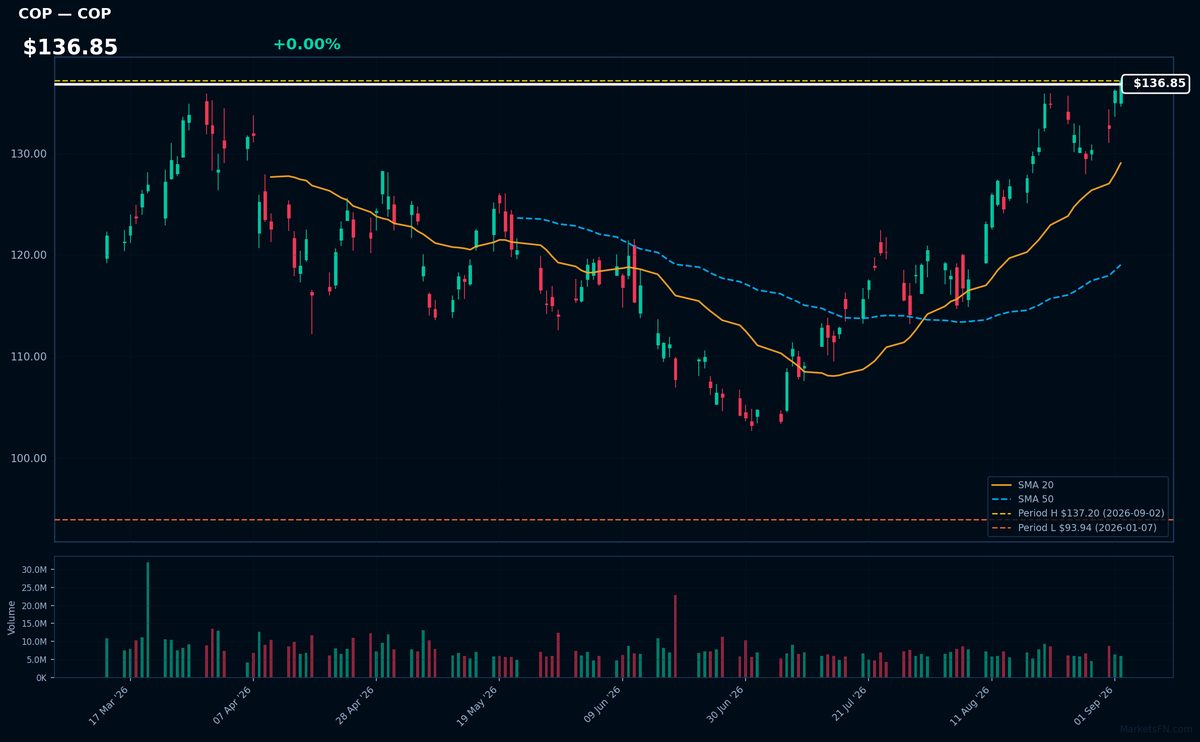
COP | Conoco Phillips | Energy | Price Last: $137.20 | % Realized: +41.88% | RSI: 69.8 | % above MA200: +21.9% | Trend: Above MA20, MA50, MA200
ConocoPhillips is an energy company focused on hydrocarbon exploration and production. Investors should care about its operational efficiency, reserve replacement, and production growth as these factors directly impact its profitability and ability to generate cash.
ConocoPhillips is in a sustained uptrend with price > MA20 > MA50 > MA200. The RSI(14) is 69.8, nearing overbought territory. It's 0.0% below its 2026 YTD high, indicating potential for a breakout, with a 41.9% return over the 2026 YTD period.
Related headlines
📉 Nearest to 2026 Low
Sectors represented: Consumer Cyclical (3), Consumer Defensive (1), Industrials (1)
| Ticker | Company | Sector | Price Last | % Realized | 2026 YTD Low Date | RSI | % above MA200 | Trend |
|---|---|---|---|---|---|---|---|---|
| TJX | TJX Companies, Inc | Consumer Cyclical | $131.31 | -14.89% | 2026-09-02 | 20.4 | -15.2% | Below MA20, MA50, MA200 |
| LOW | Lowe's Cos., Inc | Consumer Cyclical | $199.84 | -19.06% | 2026-09-02 | 38.4 | -15.4% | Below MA20, MA50, MA200 |
| MNST | Monster Beverage Corp | Consumer Defensive | $44.42 | -41.68% | 2026-09-02 | 41.0 | -43.1% | Below MA20, MA50, MA200 |
| LHX | L3Harris Technologies Inc | Industrials | $261.31 | -14.18% | 2026-09-02 | 37.6 | -16.8% | Below MA20, MA50, MA200 |
| ROL | Rollins, Inc | Consumer Cyclical | $35.71 | -39.48% | 2026-09-02 | 41.3 | -31.8% | Below MA20, MA50, MA200 |
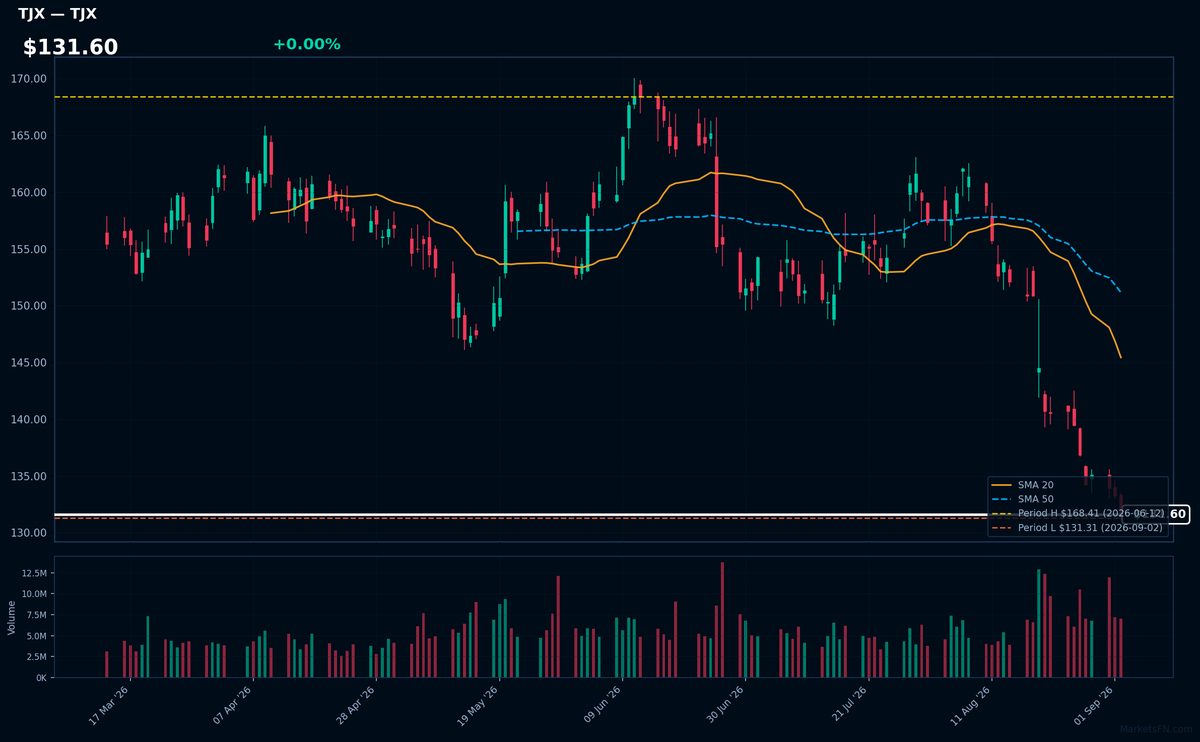
TJX | TJX Companies, Inc | Consumer Cyclical | Price Last: $131.31 | % Realized: -14.89% | RSI: 20.4 | % above MA200: -15.2% | Trend: Below MA20, MA50, MA200
TJX Companies, Inc operates off-price retail stores, offering brand-name merchandise at discounted prices. Investors should care about its ability to maintain margins and sales growth amidst changing consumer behavior and competitive pressures.
TJX is in a sustained downtrend with price ($131.60) below MA20, MA50, and MA200. The RSI(14) is 20.4, near oversold territory, and the stock is testing major support at its 2026 YTD low, indicating a potential warning sign.
Related headlines
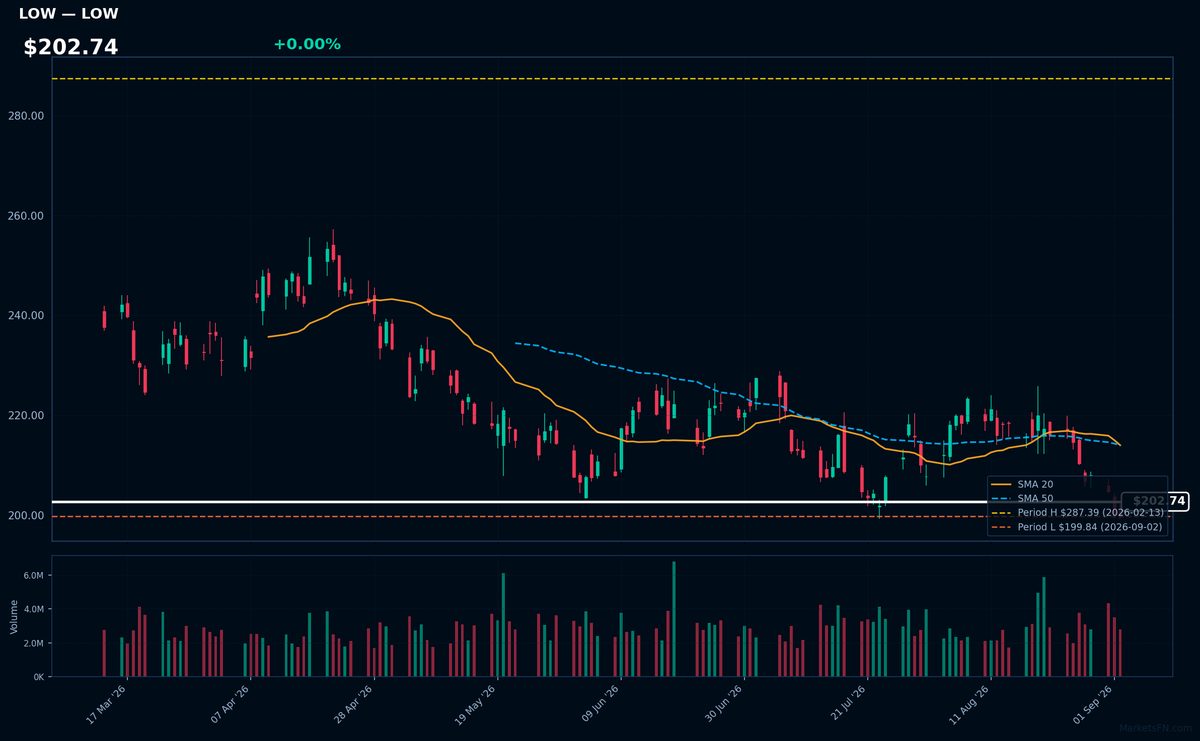
LOW | Lowe's Cos., Inc | Consumer Cyclical | Price Last: $199.84 | % Realized: -19.06% | RSI: 38.4 | % above MA200: -15.4% | Trend: Below MA20, MA50, MA200
Lowe's Cos., Inc operates as a home improvement retailer, selling products such as building materials, tools, and appliances. Investors should care because its performance reflects housing market trends and consumer spending habits.
Lowe's is in a sustained downtrend with price ($202.74) below MA20, MA50, and MA200. RSI(14) is 38.4, near oversold territory. The stock is testing major support at its 2026 YTD low, having fallen -19.1% YTD, indicating a warning sign.
Related headlines
- LOWE'S KICKS OFF YEAR TWO OF 'EARN YOUR SUNDAY' WITH EXPANDED ROSTER OF NFL SUPERSTARS AND A MISSION TO HELP FANS GET GAMEDAY READY
- Lowe's opening 3 more stores in these states in 2026. See where
- Lowe's launches major effort to help close America's skilled trades gap
- LOWE'S COMPANIES, INC. DECLARES CASH DIVIDEND
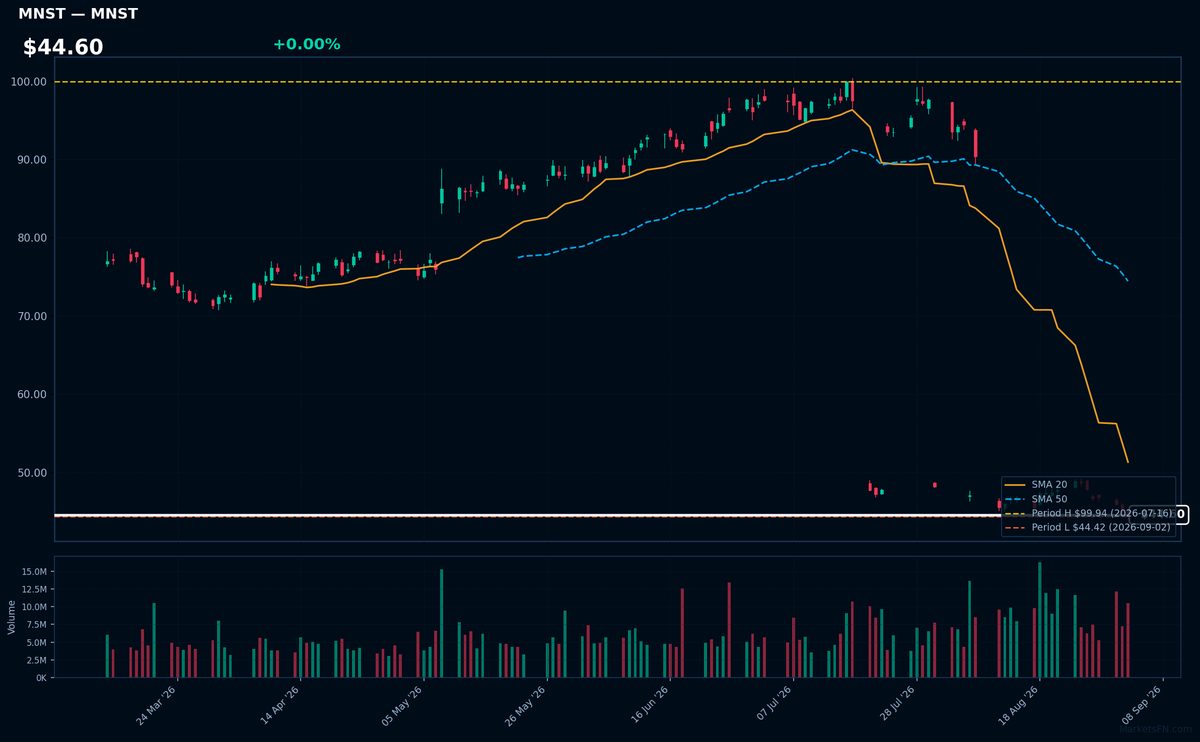
MNST | Monster Beverage Corp | Consumer Defensive | Price Last: $44.42 | % Realized: -41.68% | RSI: 41.0 | % above MA200: -43.1% | Trend: Below MA20, MA50, MA200
Monster Beverage Corp is a leading energy drink manufacturer with popular brands like Monster Energy. Investors should care about its performance as it dominates the energy drink market, and its stock movements can indicate consumer trends and competitive positioning in the beverage industry.
The stock is in a sustained downtrend with price ($44.60) below MA20, MA50, and MA200. RSI(14) is 41.0, nearing oversold territory. Testing its 2026 YTD low (0.0% above), it's a warning sign with a -41.7% 2026 YTD return, indicating significant bearish momentum.
Related headlines
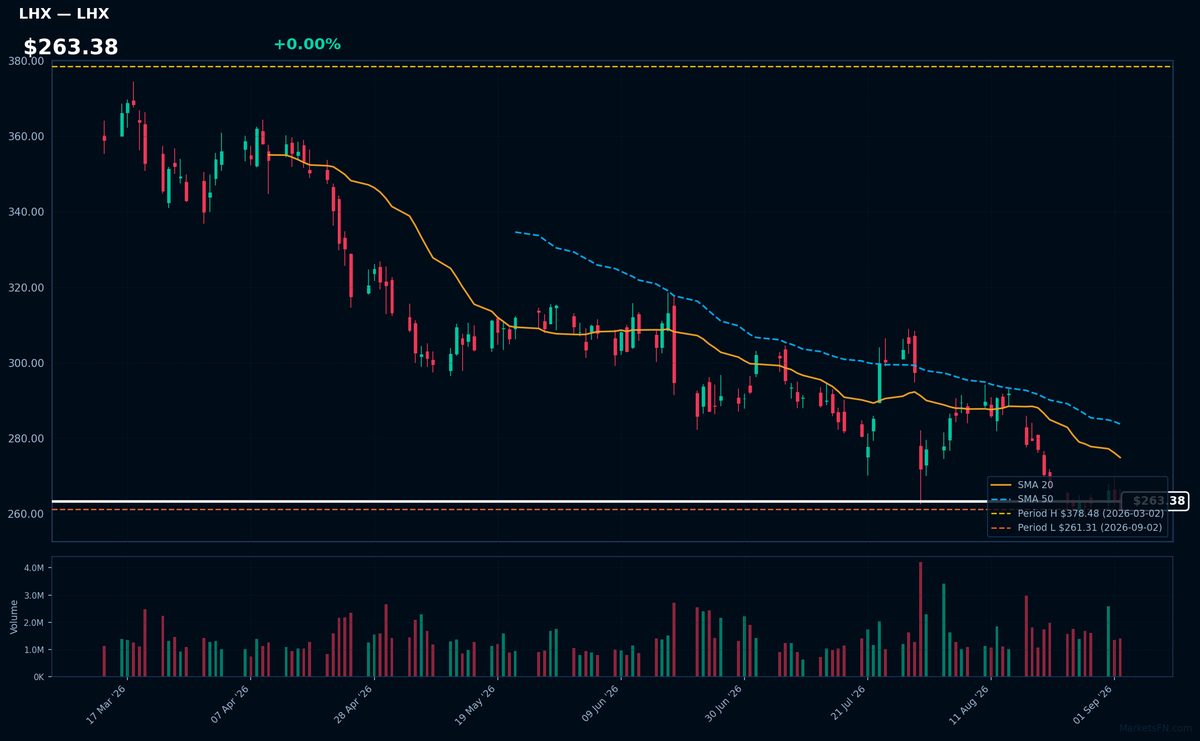
LHX | L3Harris Technologies Inc | Industrials | Price Last: $261.31 | % Realized: -14.18% | RSI: 37.6 | % above MA200: -16.8% | Trend: Below MA20, MA50, MA200
L3Harris Technologies Inc is a defense technology company providing advanced defense and commercial technologies. Investors should care because its performance is tied to government defense spending and technological innovation, impacting its revenue and profitability.
L3Harris Technologies Inc is in a sustained downtrend with price ($263.38) below MA20, MA50, and MA200. The RSI(14) is 37.6, near oversold territory. The stock is testing major support at its 2026 YTD low, having returned -14.2% YTD, indicating a potential warning sign.
Related headlines
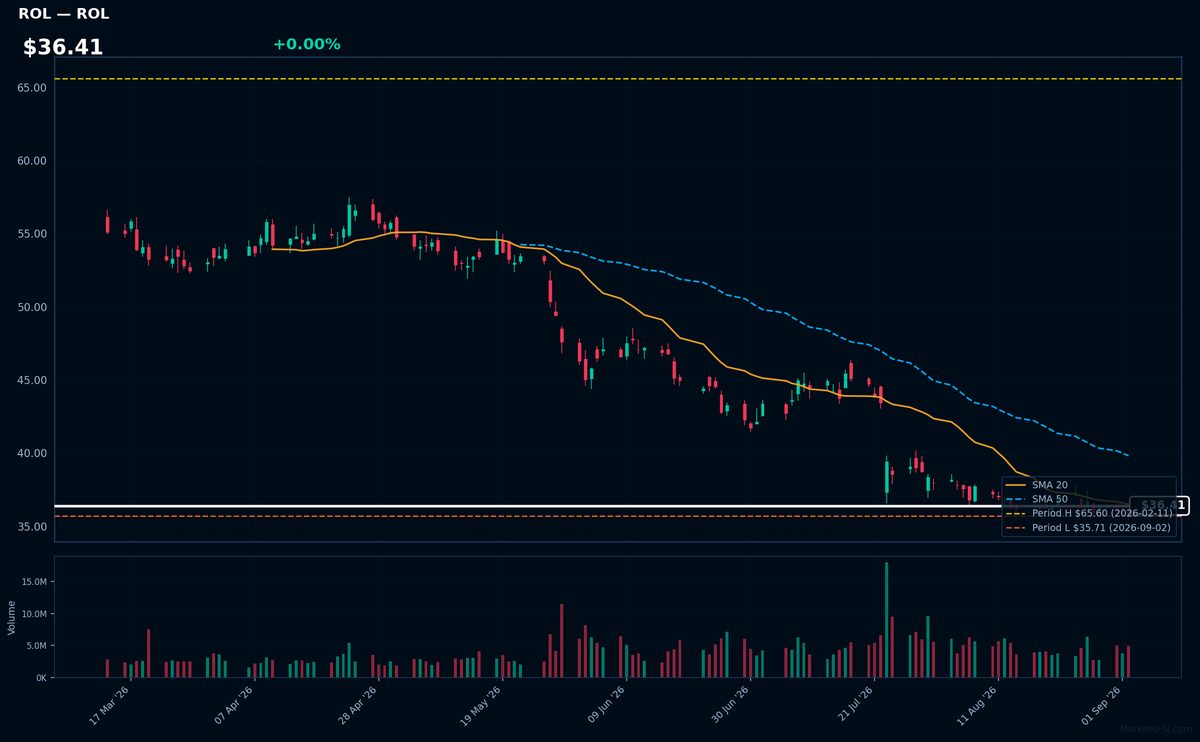
ROL | Rollins, Inc | Consumer Cyclical | Price Last: $35.71 | % Realized: -39.48% | RSI: 41.3 | % above MA200: -31.8% | Trend: Below MA20, MA50, MA200
Rollins, Inc provides pest control services through its Orkin, Terminix, and other brands, generating revenue through recurring service contracts and one-time treatments. Investors should care about its steady cash flows and market share in a relatively stable industry.
Rollins, Inc is testing major support at its 2026 YTD low with an RSI(14) of 41.3, indicating bearish momentum. The sustained downtrend is confirmed by bearish MA alignment: price ($36.41) < MA20 < MA50 < MA200, with a -39.5% 2026 YTD return.
Related headlines
Market Commentary
The S&P 500 stocks listed are currently trading near their 2026 year-to-date (YTD) extremes. For stocks near their 2026 highs, such as JNJ, CVX, PFE, DE, and COP, this indicates they are at or very close to their highest price so far this year. Conversely, TJX, LOW, MNST, LHX, and ROL are near their 2026 YTD lows, having reached their lowest prices this year.
The stocks near their 2026 highs are primarily from the healthcare and energy sectors, suggesting stability or strength in these areas. In contrast, the stocks near their 2026 lows span retail, consumer goods, and defense, potentially indicating challenges or volatility in these sectors. Market conditions and sector themes driving these extremes may be related to investor sentiment, earnings reports, and broader economic trends.
Investors should monitor upcoming earnings reports, sector-specific news, and macroeconomic indicators to understand the sustainability of these trends. Watching how these stocks move relative to their 2026 extremes can provide insights into market direction and sector rotation, helping inform investment decisions.
Methodology: All 503 S&P 500 constituents screened. Close prices downloaded from 2026-01-01. Period high = highest close since Jan 1 2026; period low = lowest close since Jan 1 2026. Distance = (current price / period extreme − 1) × 100. Technical indicators computed on up to 1 year of daily OHLCV data.
Disclaimer: For informational purposes only. Not investment advice. Past performance is not indicative of future results.


