S&P 500 2026 YTD Highs & Lows Radar: Deere & (DE), TJXmpanies, (TJX) and more
MarketsFN Team

S&P 500 2026 YTD Highs & Lows Radar: Deere & (DE), TJXmpanies, (TJX) and more
Screening all 503 S&P 500 constituents for stocks nearest to their 2026 year-to-date high and their 2026 YTD low. Data as of September 02, 2026. % Realized = total return since Jan 1 2026.
Legend: RSI > 70 = overbought · RSI < 30 = oversold · Green % Realized = positive YTD return · Red = negative.
📈 Nearest to 2026 High
Sectors represented: Energy (3), Industrials (1), Technology (1)
| Ticker | Company | Sector | Price Last | % Realized | 2026 YTD High Date | RSI | % above MA200 | Trend |
|---|---|---|---|---|---|---|---|---|
| DE | Deere & Co | Industrials | $676.08 | +44.83% | 2026-09-01 | 67.1 | +19.5% | Above MA20, MA50, MA200 |
| COP | Conoco Phillips | Energy | $136.19 | +40.84% | 2026-09-01 | 67.7 | +21.3% | Above MA20, MA50, MA200 |
| MSI | Motorola Solutions Inc | Technology | $491.24 | +28.93% | 2026-09-01 | 67.6 | +16.5% | Above MA20, MA50, MA200 |
| MPC | Marathon Petroleum Corp | Energy | $383.00 | +131.92% | 2026-09-01 | 77.0 | +59.7% | Above MA20, MA50, MA200 |
| PSX | Phillips 66 | Energy | $252.02 | +93.02% | 2026-09-01 | 75.4 | +47.2% | Above MA20, MA50, MA200 |
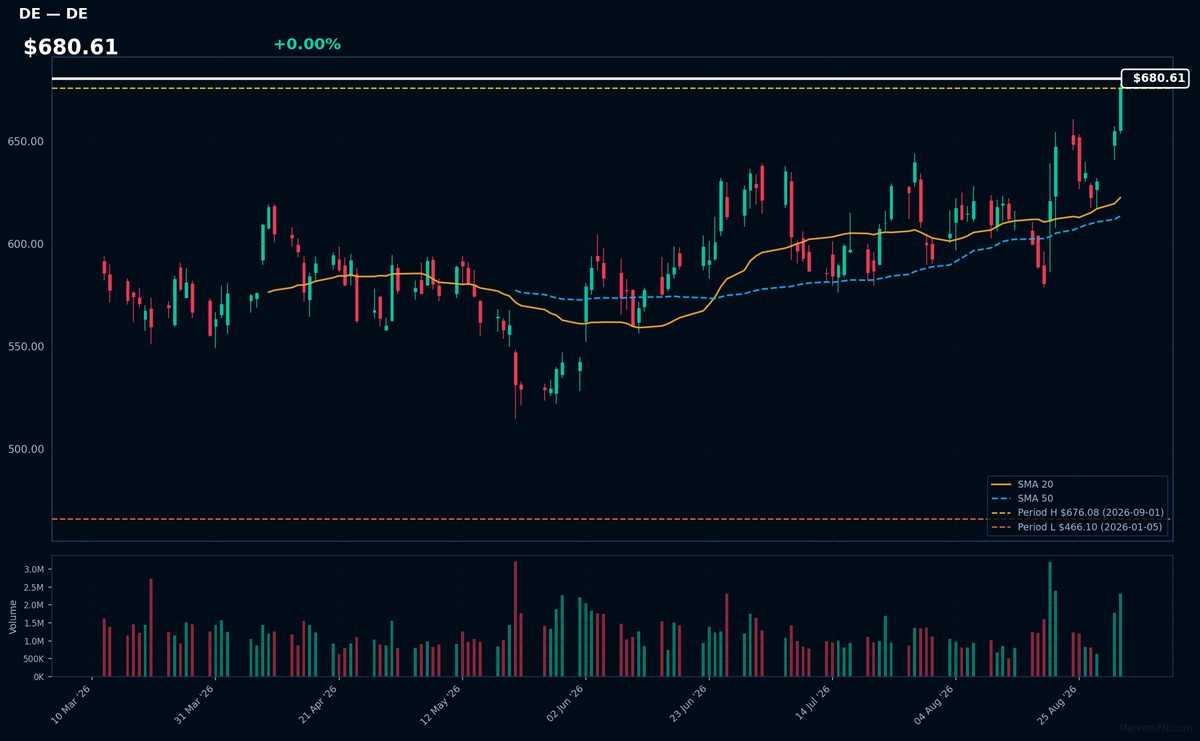
DE | Deere & Co | Industrials | Price Last: $676.08 | % Realized: +44.83% | RSI: 67.1 | % above MA200: +19.5% | Trend: Above MA20, MA50, MA200
Deere & Co is a leading manufacturer of agricultural machinery and equipment. Investors should care because its performance is closely tied to agricultural cycles, commodity prices, and global demand for farming equipment, making it a key player in the agricultural sector.
Deere & Co's current technical situation indicates strong momentum: RSI(14) is 67.1, and the stock is in a sustained uptrend with price > MA20 > MA50 > MA200. It's near a potential breakout level, 0.0% below its 2026 YTD high, after a 44.8% 2026 YTD return.
Related headlines
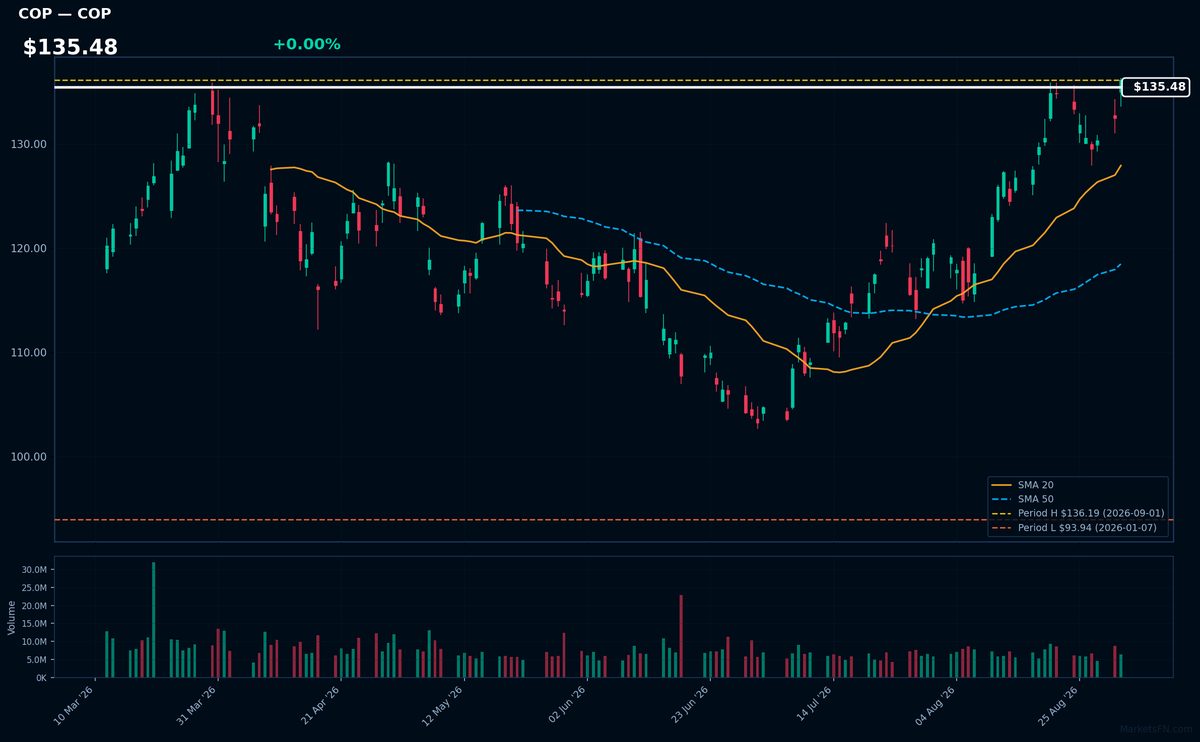
COP | Conoco Phillips | Energy | Price Last: $136.19 | % Realized: +40.84% | RSI: 67.7 | % above MA200: +21.3% | Trend: Above MA20, MA50, MA200
ConocoPhillips is an energy company focused on hydrocarbon exploration and production. Investors should care about its operational efficiency, reserve replacement, and ability to navigate energy transition trends, as these factors directly impact its long-term profitability and stock performance.
ConocoPhillips is in a sustained uptrend with price > MA20 > MA50 > MA200. The RSI(14) is 67.7, indicating strong momentum. The stock is 0.0% below its 2026 YTD high, suggesting a potential breakout, with a 40.8% return over the 2026 YTD period.
Related headlines
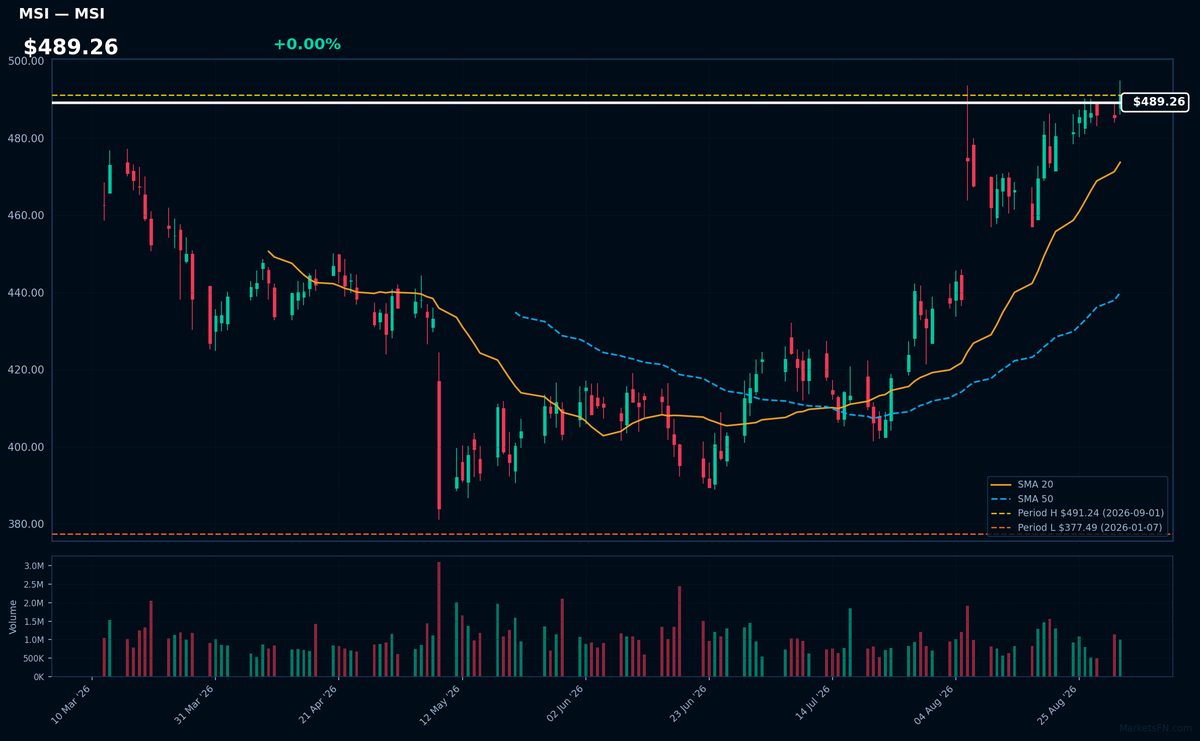
MSI | Motorola Solutions Inc | Technology | Price Last: $491.24 | % Realized: +28.93% | RSI: 67.6 | % above MA200: +16.5% | Trend: Above MA20, MA50, MA200
Motorola Solutions Inc provides mission-critical communication infrastructure and services, including public safety networks and video security solutions, which are crucial for government and enterprise customers, making it a key player in a vital industry with potentially stable long-term demand.
Motorola Solutions Inc is in a sustained uptrend with price > MA20 > MA50 > MA200, RSI(14) at 67.6, and is 0.0% below its 2026 YTD high, indicating strong momentum with no immediate signs of overbought conditions or reversal.
Related headlines
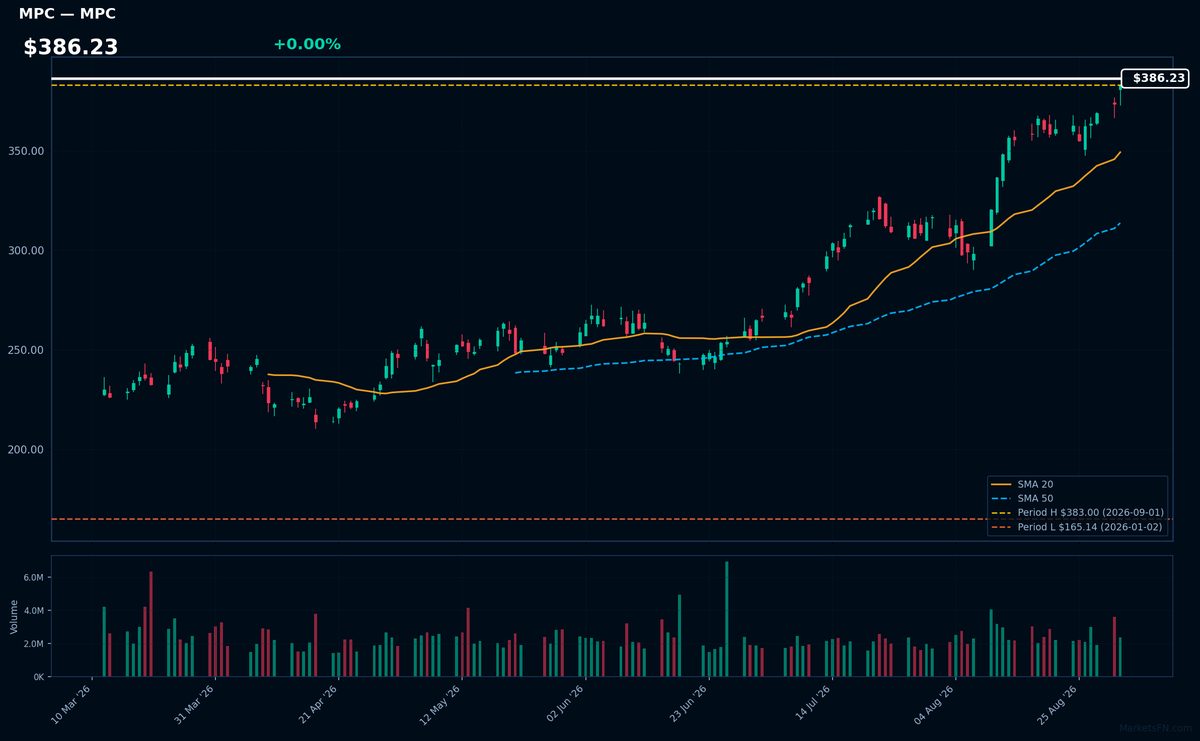
MPC | Marathon Petroleum Corp | Energy | Price Last: $383.00 | % Realized: +131.92% | RSI: 77.0 | % above MA200: +59.7% | Trend: Above MA20, MA50, MA200
Marathon Petroleum Corp is a refining and marketing company, operating refineries and distributing petroleum products. Investors should care about its refining capacity, product demand, and margin trends, which drive profitability.
MPC's RSI(14) is 77.0, indicating strong momentum with price > MA20 > MA50 > MA200, a sustained uptrend. At 0.0% below its 2026 YTD high, it nears a potential breakout level, suggesting continued upward pressure.
Related headlines
- Marathon Petroleum Named a Top 100 Internship Program for the Third Consecutive Year
- PSX, MPC Reportedly Weighed A Giant Merger What Sank The $180B Deal Between Phillips 66 And Marathon Petroleum
- MPC, PSX Stocks Hit All-Time Highs Whats Driving The Rally In These Energy Stocks?
- Marathon Petroleum Corp. stock outperforms competitors on strong trading day
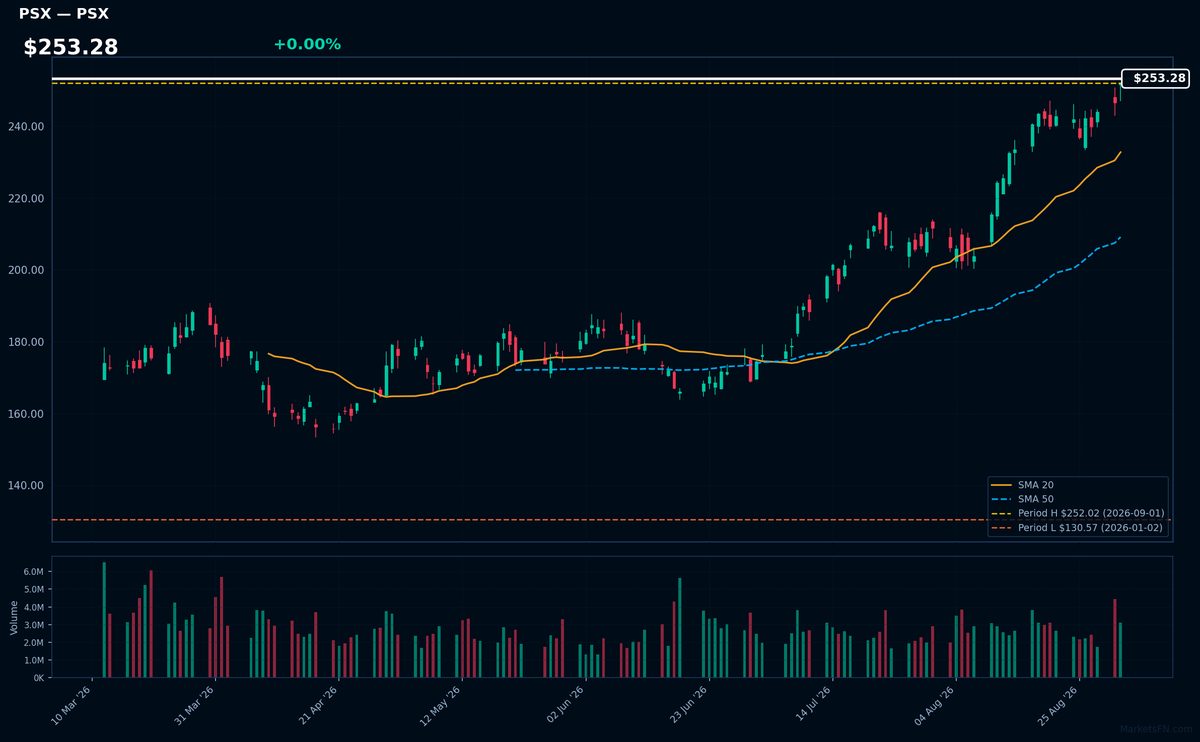
PSX | Phillips 66 | Energy | Price Last: $252.02 | % Realized: +93.02% | RSI: 75.4 | % above MA200: +47.2% | Trend: Above MA20, MA50, MA200
Phillips 66 is a diversified energy company with refining, midstream, and chemicals businesses. Investors should care about its refining margins, pipeline throughput, and chemicals demand, which drive its profitability and cash flow generation.
Phillips 66's RSI(14) is 75.4, indicating strong momentum. The stock is in a sustained uptrend with price > MA20 > MA50 > MA200 and is 0.0% below its 2026 YTD high, suggesting a potential breakout.
Related headlines
- Bill Nygren's Bold Q2 2026 Move: Trimming Phillips 66 for a -1.81% Portfolio Impact
- PSX, MPC Reportedly Weighed A Giant Merger What Sank The $180B Deal Between Phillips 66 And Marathon Petroleum
- Phillips 66 and partners approve $5bn Western Gateway Pipeline
- MPC, PSX Stocks Hit All-Time Highs Whats Driving The Rally In These Energy Stocks?
📉 Nearest to 2026 Low
Sectors represented: Consumer Cyclical (4), Consumer Defensive (1)
| Ticker | Company | Sector | Price Last | % Realized | 2026 YTD Low Date | RSI | % above MA200 | Trend |
|---|---|---|---|---|---|---|---|---|
| TJX | TJX Companies, Inc | Consumer Cyclical | $133.27 | -13.62% | 2026-09-01 | 19.8 | -13.9% | Below MA20, MA50, MA200 |
| LOW | Lowe's Cos., Inc | Consumer Cyclical | $200.05 | -18.97% | 2026-09-01 | 34.8 | -15.4% | Below MA20, MA50, MA200 |
| NKE | Nike, Inc | Consumer Cyclical | $38.12 | -39.76% | 2026-09-01 | 40.4 | -26.2% | Below MA20, MA50, MA200 |
| MNST | Monster Beverage Corp | Consumer Defensive | $44.99 | -40.93% | 2026-09-01 | 40.8 | -42.4% | Below MA20, MA50, MA200 |
| CCL | Carnival Corp | Consumer Cyclical | $23.23 | -24.87% | 2026-09-01 | 29.7 | -16.5% | Below MA20, MA50, MA200 |
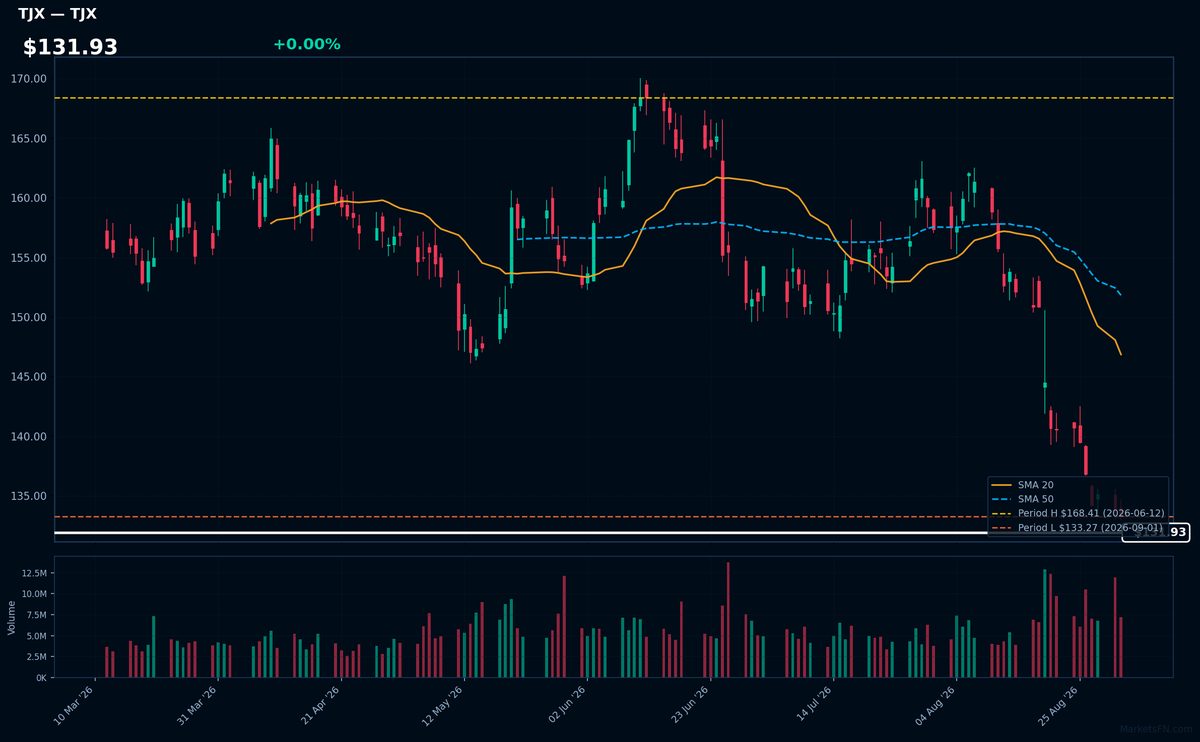
TJX | TJX Companies, Inc | Consumer Cyclical | Price Last: $133.27 | % Realized: -13.62% | RSI: 19.8 | % above MA200: -13.9% | Trend: Below MA20, MA50, MA200
TJX Companies, Inc operates as an off-price retailer, offering brand-name merchandise at discounted prices. Investors should care about its ability to maintain margins and sales growth amidst competitive pressures.
TJX is in a sustained downtrend with RSI(14) at 19.8, indicating oversold conditions. The price is below all MAs (MA20, MA50, MA200) and 0.0% above its 2026 YTD low, warning of potential further decline.
Related headlines
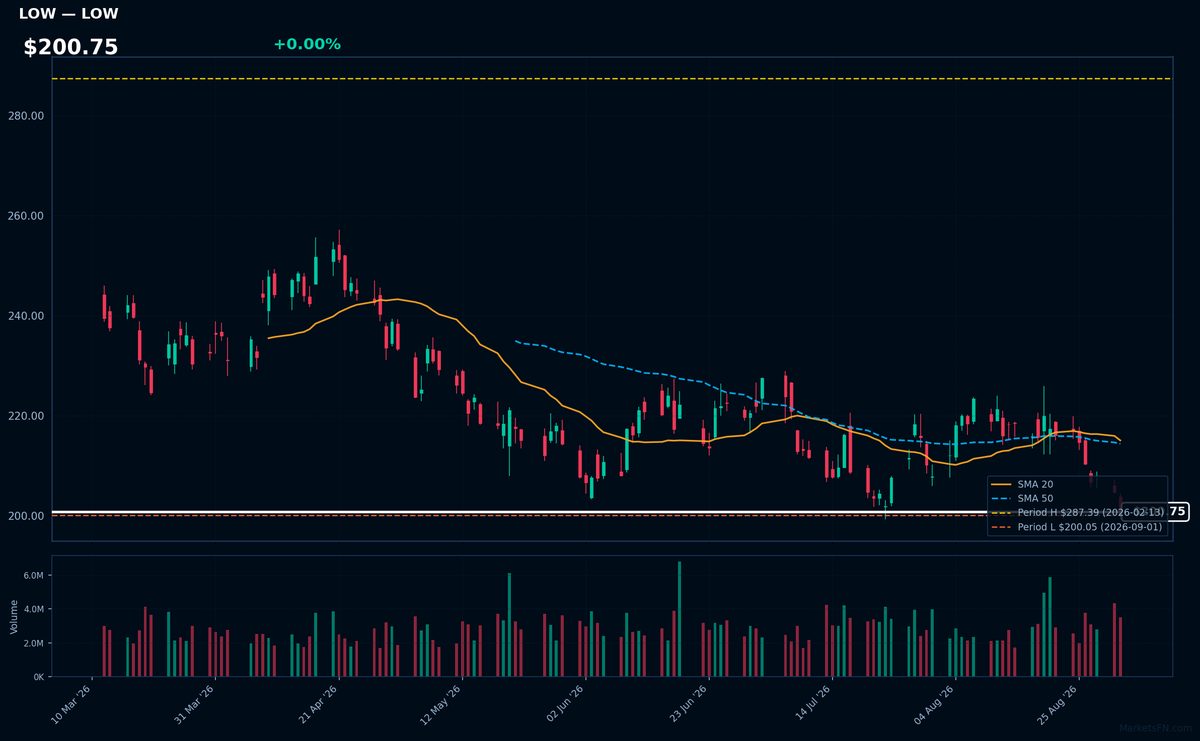
LOW | Lowe's Cos., Inc | Consumer Cyclical | Price Last: $200.05 | % Realized: -18.97% | RSI: 34.8 | % above MA200: -15.4% | Trend: Below MA20, MA50, MA200
Lowe's Cos., Inc is a home improvement retailer operating a chain of stores offering building materials, home decor, and appliances. Investors should care as its performance reflects housing market trends and consumer spending habits.
Lowe's is testing major support with a price 0.0% above its 2026 YTD low. The RSI(14) is 34.8, indicating oversold conditions. Bearish MA alignment (price < MA20 < MA50 < MA200) suggests a sustained downtrend, potentially a warning sign.
Related headlines
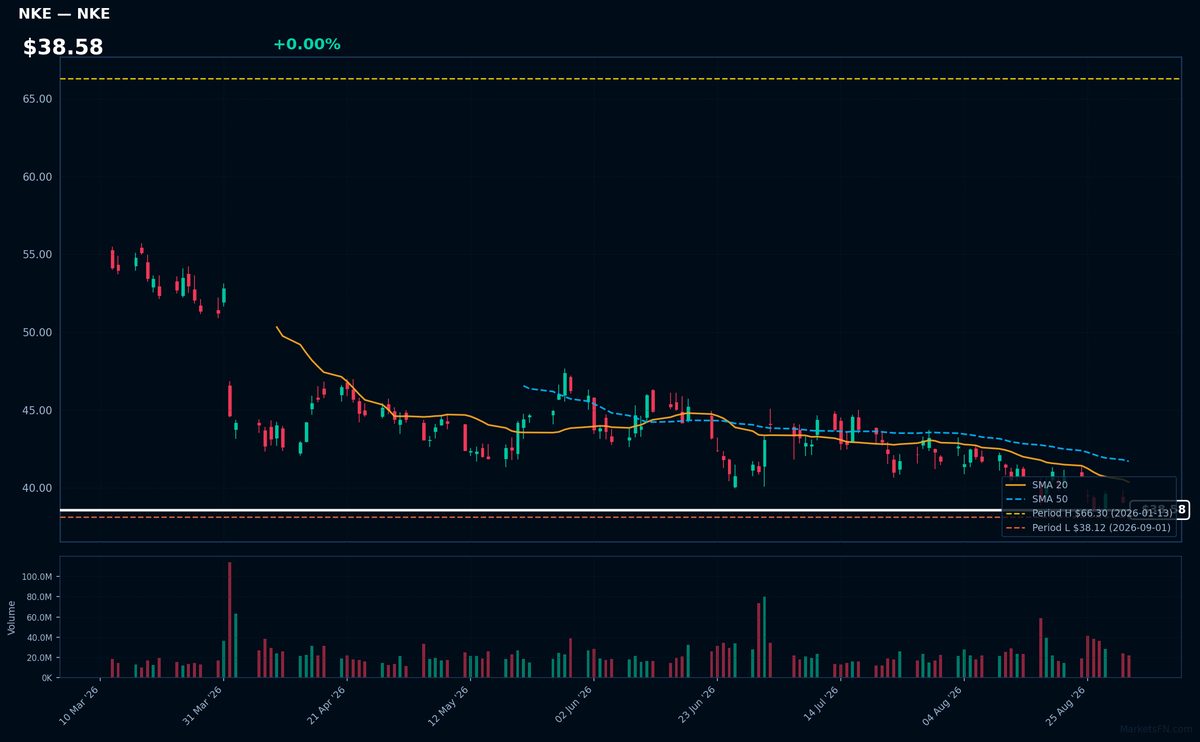
NKE | Nike, Inc | Consumer Cyclical | Price Last: $38.12 | % Realized: -39.76% | RSI: 40.4 | % above MA200: -26.2% | Trend: Below MA20, MA50, MA200
Nike, Inc designs and sells athletic footwear, apparel, and equipment. Investors should care about its brand strength, product innovation, and global distribution network, which drive revenue growth and profitability.
Nike's technicals indicate a sustained downtrend with price ($38.58) below MA20, MA50, and MA200. RSI(14) is 40.4, nearing oversold territory. The stock is testing major support at its 2026 YTD low, having fallen 39.8% YTD.
Related headlines
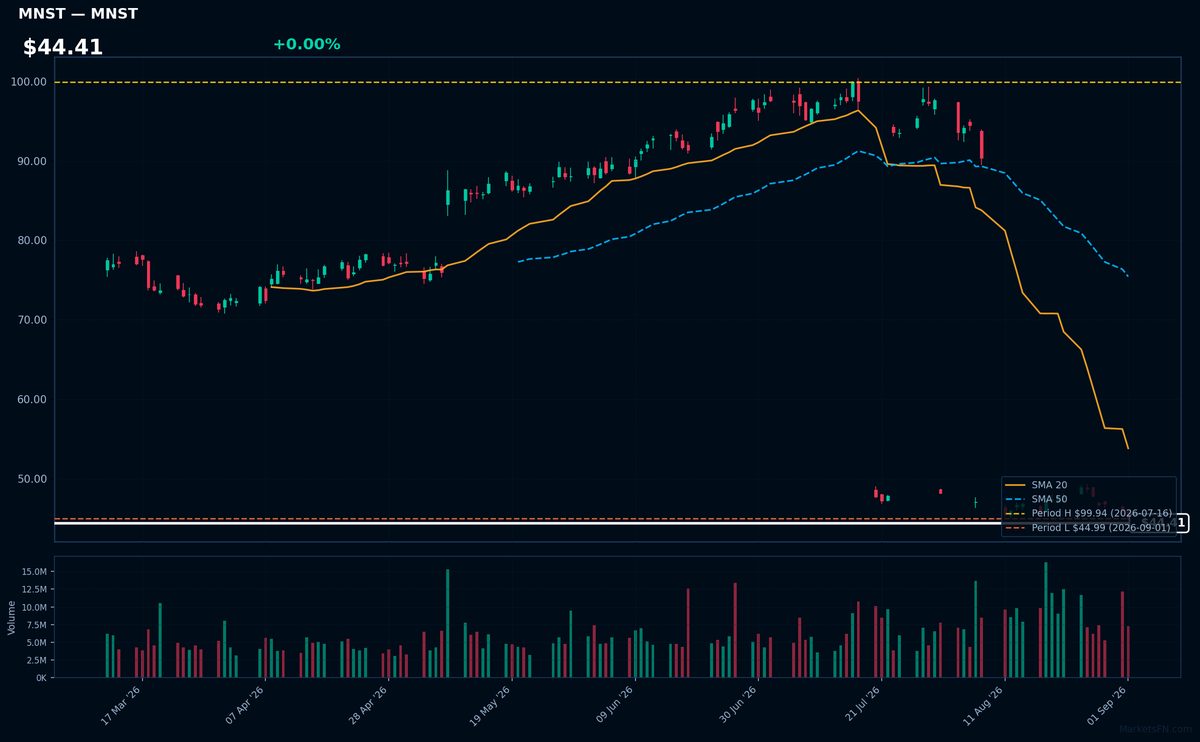
MNST | Monster Beverage Corp | Consumer Defensive | Price Last: $44.99 | % Realized: -40.93% | RSI: 40.8 | % above MA200: -42.4% | Trend: Below MA20, MA50, MA200
Monster Beverage Corp (MNST) is a leading developer and distributor of energy drinks, including its namesake Monster Energy brand. Investors should care about its performance as it reflects consumer demand for energy drinks and the company's market share.
The stock is in a sustained downtrend with price ($44.41) below all key MAs (MA20, MA50, MA200), RSI(14) at 40.8 indicating bearish momentum, and is testing major support at its 2026 YTD low, down 40.9% YTD.
Related headlines
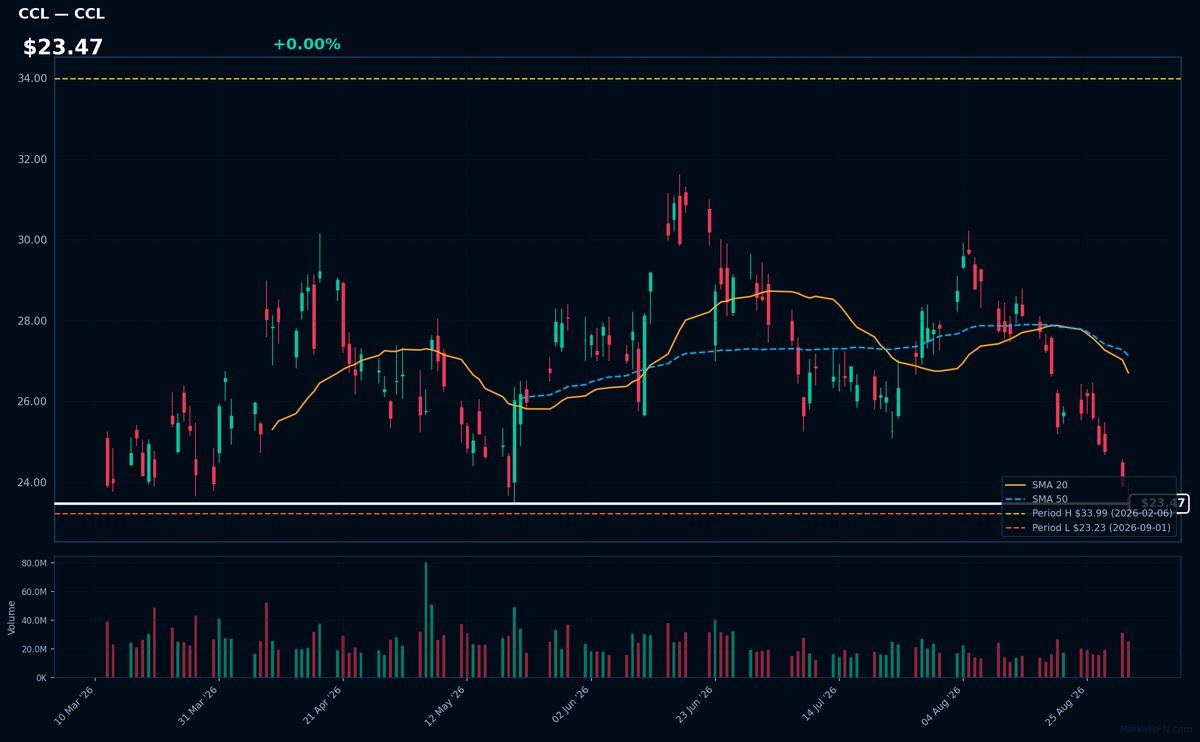
CCL | Carnival Corp | Consumer Cyclical | Price Last: $23.23 | % Realized: -24.87% | RSI: 29.7 | % above MA200: -16.5% | Trend: Below MA20, MA50, MA200
Carnival Corp operates cruise lines, offering vacation experiences globally. Investors should care about its performance as it reflects demand for leisure travel and the company's ability to manage costs and capacity amidst economic fluctuations.
Carnival Corp's technicals indicate a sustained downtrend with price ($23.47) below MA20, MA50, and MA200. The RSI(14) at 29.7 suggests oversold conditions, and the stock is testing major support at its 2026 YTD low.
Related headlines
Market Commentary
The S&P 500 stocks listed are currently trading near their year-to-date (YTD) extremes for 2026. For stocks near their 2026 highs, such as Deere & Co (DE), Conoco Phillips (COP), and Motorola Solutions Inc (MSI), their prices are exactly at their highest YTD levels. Conversely, stocks like TJX Companies, Inc (TJX), Lowe's Cos., Inc (LOW), and Nike, Inc (NKE) are at their lowest YTD levels.
The stocks near their 2026 highs are primarily from the energy and industrials sectors, indicating strong performance in these areas. In contrast, the stocks near their 2026 lows span consumer discretionary and retail, suggesting challenges in these sectors. The divergence may be attributed to varying market conditions and sector-specific themes, such as energy demand and consumer spending patterns.
Investors should monitor sector-specific news and broader market trends to understand the sustainability of these trends. Watching earnings reports and industry developments for these companies, as well as overall economic indicators, will be crucial in determining whether these stocks continue to trade near their YTD extremes.
Methodology: All 503 S&P 500 constituents screened. Close prices downloaded from 2026-01-01. Period high = highest close since Jan 1 2026; period low = lowest close since Jan 1 2026. Distance = (current price / period extreme − 1) × 100. Technical indicators computed on up to 1 year of daily OHLCV data.
Disclaimer: For informational purposes only. Not investment advice. Past performance is not indicative of future results.


