S&P 500 2026 YTD Highs & Lows Radar: Crowdstrike (CRWD), TJXmpanies, (TJX) and more
MarketsFN Team

S&P 500 2026 YTD Highs & Lows Radar: Crowdstrike (CRWD), TJXmpanies, (TJX) and more
Screening all 503 S&P 500 constituents for stocks nearest to their 2026 year-to-date high and their 2026 YTD low. Data as of September 15, 2026. % Realized = total return since Jan 1 2026.
Legend: RSI > 70 = overbought · RSI < 30 = oversold · Green % Realized = positive YTD return · Red = negative.
📈 Nearest to 2026 High
Sectors represented: Technology (2), Communication Services (1), Industrials (1), Consumer Cyclical (1)
| Ticker | Company | Sector | Price Last | % Realized | 2026 YTD High Date | RSI | % above MA200 | Trend |
|---|---|---|---|---|---|---|---|---|
| CRWD | Crowdstrike Holdings Inc | Technology | $235.38 | +107.58% | 2026-09-14 | 62.3 | +62.1% | Above MA20, MA50, MA200 |
| EA | Electronic Arts, Inc | Communication Services | $209.70 | +0.38% | 2026-08-04 | — | — | — |
| GEN | Gen Digital Inc | Technology | $31.41 | +20.48% | 2026-09-14 | 61.6 | +27.0% | Above MA20, MA50, MA200 |
| EXPD | Expeditors International Of Washington, Inc | Industrials | $193.61 | +27.49% | 2026-09-14 | 64.5 | +20.9% | Above MA20, MA50, MA200 |
| BBY | Best Buy Co. Inc | Consumer Cyclical | $94.83 | +37.08% | 2026-09-14 | 67.0 | +31.8% | Above MA20, MA50, MA200 |
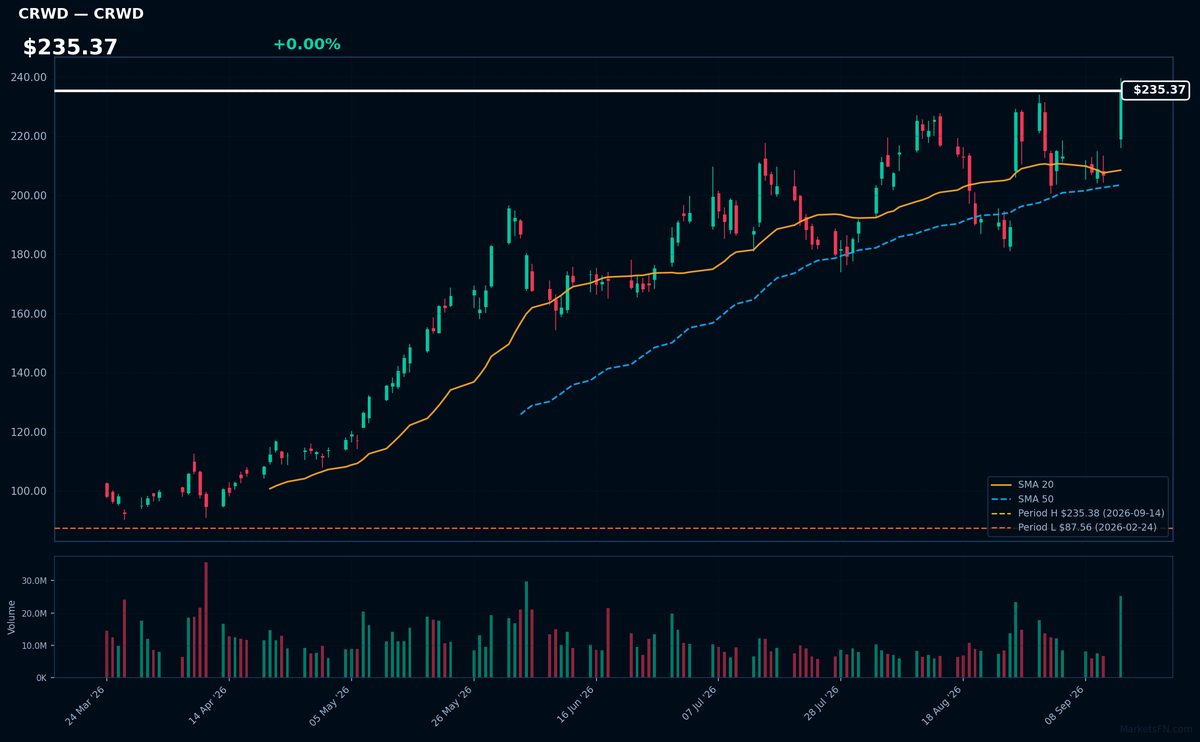
CRWD | Crowdstrike Holdings Inc | Technology | Price Last: $235.38 | % Realized: +107.58% | RSI: 62.3 | % above MA200: +62.1% | Trend: Above MA20, MA50, MA200
Crowdstrike Holdings Inc is a cybersecurity company providing cloud-delivered endpoint protection. Investors should care because its innovative Falcon platform has driven significant growth, making it a key player in the rapidly expanding cybersecurity market.
Crowdstrike's technicals indicate sustained uptrend with price at $235.37, RSI(14) at 62.3, and bullish MA alignment (price > MA20 > MA50 > MA200). Near its 2026 YTD high, it's poised for potential breakout, having returned 107.6% YTD.
Related headlines
- AI Safety Fears Drive Investors to J&J, Costco, and CrowdStrike for Cybersecurity
- Why Did CRWD, ELMT, OKTA Stocks Surge To 52-Week Highs Today?
- S&P 500, Nasdaq, Dow Drop On Chipmaker Weakness, Treasury Yield Pressure MSFT, NFLX, ORCL, CRWD, RBLX In Focus
- CrowdStrike and Palo Alto Networks are leading software stocks toward a never-before-seen feat
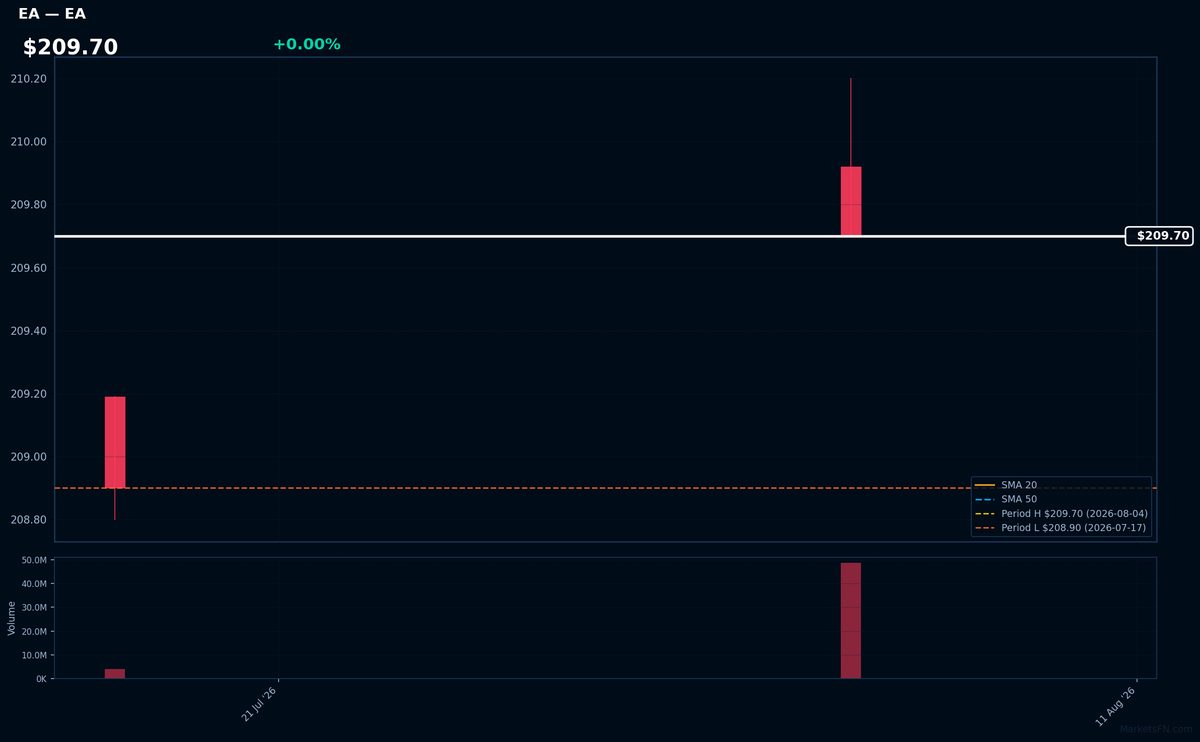
EA | Electronic Arts, Inc | Communication Services | Price Last: $209.70 | % Realized: +0.38% | RSI: — | % above MA200: — | Trend: —
Electronic Arts, Inc (EA) is a video game company that develops and publishes games such as FIFA and Madden NFL. Investors should care because its games have a large and dedicated player base, potentially driving revenue growth.
The stock is near its 2026 YTD high, up 0.4% YTD. RSI and MA data are incomplete, so momentum and trend alignment cannot be assessed. The proximity to its YTD high may indicate a potential breakout.
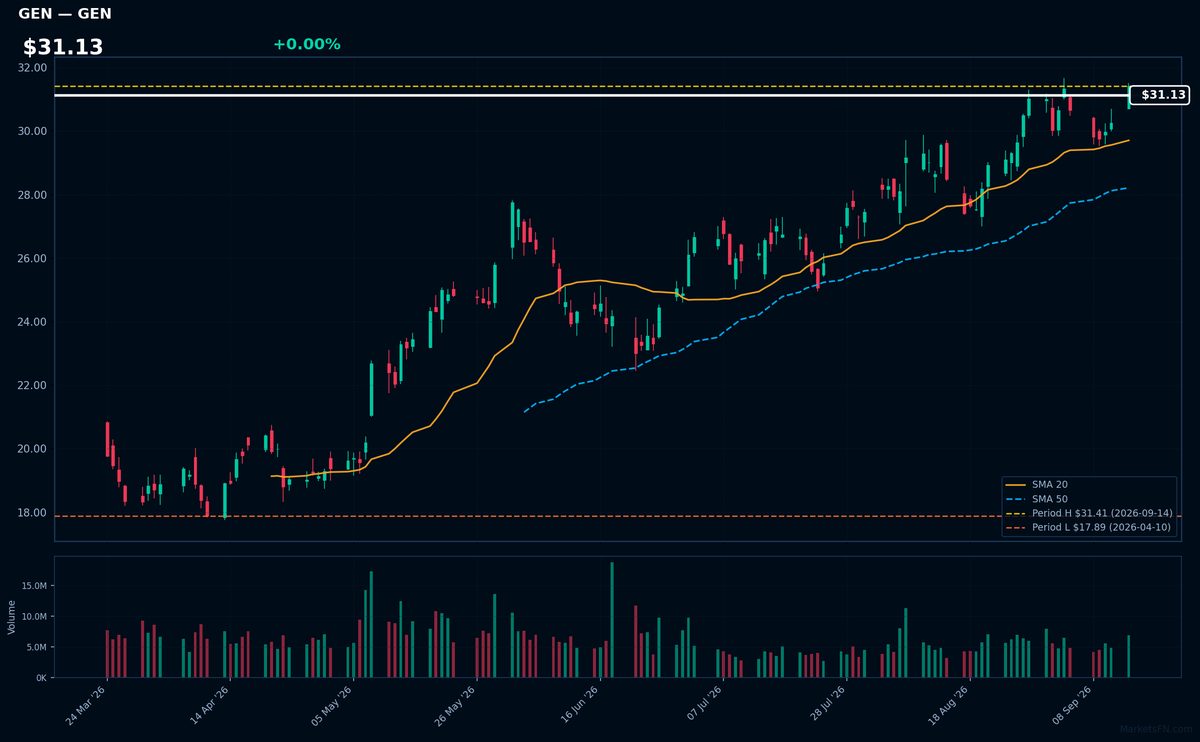
GEN | Gen Digital Inc | Technology | Price Last: $31.41 | % Realized: +20.48% | RSI: 61.6 | % above MA200: +27.0% | Trend: Above MA20, MA50, MA200
Gen Digital Inc's specific business operations are not detailed in the provided data; however, investors should care about its stock performance as indicated by its 20.5% return over the 2026 YTD period.
Gen Digital Inc is in a sustained uptrend with a bullish MA alignment: price ($31.13) > MA20 > MA50 > MA200, and an RSI(14) of 61.6, indicating momentum. It's near a potential breakout level, 0.0% below its 2026 YTD high.
Related headlines
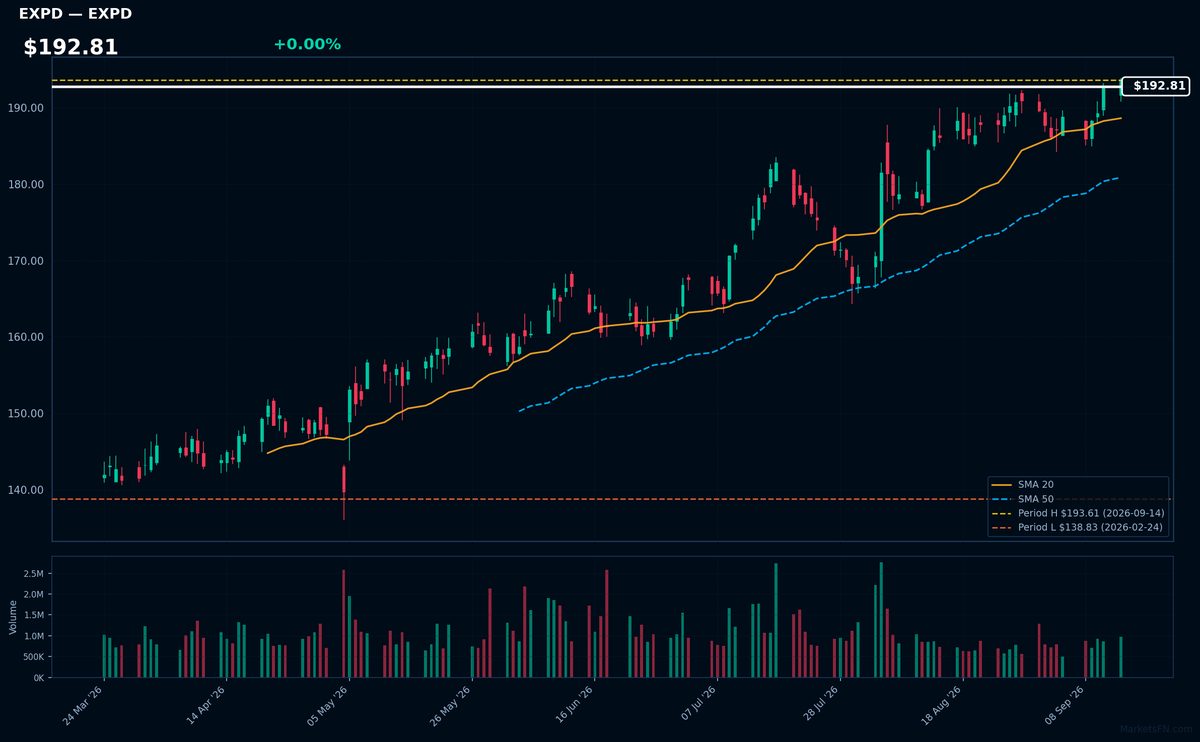
EXPD | Expeditors International Of Washington, Inc | Industrials | Price Last: $193.61 | % Realized: +27.49% | RSI: 64.5 | % above MA200: +20.9% | Trend: Above MA20, MA50, MA200
Expeditors International Of Washington, Inc provides logistics services, including air and ocean freight forwarding, customs brokerage, and warehousing. Investors should care because the company's operational efficiency and global network drive revenue growth and profitability.
The stock exhibits bullish MA alignment with price > MA20 > MA50 > MA200, RSI(14) at 64.5, and is 0.0% below its 2026 YTD high, indicating sustained uptrend and potential breakout momentum.
Related headlines
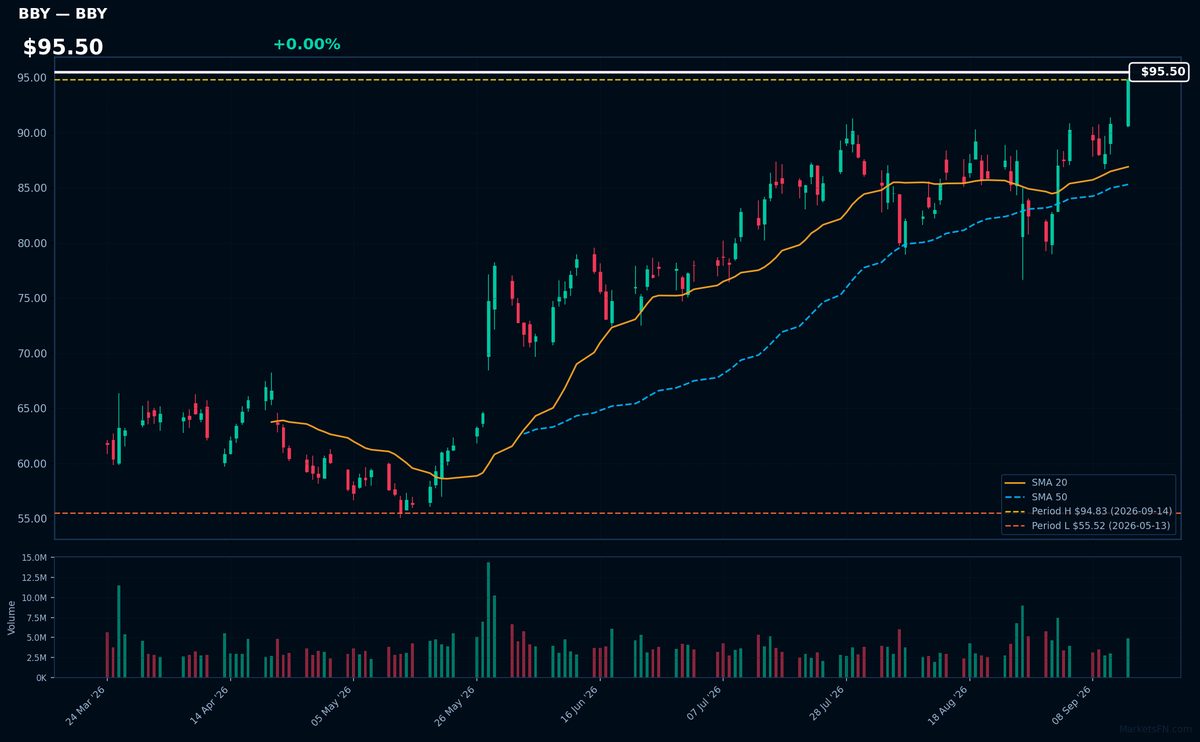
BBY | Best Buy Co. Inc | Consumer Cyclical | Price Last: $94.83 | % Realized: +37.08% | RSI: 67.0 | % above MA200: +31.8% | Trend: Above MA20, MA50, MA200
Best Buy Co. Inc (BBY) operates as a consumer electronics retailer, offering a range of products including appliances, computing, entertainment, and mobile phones. Investors should care as its performance reflects consumer spending trends and competition in the retail tech space.
BBY's technicals indicate sustained uptrend with price at $95.50 above MA20, MA50, and MA200. RSI(14) is 67.0, nearing overbought territory. The stock is 0.0% below its 2026 YTD high, suggesting potential breakout momentum.
Related headlines
📉 Nearest to 2026 Low
Sectors represented: Industrials (2), Utilities (2), Consumer Cyclical (1)
| Ticker | Company | Sector | Price Last | % Realized | 2026 YTD Low Date | RSI | % above MA200 | Trend |
|---|---|---|---|---|---|---|---|---|
| TJX | TJX Companies, Inc | Consumer Cyclical | $125.99 | -18.34% | 2026-09-14 | 17.6 | -18.2% | Below MA20, MA50, MA200 |
| HON | Honeywell International Inc | Industrials | $201.38 | -1.97% | 2026-09-14 | 27.9 | -12.4% | Below MA20, MA50, MA200 |
| TDG | Transdigm Group Incorporated | Industrials | $1111.22 | -18.21% | 2026-09-14 | 30.9 | -12.0% | Below MA20, MA50, MA200 |
| EXC | Exelon Corp | Utilities | $42.72 | -2.73% | 2026-09-14 | 30.5 | -6.8% | Below MA20, MA50, MA200 |
| PEG | Public Service Enterprise Group Inc | Utilities | $70.92 | -12.43% | 2026-09-14 | 26.9 | -11.0% | Below MA20, MA50, MA200 |
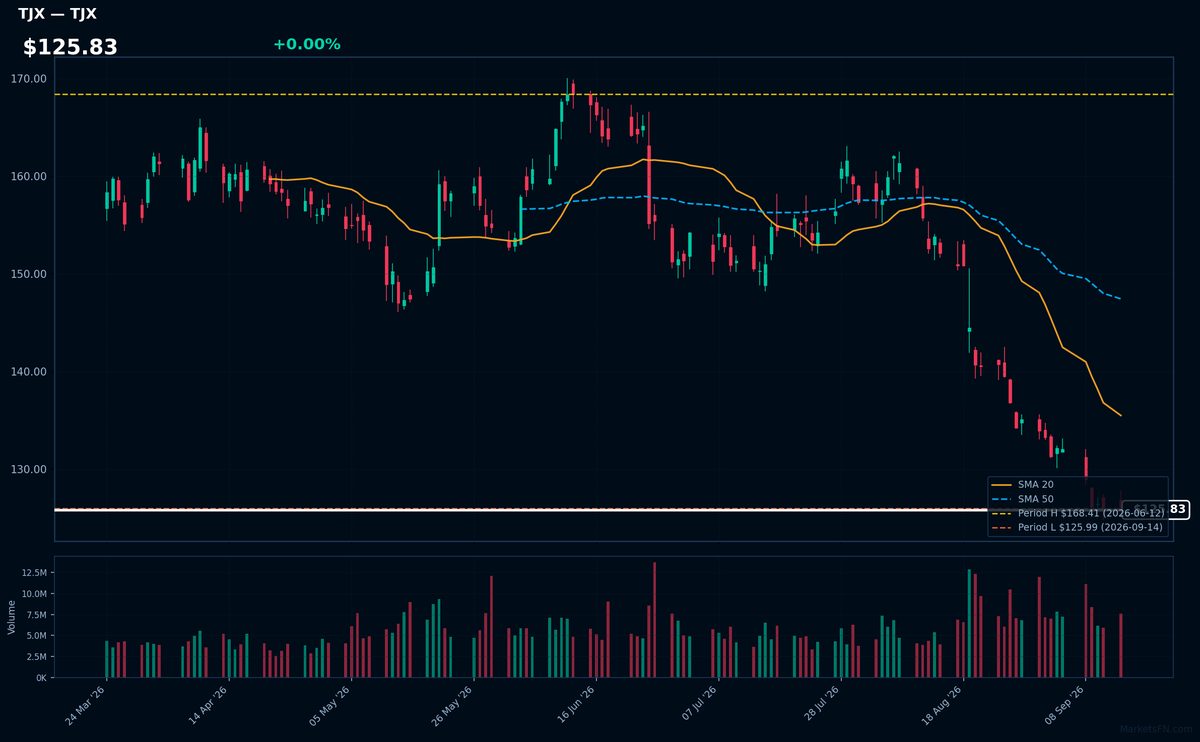
TJX | TJX Companies, Inc | Consumer Cyclical | Price Last: $125.99 | % Realized: -18.34% | RSI: 17.6 | % above MA200: -18.2% | Trend: Below MA20, MA50, MA200
TJX Companies, Inc operates off-price retail stores, offering brand-name merchandise at discounted prices. Investors should care about its ability to maintain margins and sales growth amidst changing consumer behavior and competitive pressures.
TJX is in a sustained downtrend with price ($125.83) below MA20, MA50, and MA200. The RSI(14) is 17.6, indicating oversold conditions. The stock is testing major support at its 2026 YTD low, having fallen -18.3% YTD.
Related headlines
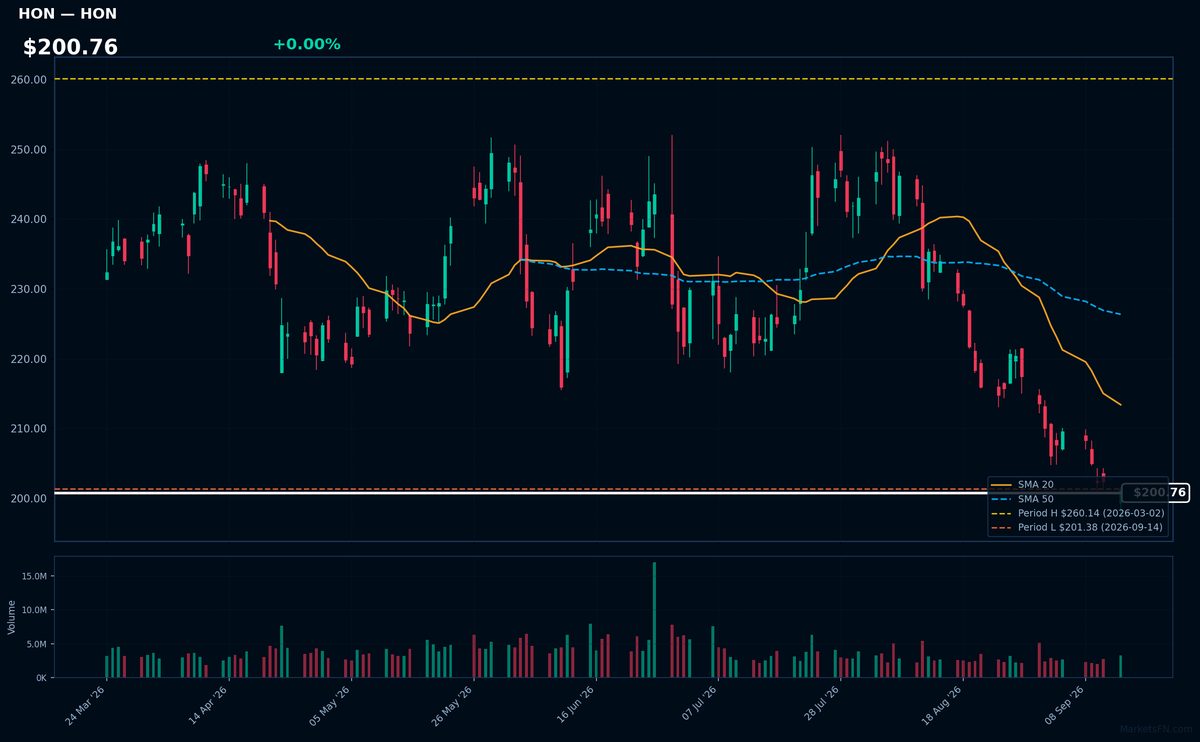
HON | Honeywell International Inc | Industrials | Price Last: $201.38 | % Realized: -1.97% | RSI: 27.9 | % above MA200: -12.4% | Trend: Below MA20, MA50, MA200
Honeywell International Inc is a diversified technology conglomerate that produces aerospace products, building technologies, and performance materials. Investors should care about its exposure to industrial and commercial sectors, making it sensitive to economic cycles.
Honeywell's current technical situation shows a sustained downtrend with price ($200.76) below MA20, MA50, and MA200. The RSI(14) is 27.9, near oversold territory, and the stock is at its 2026 YTD low, indicating potential support testing.
Related headlines
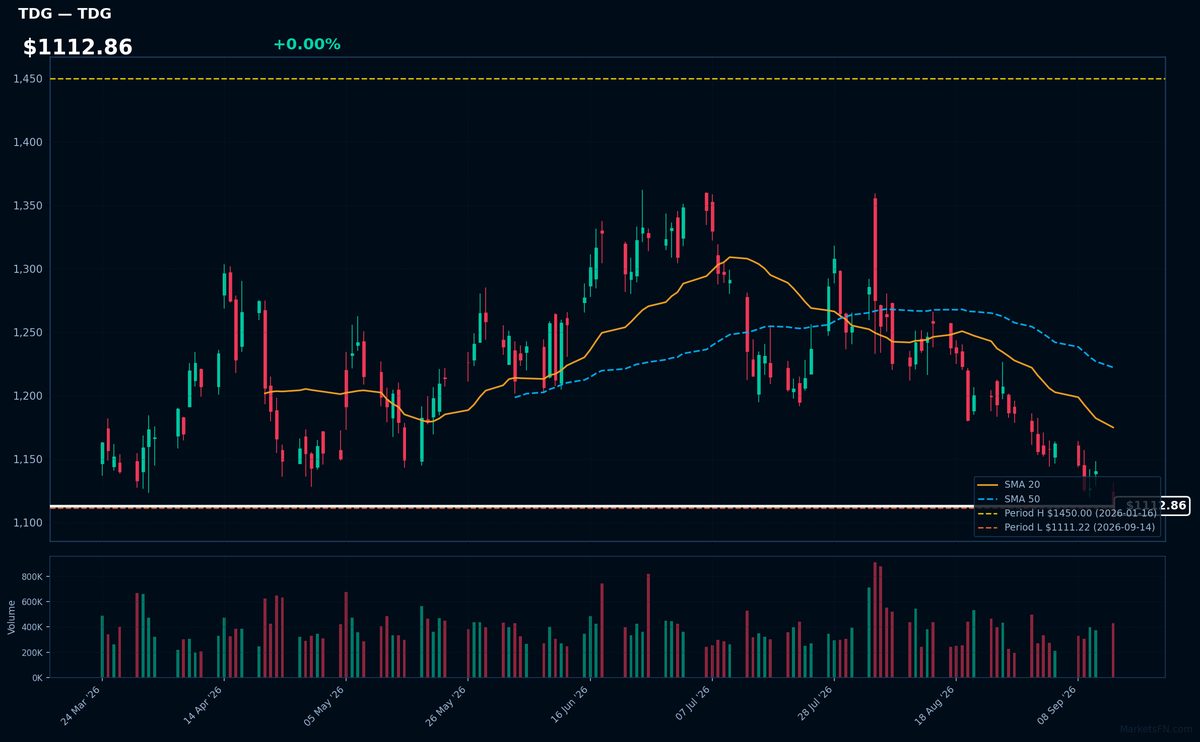
TDG | Transdigm Group Incorporated | Industrials | Price Last: $1111.22 | % Realized: -18.21% | RSI: 30.9 | % above MA200: -12.0% | Trend: Below MA20, MA50, MA200
Transdigm Group Incorporated is a leading aerospace components manufacturer, producing proprietary aerospace parts. Investors should care due to its significant presence in the aerospace industry, potential for long-term growth, and historical performance.
TDG's technical situation indicates a sustained downtrend with price ($1112.86) below MA20, MA50, and MA200. The RSI(14) is 30.9, near oversold territory, and the stock is at its 2026 YTD low, a potential support level, with a -18.2% YTD return, signaling a warning sign.
Related headlines
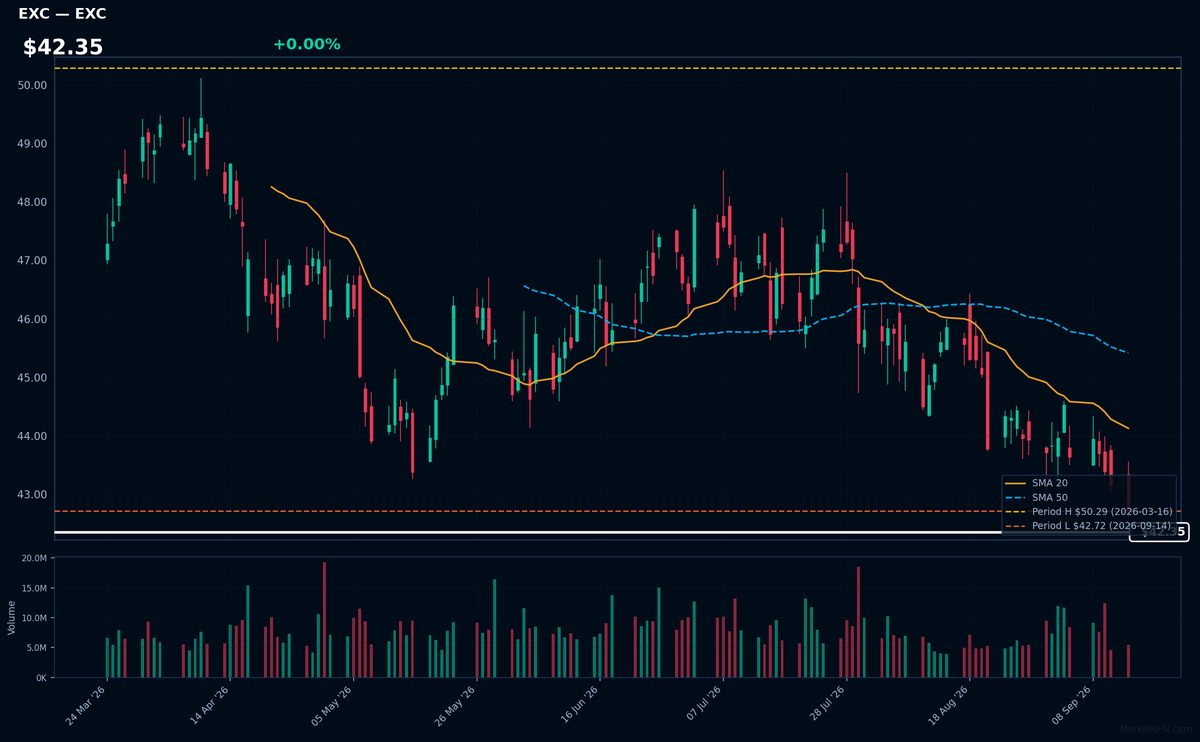
EXC | Exelon Corp | Utilities | Price Last: $42.72 | % Realized: -2.73% | RSI: 30.5 | % above MA200: -6.8% | Trend: Below MA20, MA50, MA200
Exelon Corp is a utility company that generates and distributes electricity, operating nuclear, natural gas, and renewable energy facilities. Investors care due to its stable cash flows and dividend yield, driven by regulated utilities and long-term contracts.
Exelon Corp's technical situation is bearish, with an RSI(14) of 30.5 indicating oversold conditions. The sustained downtrend is evident as price ($42.35) < MA20 < MA50 < MA200, and it's testing major support at its 2026 YTD low.
Related headlines
- Exelon Announces Key Leadership Position Changes
- Exelon Secures More Than $1 Billion in Customer Protections Through Pioneering Transmission Security Agreements
- Exelon high probability data center load falls 40%
- Exelon Corp (EXC) (Q2 2026) Earnings Call Highlights: Navigating Regulatory Hurdles and Data ...
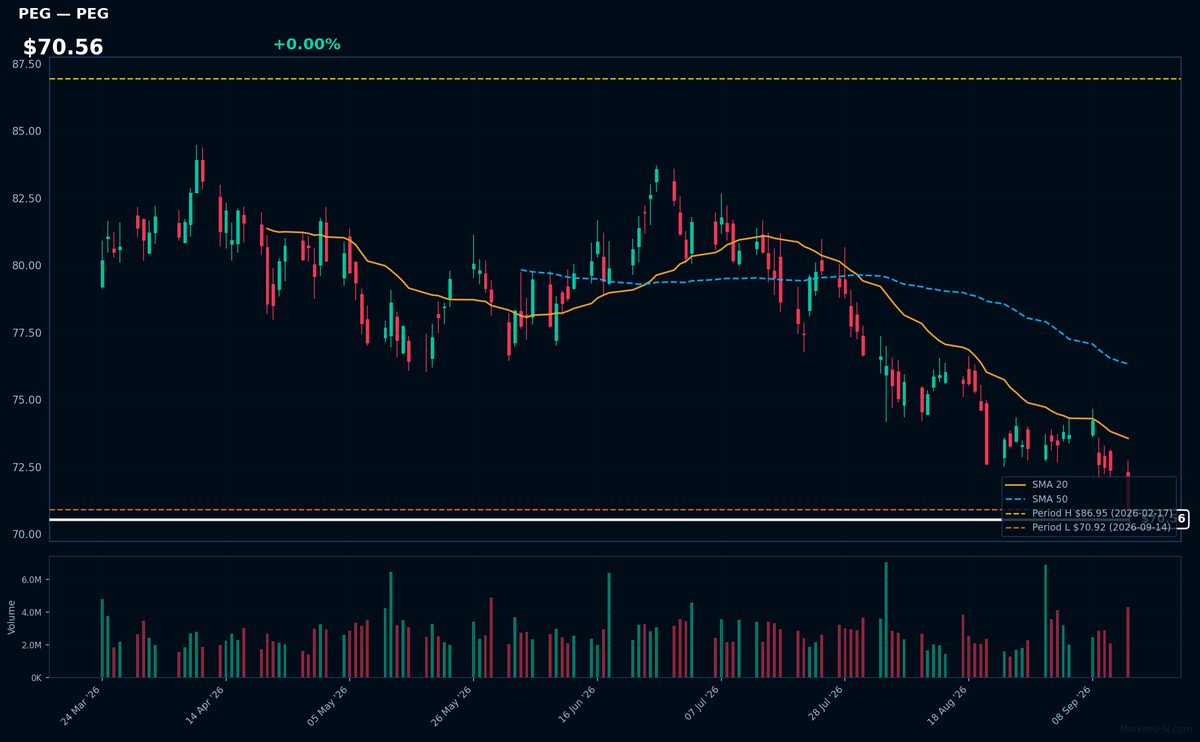
PEG | Public Service Enterprise Group Inc | Utilities | Price Last: $70.92 | % Realized: -12.43% | RSI: 26.9 | % above MA200: -11.0% | Trend: Below MA20, MA50, MA200
Public Service Enterprise Group Inc (PEG) is an energy company that generates and distributes electricity, providing essential services to customers. Investors care about its stable cash flows and regulated returns, making it attractive for income-seeking investors.
PEG's technical situation is bearish, with an RSI(14) of 26.9 indicating oversold conditions. The sustained downtrend is evident as price ($70.56) < MA20 < MA50 < MA200, and it's testing major support at its 2026 YTD low.
Related headlines
Market Commentary
The S&P 500 stocks listed are near their 2026 year-to-date (YTD) extremes, with some at their highs and others at their lows. Stocks like CRWD, EA, GEN, EXPD, and BBY are at their 2026 YTD highs, having gained significantly since the start of the year. Conversely, TJX, HON, TDG, EXC, and PEG are at their 2026 YTD lows, indicating a decline or stagnation in their YTD performance.
The stocks near their 2026 YTD highs and lows represent various sectors, including technology (CRWD, GEN), consumer discretionary (EA, BBY, TJX), industrials (EXPD, HON, TDG), and utilities (EXC, PEG). The performance of these stocks may be influenced by sector-specific themes and broader market conditions. For instance, the technology sector has seen significant growth, while certain industrials and utilities have faced challenges.
Investors should monitor the factors driving these stocks to their extremes, such as earnings reports, industry trends, and macroeconomic conditions. As the year progresses, changes in these factors may cause these stocks to move away from their current extremes, presenting potential opportunities or risks for investors.
Methodology: All 503 S&P 500 constituents screened. Close prices downloaded from 2026-01-01. Period high = highest close since Jan 1 2026; period low = lowest close since Jan 1 2026. Distance = (current price / period extreme − 1) × 100. Technical indicators computed on up to 1 year of daily OHLCV data.
Disclaimer: For informational purposes only. Not investment advice. Past performance is not indicative of future results.

