S&P 500 2026 YTD Highs & Lows Radar: Crowdstrike (CRWD), Home Depot, (HD) and more
MarketsFN Team

S&P 500 2026 YTD Highs & Lows Radar: Crowdstrike (CRWD), Home Depot, (HD) and more
Screening all 503 S&P 500 constituents for stocks nearest to their 2026 year-to-date high and their 2026 YTD low. Data as of October 02, 2026. % Realized = total return since Jan 1 2026.
Legend: RSI > 70 = overbought · RSI < 30 = oversold · Green % Realized = positive YTD return · Red = negative.
📈 Nearest to 2026 High
Sectors represented: Technology (4), Communication Services (1)
| Ticker | Company | Sector | Price Last | % Realized | 2026 YTD High Date | RSI | % above MA200 | Trend |
|---|---|---|---|---|---|---|---|---|
| CRWD | Crowdstrike Holdings Inc | Technology | $266.09 | +134.66% | 2026-10-01 | 69.8 | +73.3% | Above MA20, MA50, MA200 |
| HPE | Hewlett Packard Enterprise Co | Technology | $64.58 | +167.19% | 2026-10-01 | 68.5 | +75.0% | Above MA20, MA50, MA200 |
| WBD | Warner Bros. Discovery Inc | Communication Services | $30.95 | +8.56% | 2026-09-30 | 75.1 | +11.8% | Above MA20, MA50, MA200 |
| KEYS | Keysight Technologies Inc | Technology | $373.88 | +80.98% | 2026-10-01 | 72.7 | +23.6% | Above MA20, MA50, MA200 |
| NTAP | Netapp Inc | Technology | $215.05 | +101.98% | 2026-10-01 | 74.4 | +55.0% | Above MA20, MA50, MA200 |
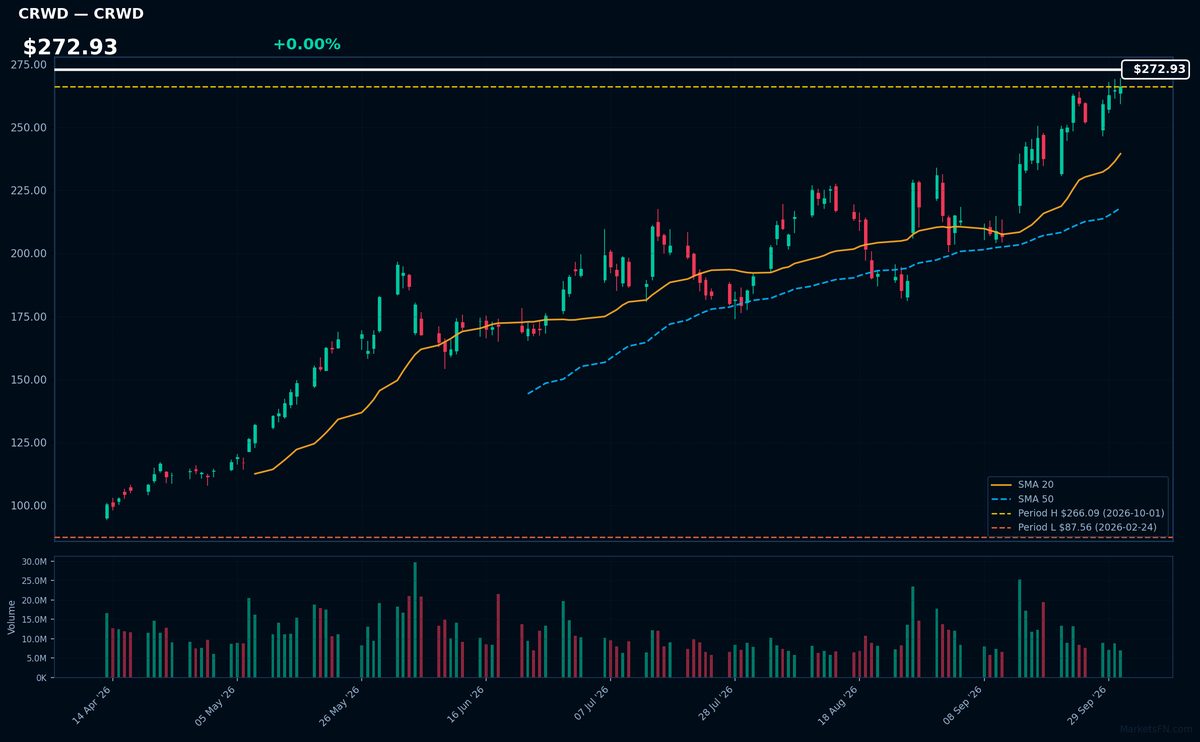
CRWD | Crowdstrike Holdings Inc | Technology | Price Last: $266.09 | % Realized: +134.66% | RSI: 69.8 | % above MA200: +73.3% | Trend: Above MA20, MA50, MA200
Crowdstrike Holdings Inc provides cloud-native endpoint protection and threat intelligence. Investors should care because the company is capturing the shift toward consolidated cybersecurity platforms, evidenced by a 134.7% return over the 2026 YTD period.
Strong bullish momentum is evident with price > MA20 > MA50 > MA200. The stock is 0.0% below its 2026 YTD high, signaling a potential breakout. An RSI(14) of 69.8 indicates high strength approaching overbought territory.
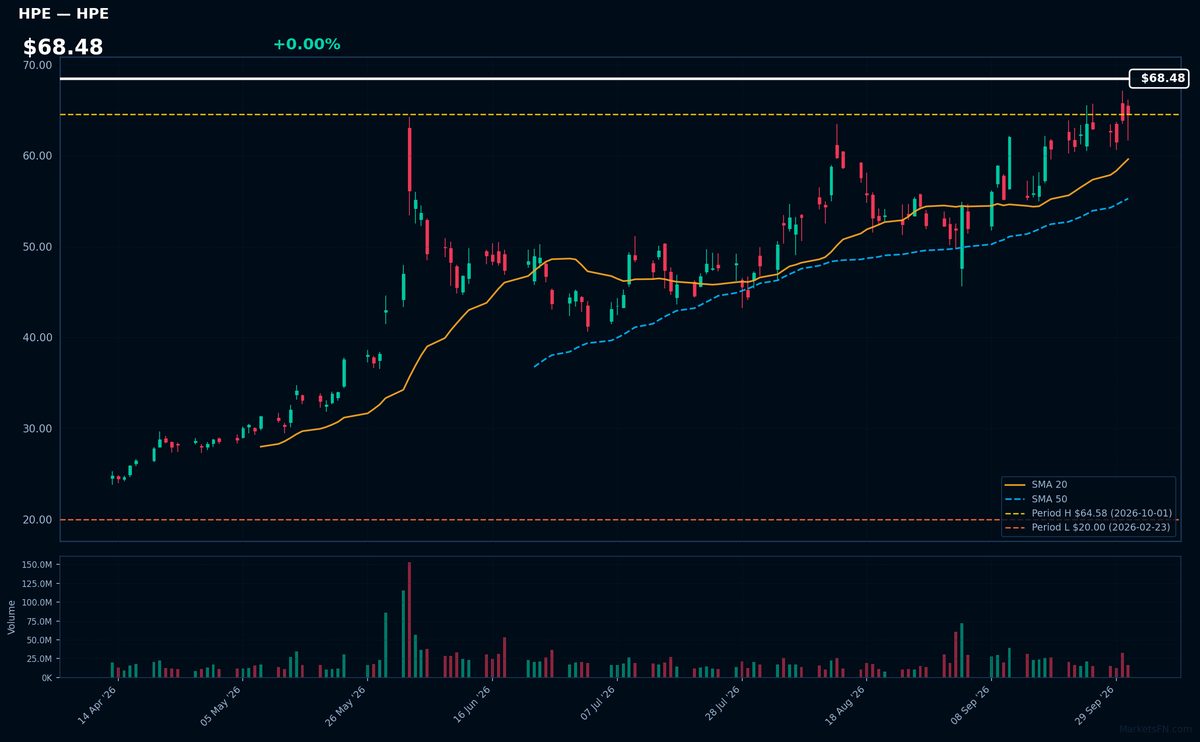
HPE | Hewlett Packard Enterprise Co | Technology | Price Last: $64.58 | % Realized: +167.19% | RSI: 68.5 | % above MA200: +75.0% | Trend: Above MA20, MA50, MA200
Hewlett Packard Enterprise Co provides enterprise-grade hardware and software solutions. Investors should focus on the company's ability to capture infrastructure demand, as evidenced by a 167.2% return over the 2026 YTD period.
Strong bullish momentum is evident with price > MA20 > MA50 > MA200. The stock is 0.0% below its 2026 YTD high, signaling a potential breakout. An RSI(14) of 68.5 confirms high buying pressure at the current price of $68.48.
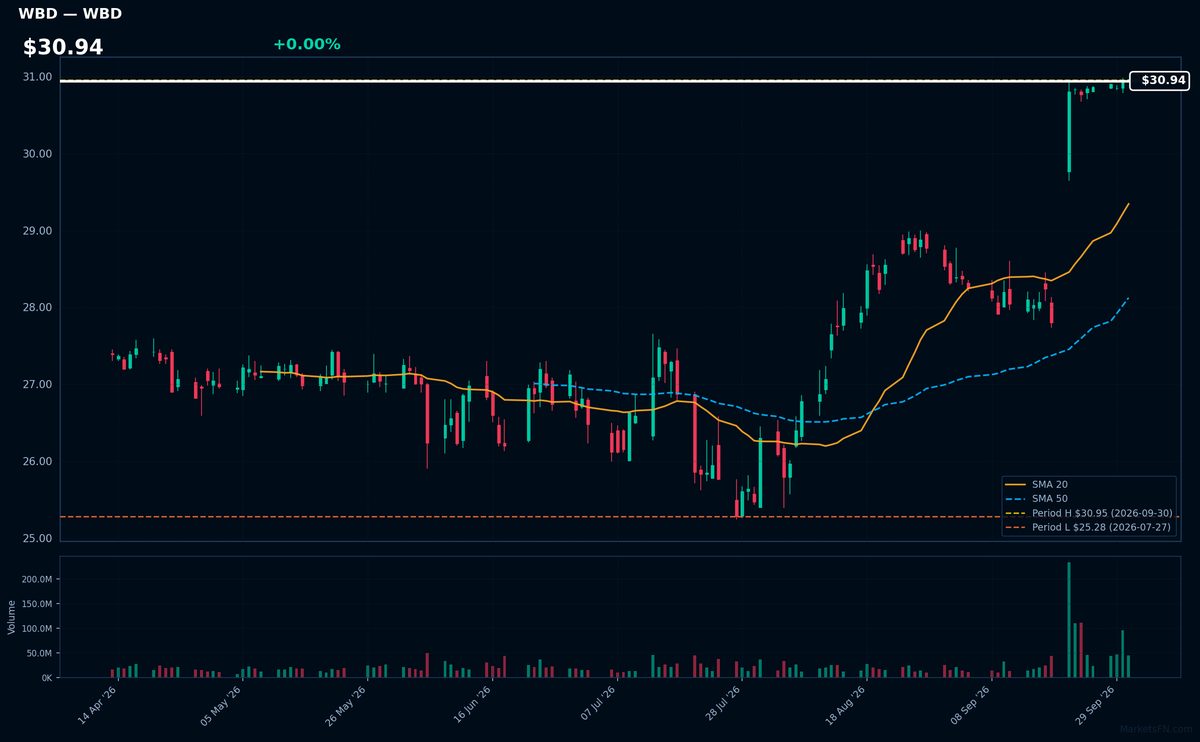
WBD | Warner Bros. Discovery Inc | Communication Services | Price Last: $30.95 | % Realized: +8.56% | RSI: 75.1 | % above MA200: +11.8% | Trend: Above MA20, MA50, MA200
Warner Bros. Discovery Inc operates as a global media and entertainment powerhouse, controlling a vast portfolio of cinematic franchises, television networks, and streaming services. Investors should care about its ability to monetize premium content across diverse distribution channels to drive scale in a competitive streaming landscape.
The stock shows strong momentum with a bullish MA alignment (price > MA20 > MA50 > MA200) and an 8.6% 2026 YTD return. However, an RSI(14) of 75.1 suggests overbought conditions as the price sits 0.0% below its 2026 YTD high.
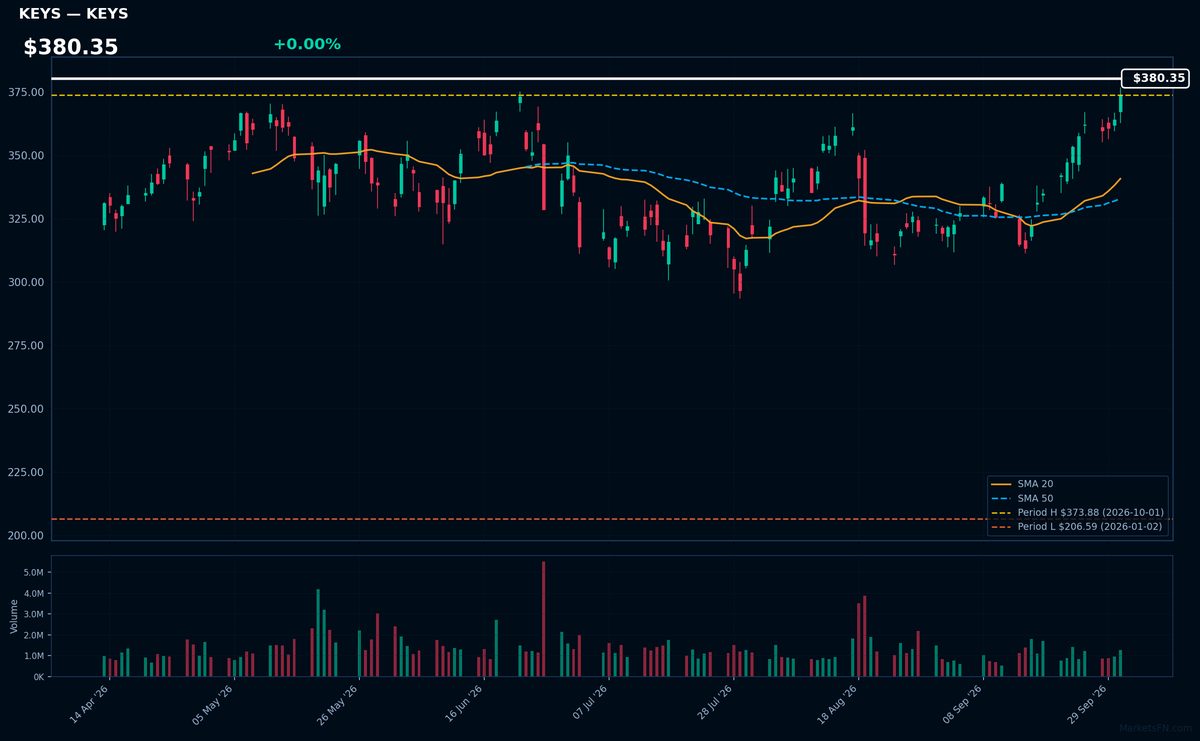
KEYS | Keysight Technologies Inc | Technology | Price Last: $373.88 | % Realized: +80.98% | RSI: 72.7 | % above MA200: +23.6% | Trend: Above MA20, MA50, MA200
Keysight Technologies Inc is a test and measurement equipment provider for electronics design and manufacturing. Investors should care because its tools are crucial for semiconductor, aerospace, and automotive industries, making its performance indicative of these sectors' health.
Keysight's current technical situation indicates strong momentum: RSI(14) is 72.7, nearing overbought territory, with a bullish MA alignment (price > MA20 > MA50 > MA200) and 0.0% below its 2026 YTD high, suggesting a potential breakout.
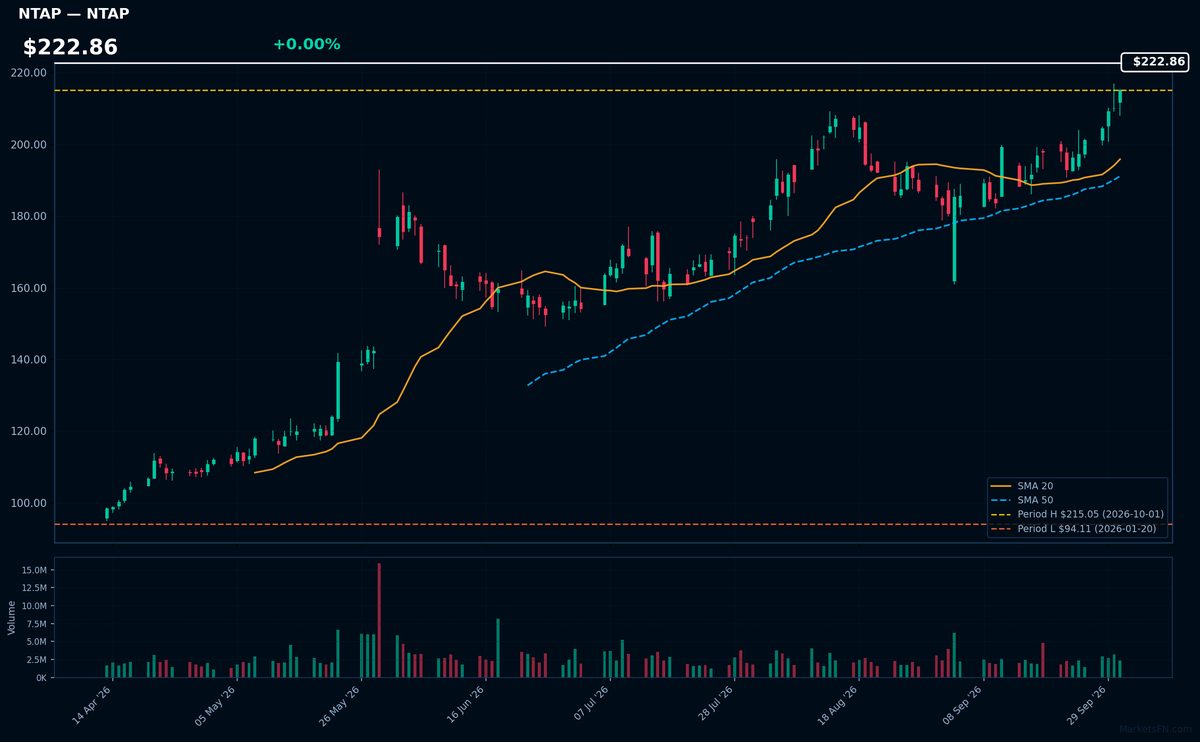
NTAP | Netapp Inc | Technology | Price Last: $215.05 | % Realized: +101.98% | RSI: 74.4 | % above MA200: +55.0% | Trend: Above MA20, MA50, MA200
Netapp Inc provides data storage and management solutions. Investors should care as the company is currently experiencing significant growth, evidenced by a 102.0% return over the 2026 YTD period.
The stock shows strong momentum with a bullish MA alignment (price > MA20 > MA50 > MA200). While it is 0.0% below its 2026 YTD high, an RSI(14) of 74.4 suggests it is approaching overbought territory.
📉 Nearest to 2026 Low
Sectors represented: Consumer Cyclical (3), Communication Services (1), Consumer Defensive (1)
| Ticker | Company | Sector | Price Last | % Realized | 2026 YTD Low Date | RSI | % above MA200 | Trend |
|---|---|---|---|---|---|---|---|---|
| HD | Home Depot, Inc | Consumer Cyclical | $282.46 | -18.32% | 2026-10-01 | 29.4 | -16.7% | Below MA20, MA50, MA200 |
| TMUS | T-Mobile US Inc | Communication Services | $161.73 | -18.96% | 2026-10-01 | 33.4 | -15.4% | Below MA20, MA50, MA200 |
| PEP | PepsiCo Inc | Consumer Defensive | $125.60 | -11.69% | 2026-10-01 | 24.9 | -14.7% | Below MA20, MA50, MA200 |
| LOW | Lowe's Cos., Inc | Consumer Cyclical | $182.38 | -26.13% | 2026-10-01 | 30.3 | -21.3% | Below MA20, MA50, MA200 |
| NKE | Nike, Inc | Consumer Cyclical | $35.15 | -44.45% | 2026-10-01 | 25.4 | -27.8% | Below MA20, MA50, MA200 |
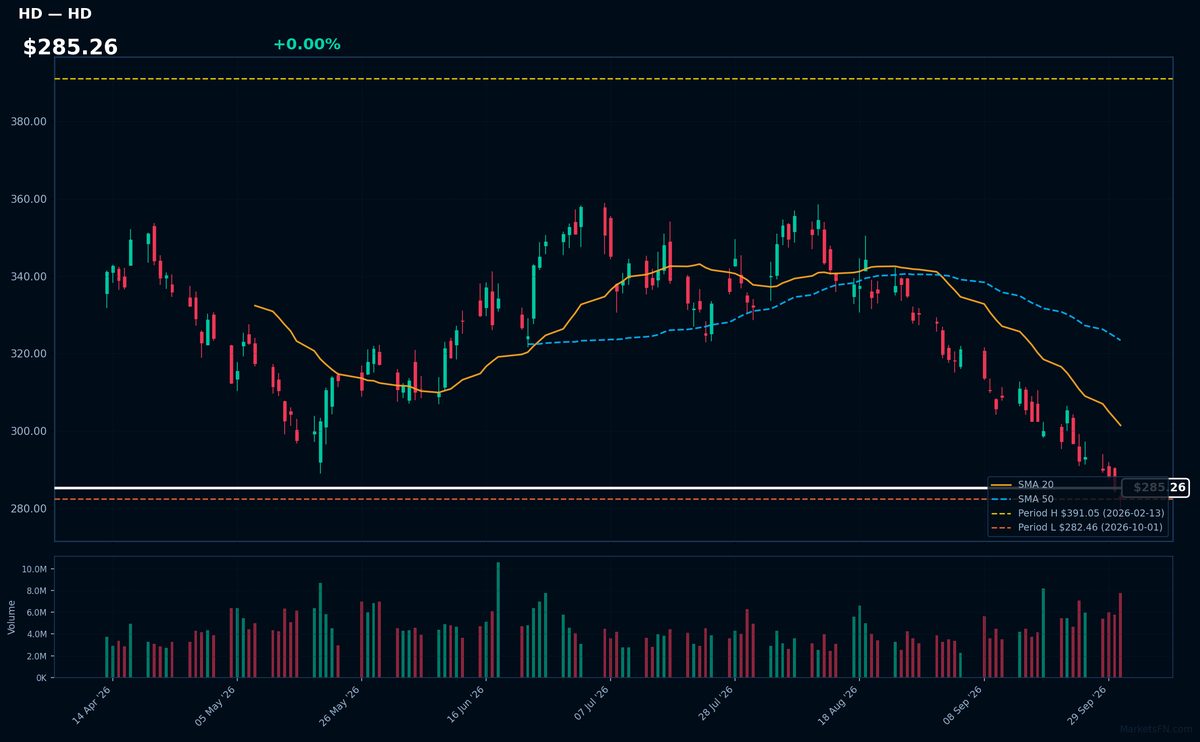
HD | Home Depot, Inc | Consumer Cyclical | Price Last: $282.46 | % Realized: -18.32% | RSI: 29.4 | % above MA200: -16.7% | Trend: Below MA20, MA50, MA200
Home Depot, Inc is a leading home improvement retailer providing tools, construction products, and services. Investors should care as it serves as a primary bellwether for residential construction trends and consumer discretionary spending on home maintenance.
The technicals signal a warning sign. HD is in a sustained downtrend with bearish MA alignment (price < MA20 < MA50 < MA200) and an RSI(14) of 29.4. With a -18.3% 2026 YTD return, the stock is testing major support at 0.0% above its 2026 YTD low.
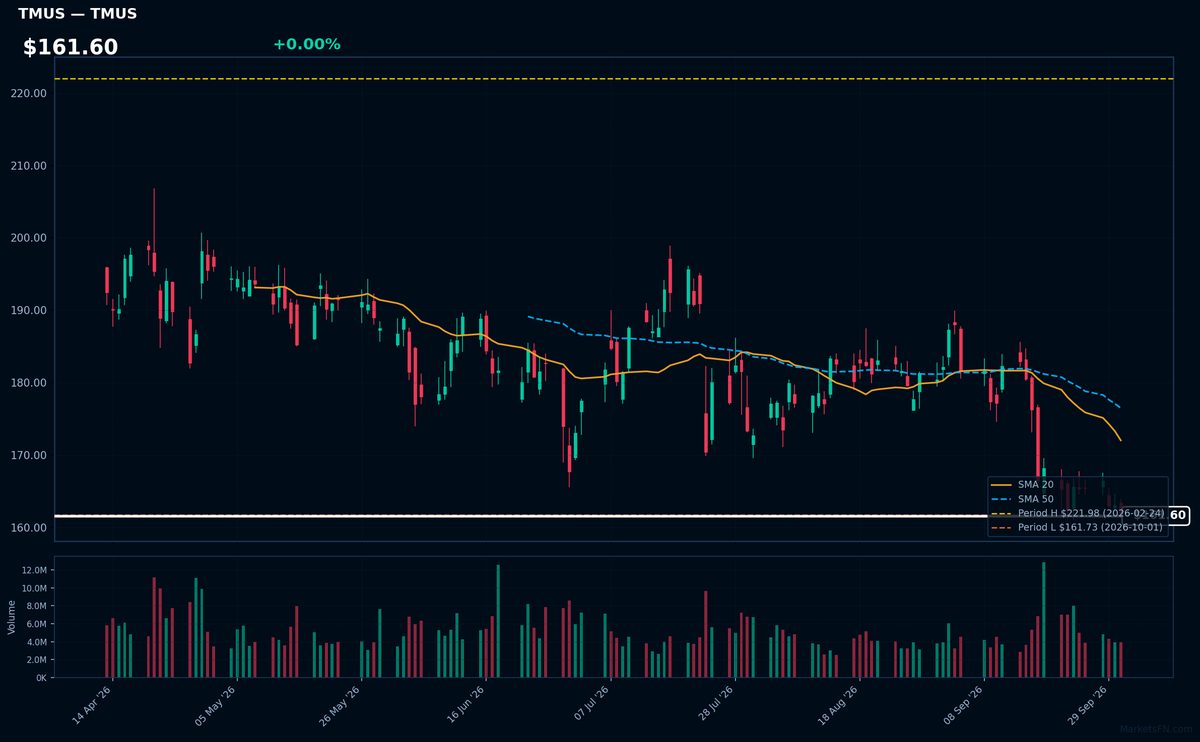
TMUS | T-Mobile US Inc | Communication Services | Price Last: $161.73 | % Realized: -18.96% | RSI: 33.4 | % above MA200: -15.4% | Trend: Below MA20, MA50, MA200
T-Mobile US Inc is a wireless carrier providing mobile voice and data services. Investors should care as it competes for market share in the critical telecommunications infrastructure sector, impacting connectivity and digital access across the US.
The technicals signal a warning sign. TMUS is in a sustained downtrend with bearish MA alignment (price < MA20 < MA50 < MA200) and an RSI(14) of 33.4. The stock is 0.0% above its 2026 YTD low, following a -19.0% return over that period.
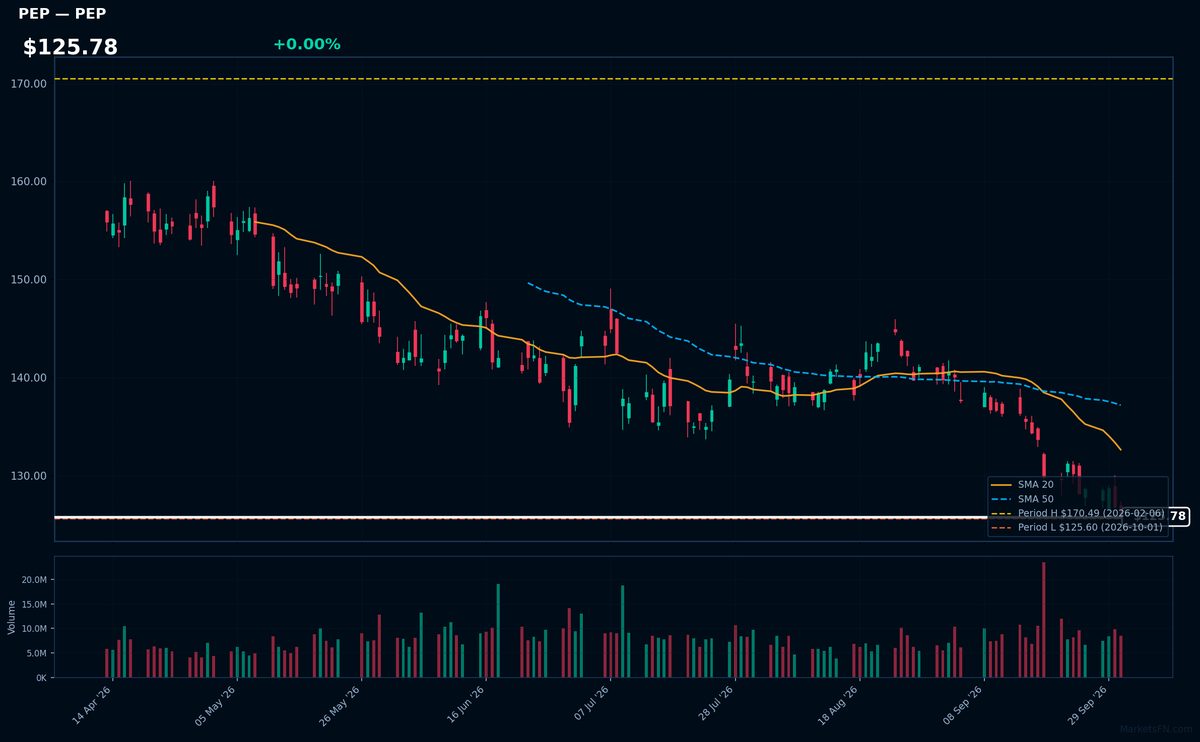
PEP | PepsiCo Inc | Consumer Defensive | Price Last: $125.60 | % Realized: -11.69% | RSI: 24.9 | % above MA200: -14.7% | Trend: Below MA20, MA50, MA200
PepsiCo Inc is a global leader in convenient snacks and beverages. Investors should care because the company manages a diversified portfolio of powerhouse brands that drive consistent consumer demand across multiple categories and global markets.
The technicals signal a warning sign. Price is in a sustained downtrend with a bearish MA alignment (price < MA20 < MA50 < MA200). With an RSI(14) of 24.9 and a -11.7% 2026 YTD return, the stock is testing major support at 0.0% above its 2026 YTD low.
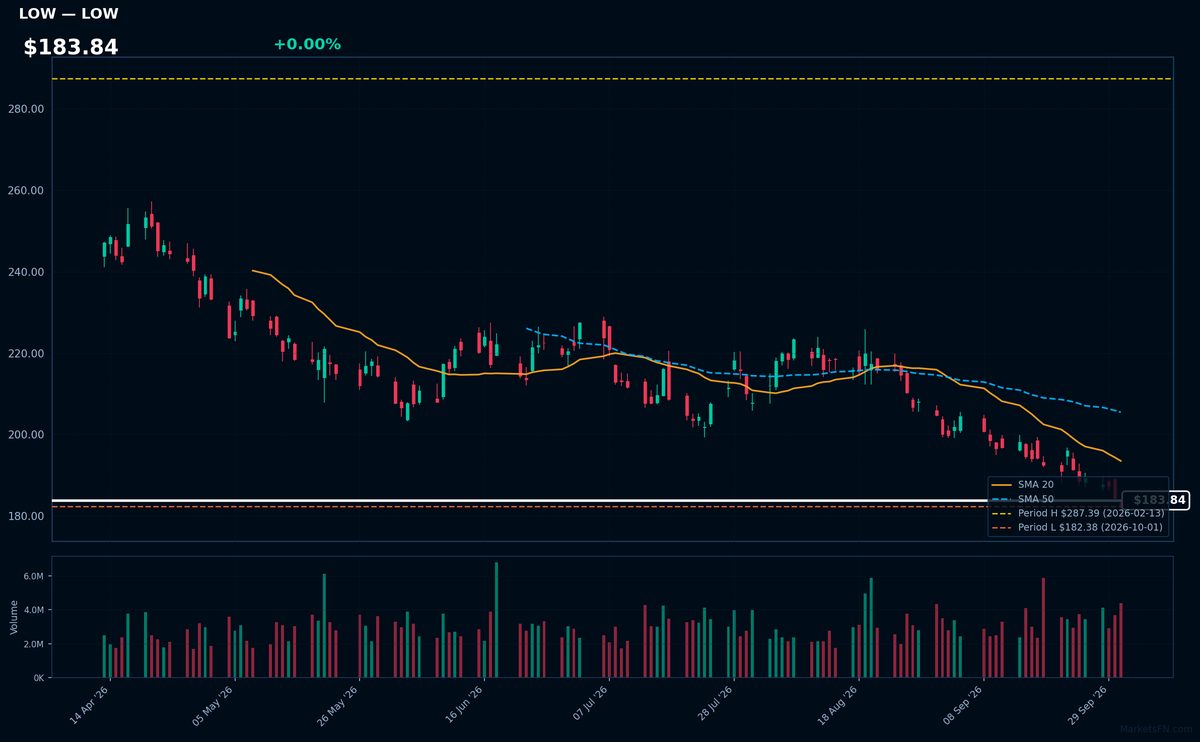
LOW | Lowe's Cos., Inc | Consumer Cyclical | Price Last: $182.38 | % Realized: -26.13% | RSI: 30.3 | % above MA200: -21.3% | Trend: Below MA20, MA50, MA200
Lowe's Cos., Inc operates as a major home improvement retailer. Investors should monitor the stock as a bellwether for consumer discretionary spending on home renovation and the broader health of the residential housing market.
Technicals signal a warning sign. The stock is in a sustained downtrend with bearish MA alignment (price < MA20 < MA50 < MA200) and an RSI(14) of 30.3. With a -26.1% 2026 YTD return, it is testing major support at 0.0% above its 2026 YTD low.
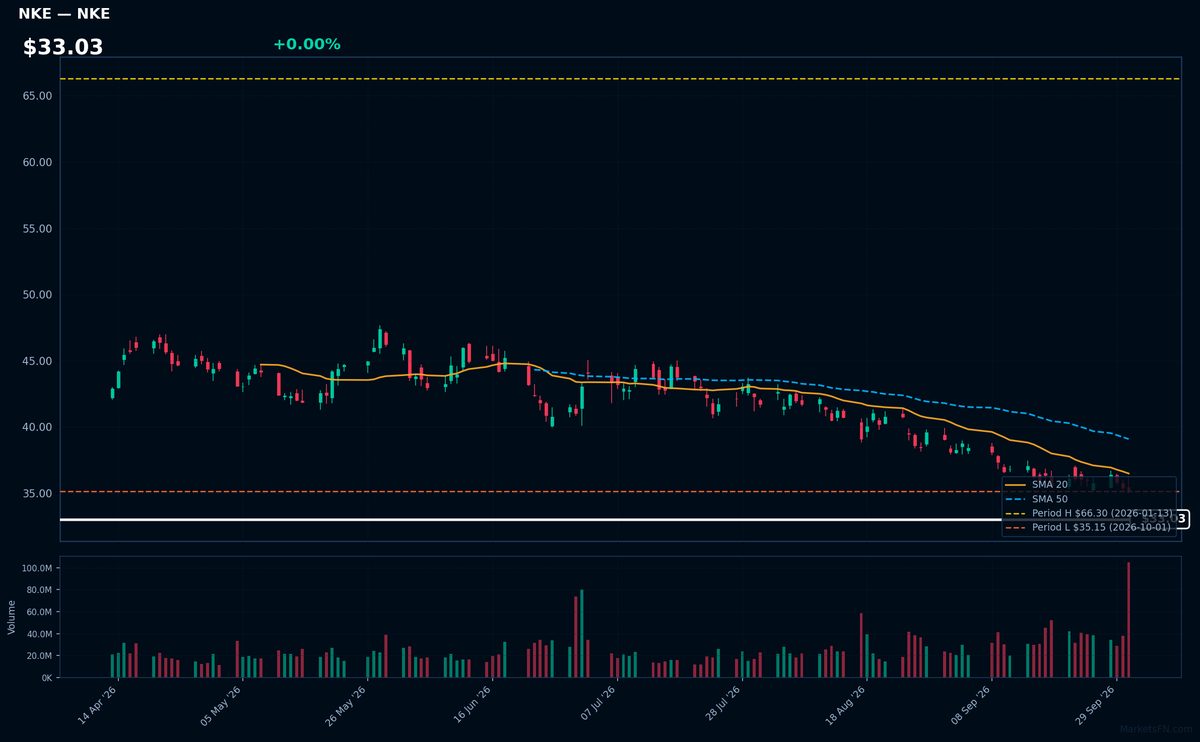
NKE | Nike, Inc | Consumer Cyclical | Price Last: $35.15 | % Realized: -44.45% | RSI: 25.4 | % above MA200: -27.8% | Trend: Below MA20, MA50, MA200
Nike, Inc designs and markets athletic footwear, apparel, and equipment. Investors care because it is a global leader in sports branding, though it is currently facing significant price pressure and a sustained downtrend in its market valuation.
The technicals signal a warning sign. With an RSI(14) of 25.4 and a bearish MA alignment (price < MA20 < MA50 < MA200), the stock is in a sustained downtrend, down -44.5% over the 2026 YTD period and testing major support.
Market Commentary
The S&P 500 stocks listed are near their 2026 year-to-date (YTD) extremes, with some at their highs and others at their lows. Stocks like CRWD, HPE, WBD, KEYS, and NTAP are at their 2026 YTD highs, having not deviated from these levels at all. Conversely, HD, TMUS, PEP, LOW, and NKE are at their 2026 YTD lows, having rebounded by +0.0% from these lows.
The stocks near their 2026 YTD highs are primarily from the technology and communications sectors, indicating strong performance in these areas. In contrast, the stocks near their 2026 YTD lows are from the consumer staples and discretionary sectors, suggesting challenges in these segments. This divergence may reflect varying market conditions and sector-specific themes.
Investors should monitor these stocks for any deviation from their current extremes and watch for broader market trends that may influence their trajectories. As the year progresses, changes in the relative performance of these stocks could provide insights into shifting sector dynamics and overall market sentiment.
Methodology: All 503 S&P 500 constituents screened. Close prices downloaded from 2026-01-01. Period high = highest close since Jan 1 2026; period low = lowest close since Jan 1 2026. Distance = (current price / period extreme − 1) × 100. Technical indicators computed on up to 1 year of daily OHLCV data.
Disclaimer: For informational purposes only. Not investment advice. Past performance is not indicative of future results.

