S&P 500 2026 YTD Highs & Lows Radar: Coca-Cola (KO), Walmart (WMT) and more
MarketsFN Team

S&P 500 2026 YTD Highs & Lows Radar: Coca-Cola (KO), Walmart (WMT) and more
Screening all 503 S&P 500 constituents for stocks nearest to their 2026 year-to-date high and their 2026 YTD low. Data as of August 21, 2026. % Realized = total return since Jan 1 2026.
Legend: RSI > 70 = overbought · RSI < 30 = oversold · Green % Realized = positive YTD return · Red = negative.
📈 Nearest to 2026 High
Sectors represented: Energy (2), Consumer Defensive (1), Technology (1), Financial (1)
| Ticker | Company | Sector | Price Last | % Realized | 2026 YTD High Date | RSI | % above MA200 | Trend |
|---|---|---|---|---|---|---|---|---|
| KO | Coca-Cola Co | Consumer Defensive | $90.50 | +30.93% | 2026-08-20 | 68.2 | +16.8% | Above MA20, MA50, MA200 |
| ADP | Automatic Data Processing Inc | Technology | $279.21 | +10.41% | 2026-08-20 | 64.4 | +18.5% | Above MA20, MA50, MA200 |
| COP | Conoco Phillips | Energy | $134.89 | +39.49% | 2026-08-20 | 74.9 | +22.1% | Above MA20, MA50, MA200 |
| EOG | EOG Resources, Inc | Energy | $152.19 | +41.88% | 2026-08-20 | 65.6 | +20.1% | Above MA20, MA50, MA200 |
| PYPL | PayPal Holdings Inc | Financial | $62.30 | +7.16% | 2026-08-20 | 71.5 | +21.1% | Above MA20, MA50, MA200 |
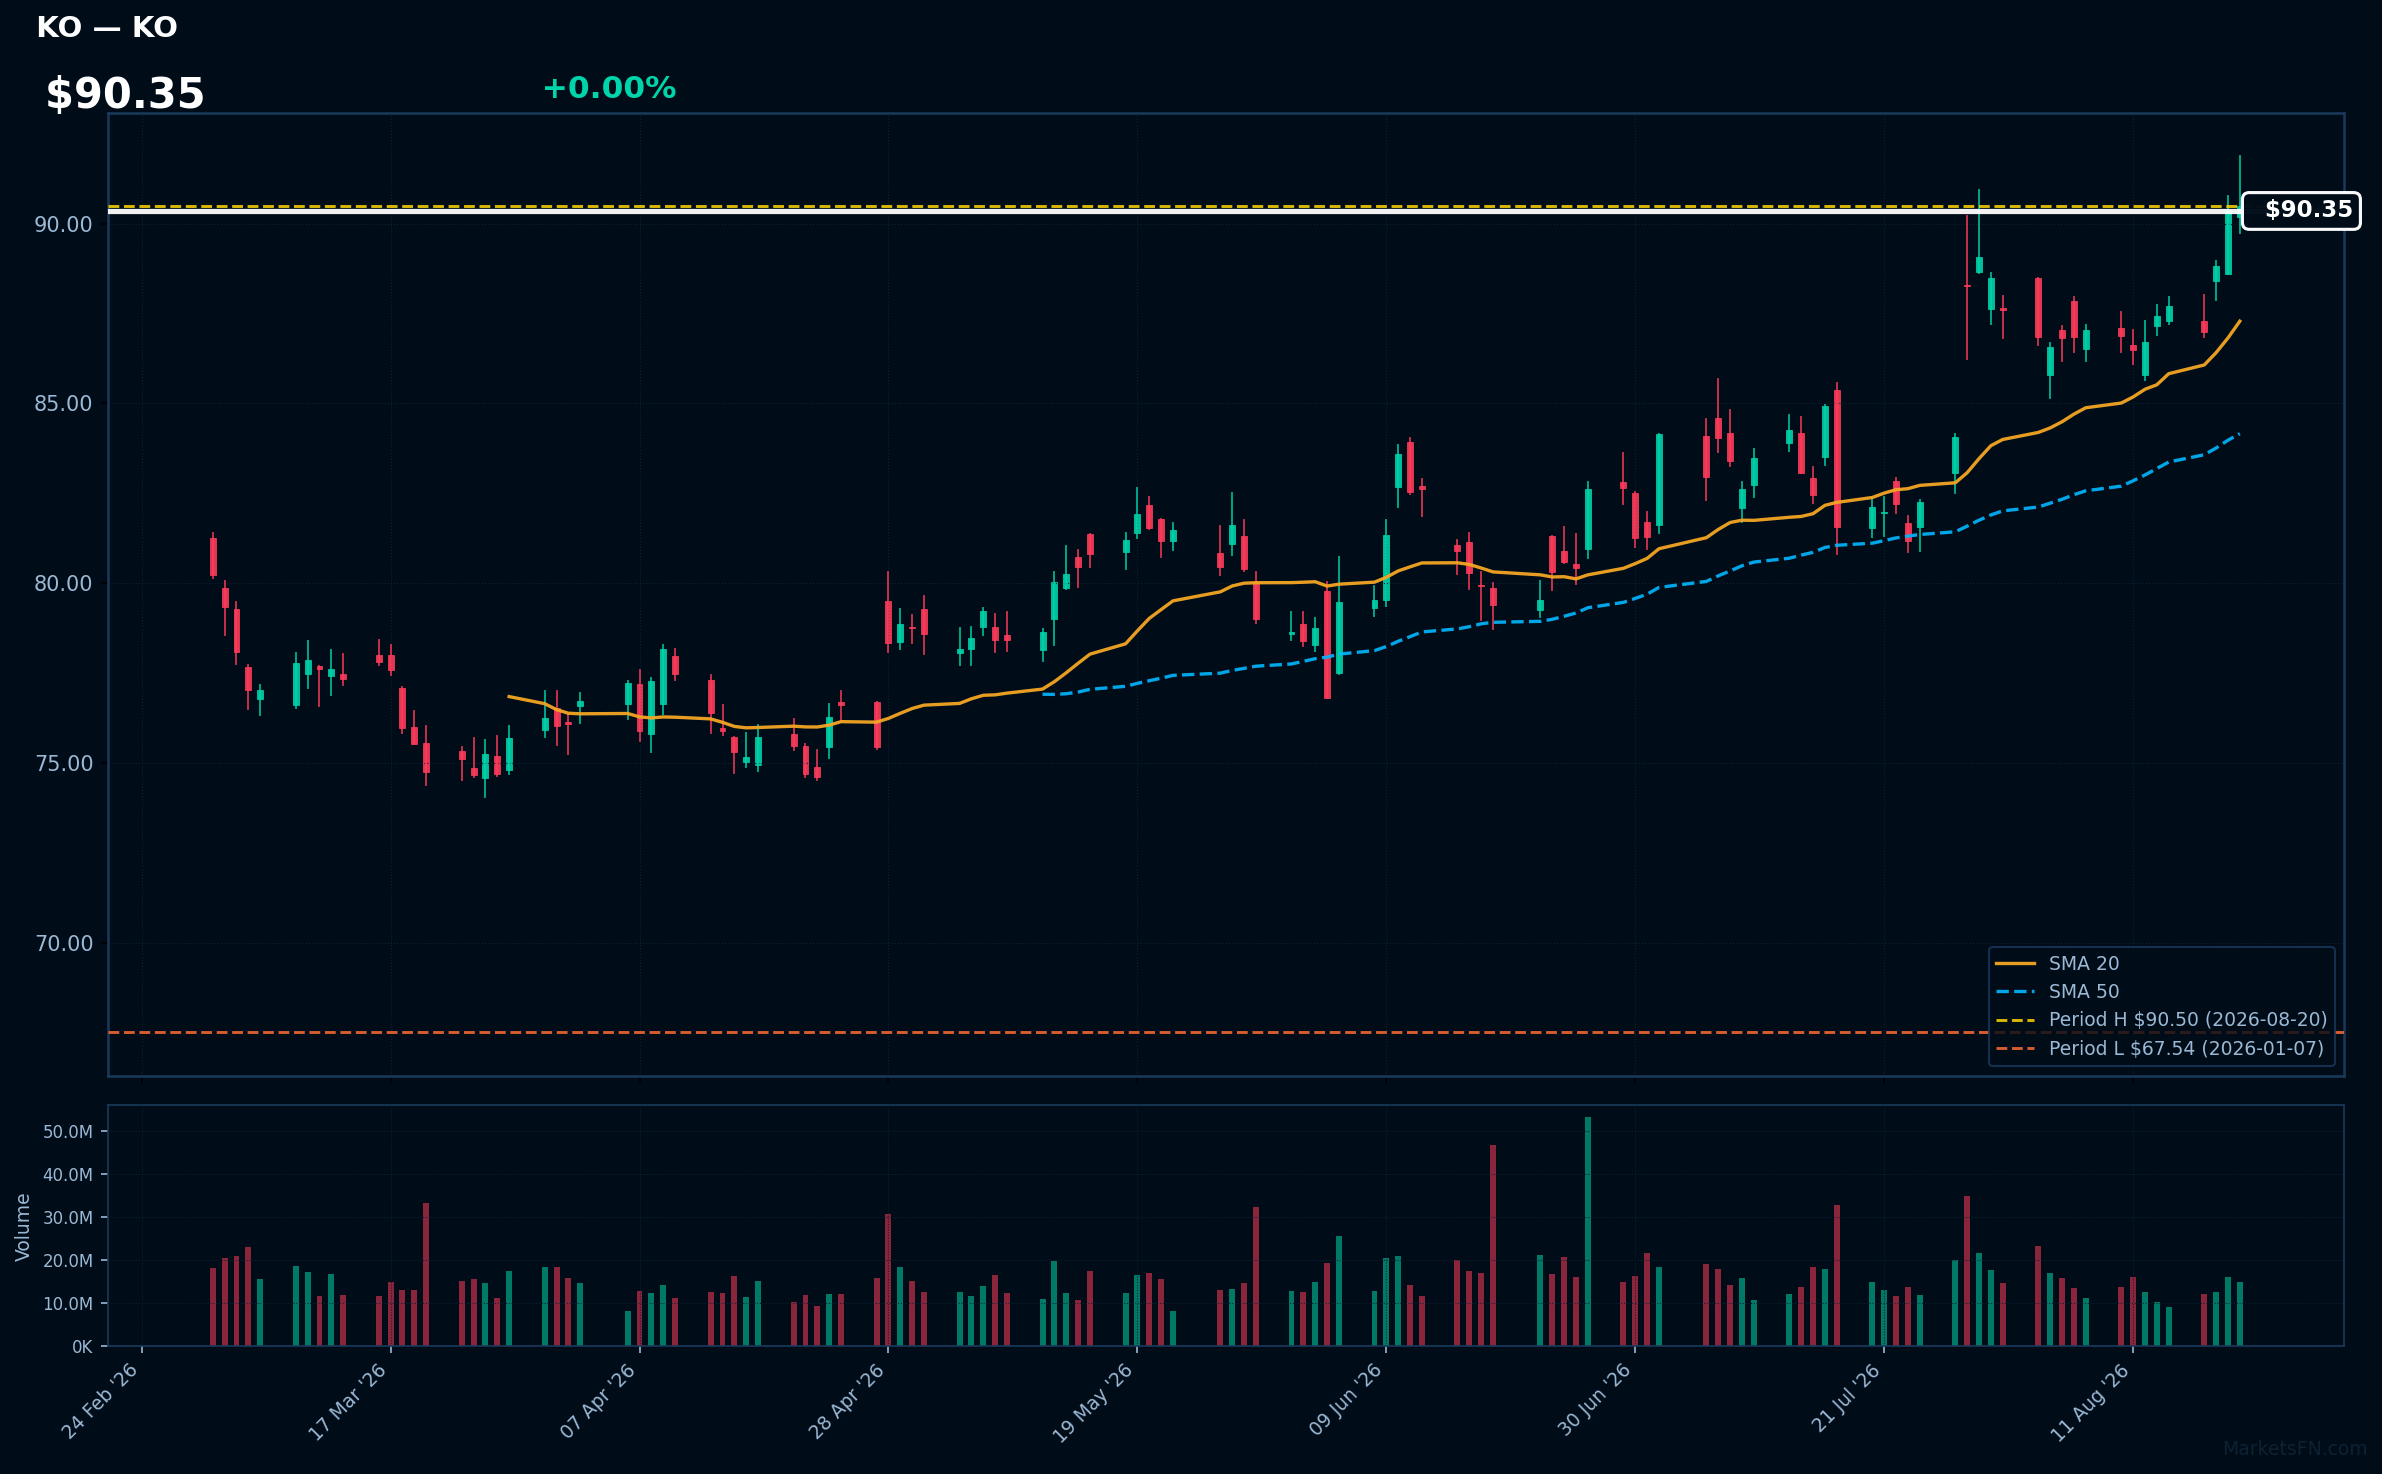
KO | Coca-Cola Co | Consumer Defensive | Price Last: $90.50 | % Realized: +30.93% | RSI: 68.2 | % above MA200: +16.8% | Trend: Above MA20, MA50, MA200
Coca-Cola Co (KO) is a leading beverage company, known for its extensive portfolio of non-alcoholic drinks, including soft drinks, juices, and bottled water. Investors should care due to its strong brand equity and consistent demand, which drive revenue stability and growth potential.
The current technical situation indicates bullish momentum, with an RSI(14) of 68.2 and a bullish MA alignment: price > MA20 > MA50 > MA200. The stock is also 0.0% below its 2026 YTD high, suggesting a potential breakout.
Related headlines
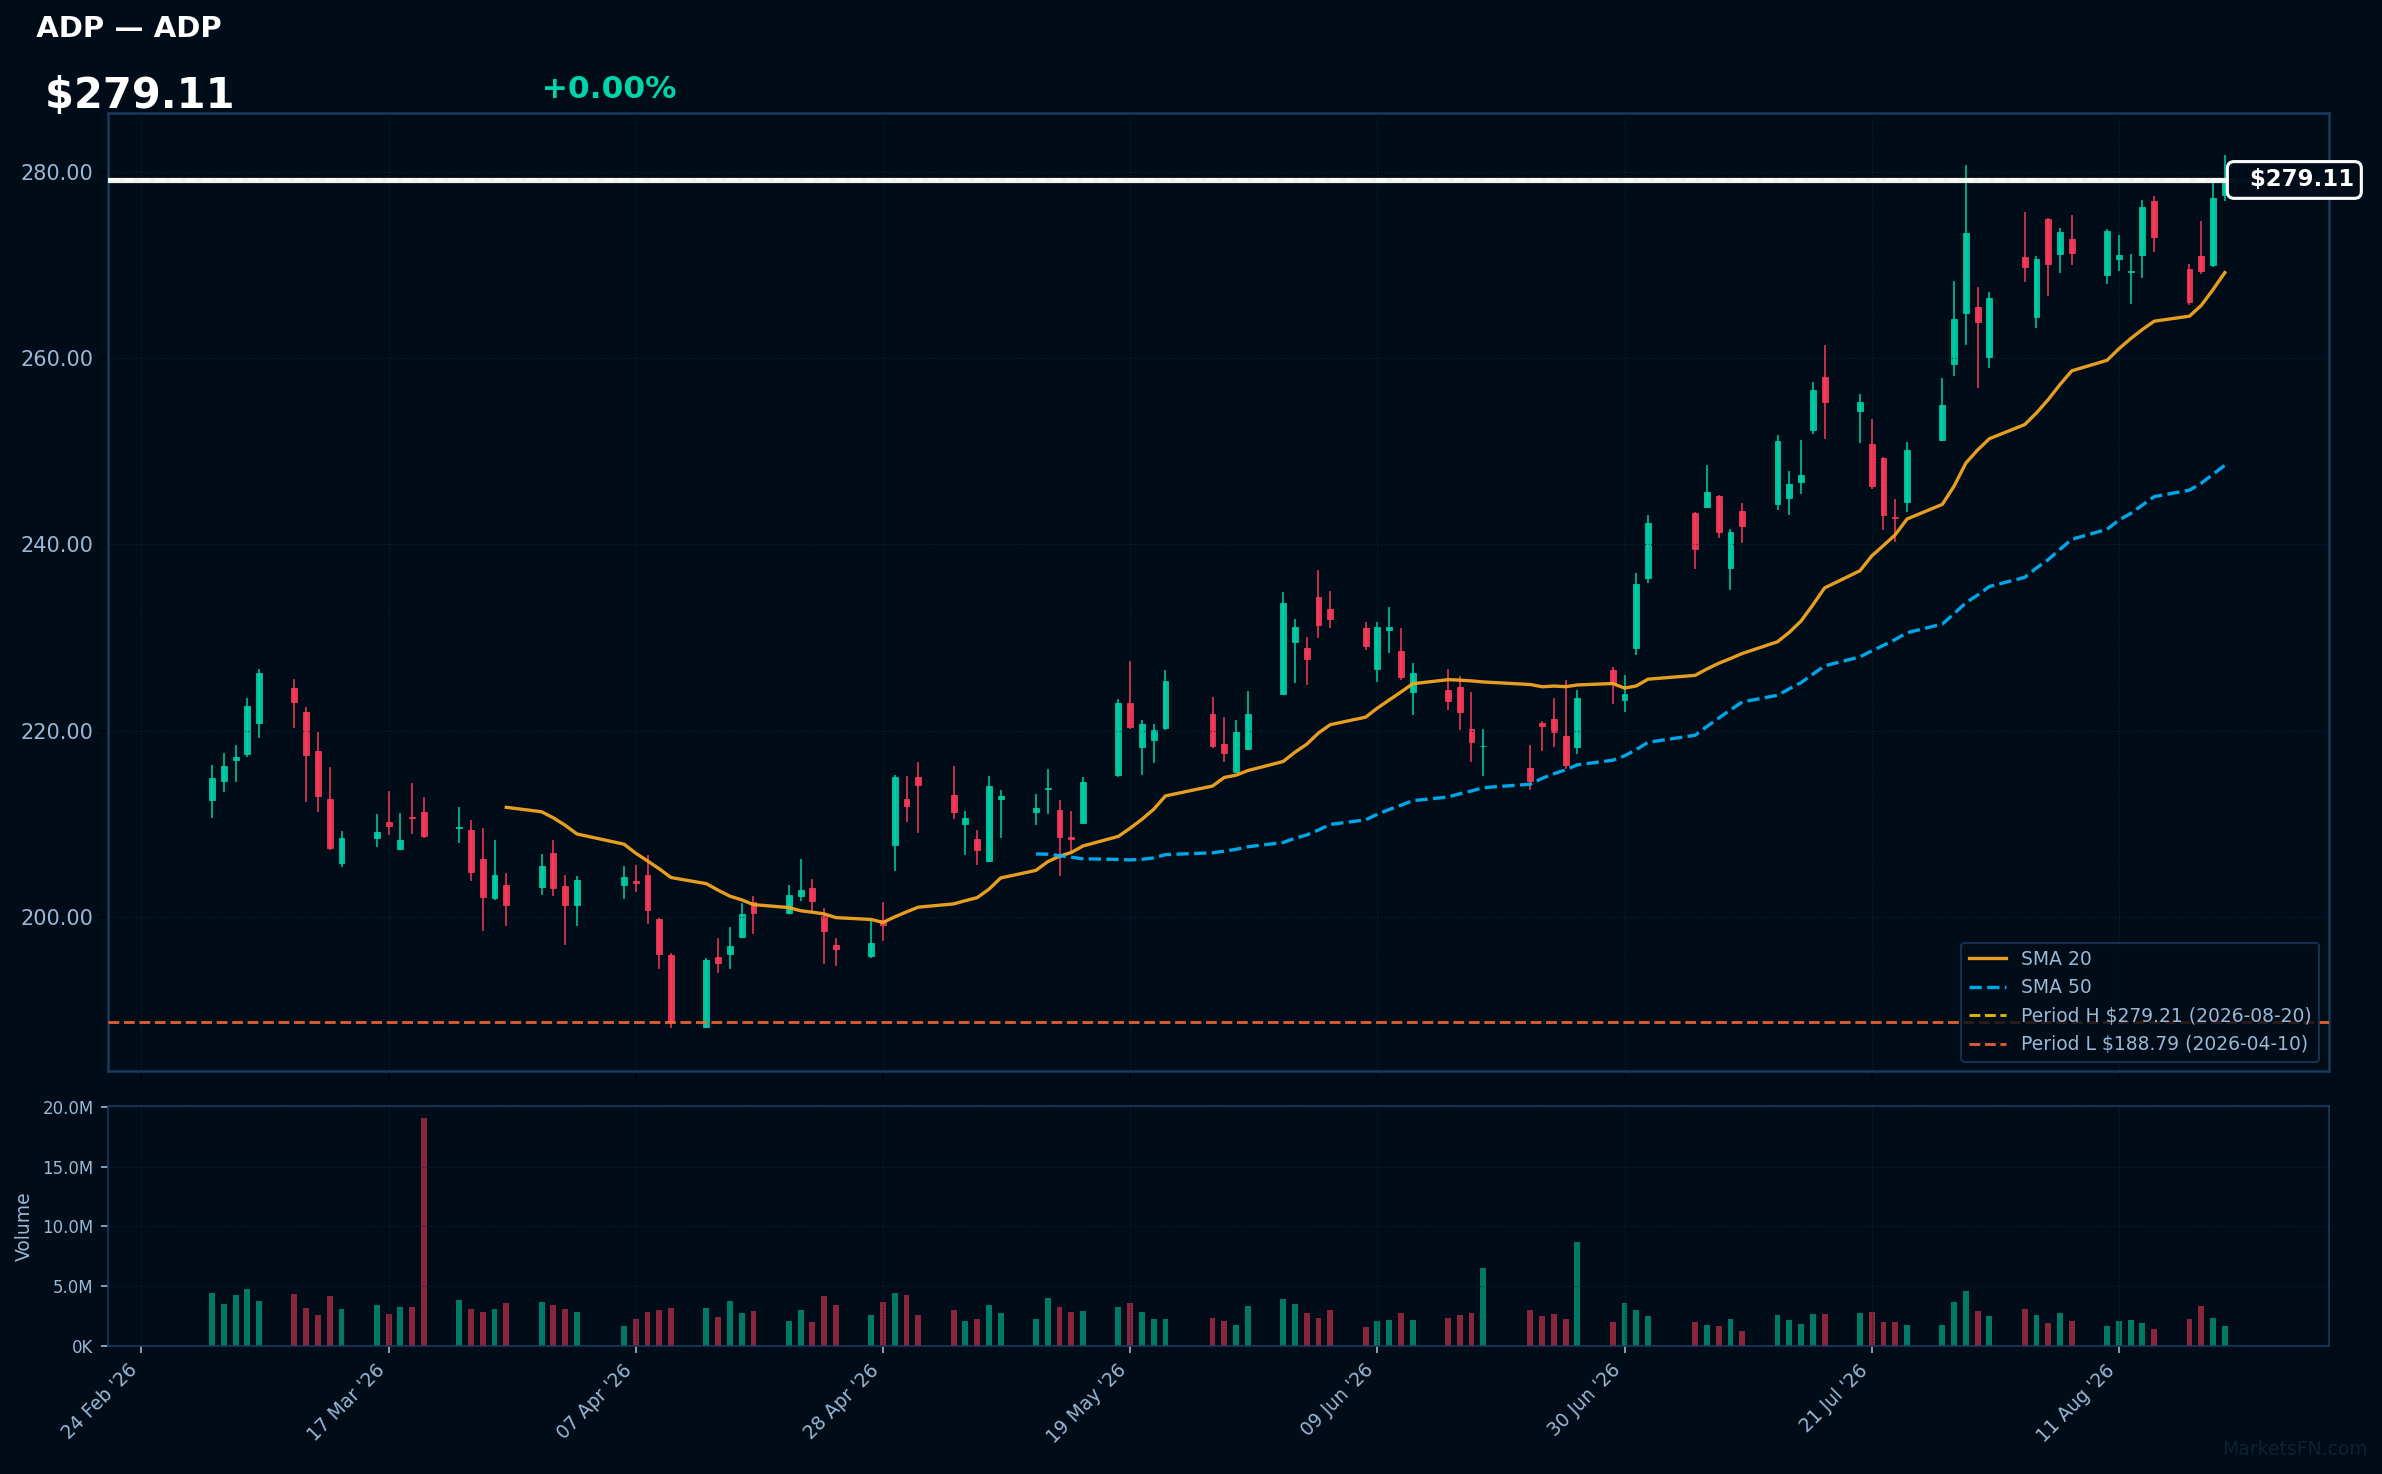
ADP | Automatic Data Processing Inc | Technology | Price Last: $279.21 | % Realized: +10.41% | RSI: 64.4 | % above MA200: +18.5% | Trend: Above MA20, MA50, MA200
Automatic Data Processing Inc (ADP) provides payroll and human capital management solutions, helping businesses streamline workforce management and compliance. Investors should care due to its strong market position and consistent demand for its services, which can drive revenue growth and stability.
The current technical situation indicates bullish momentum, with an RSI of 64.4 and a strong MA alignment: price > MA20 > MA50 > MA200. The stock is also 0.0% below its 2026 YTD high, suggesting a potential breakout.
Related headlines
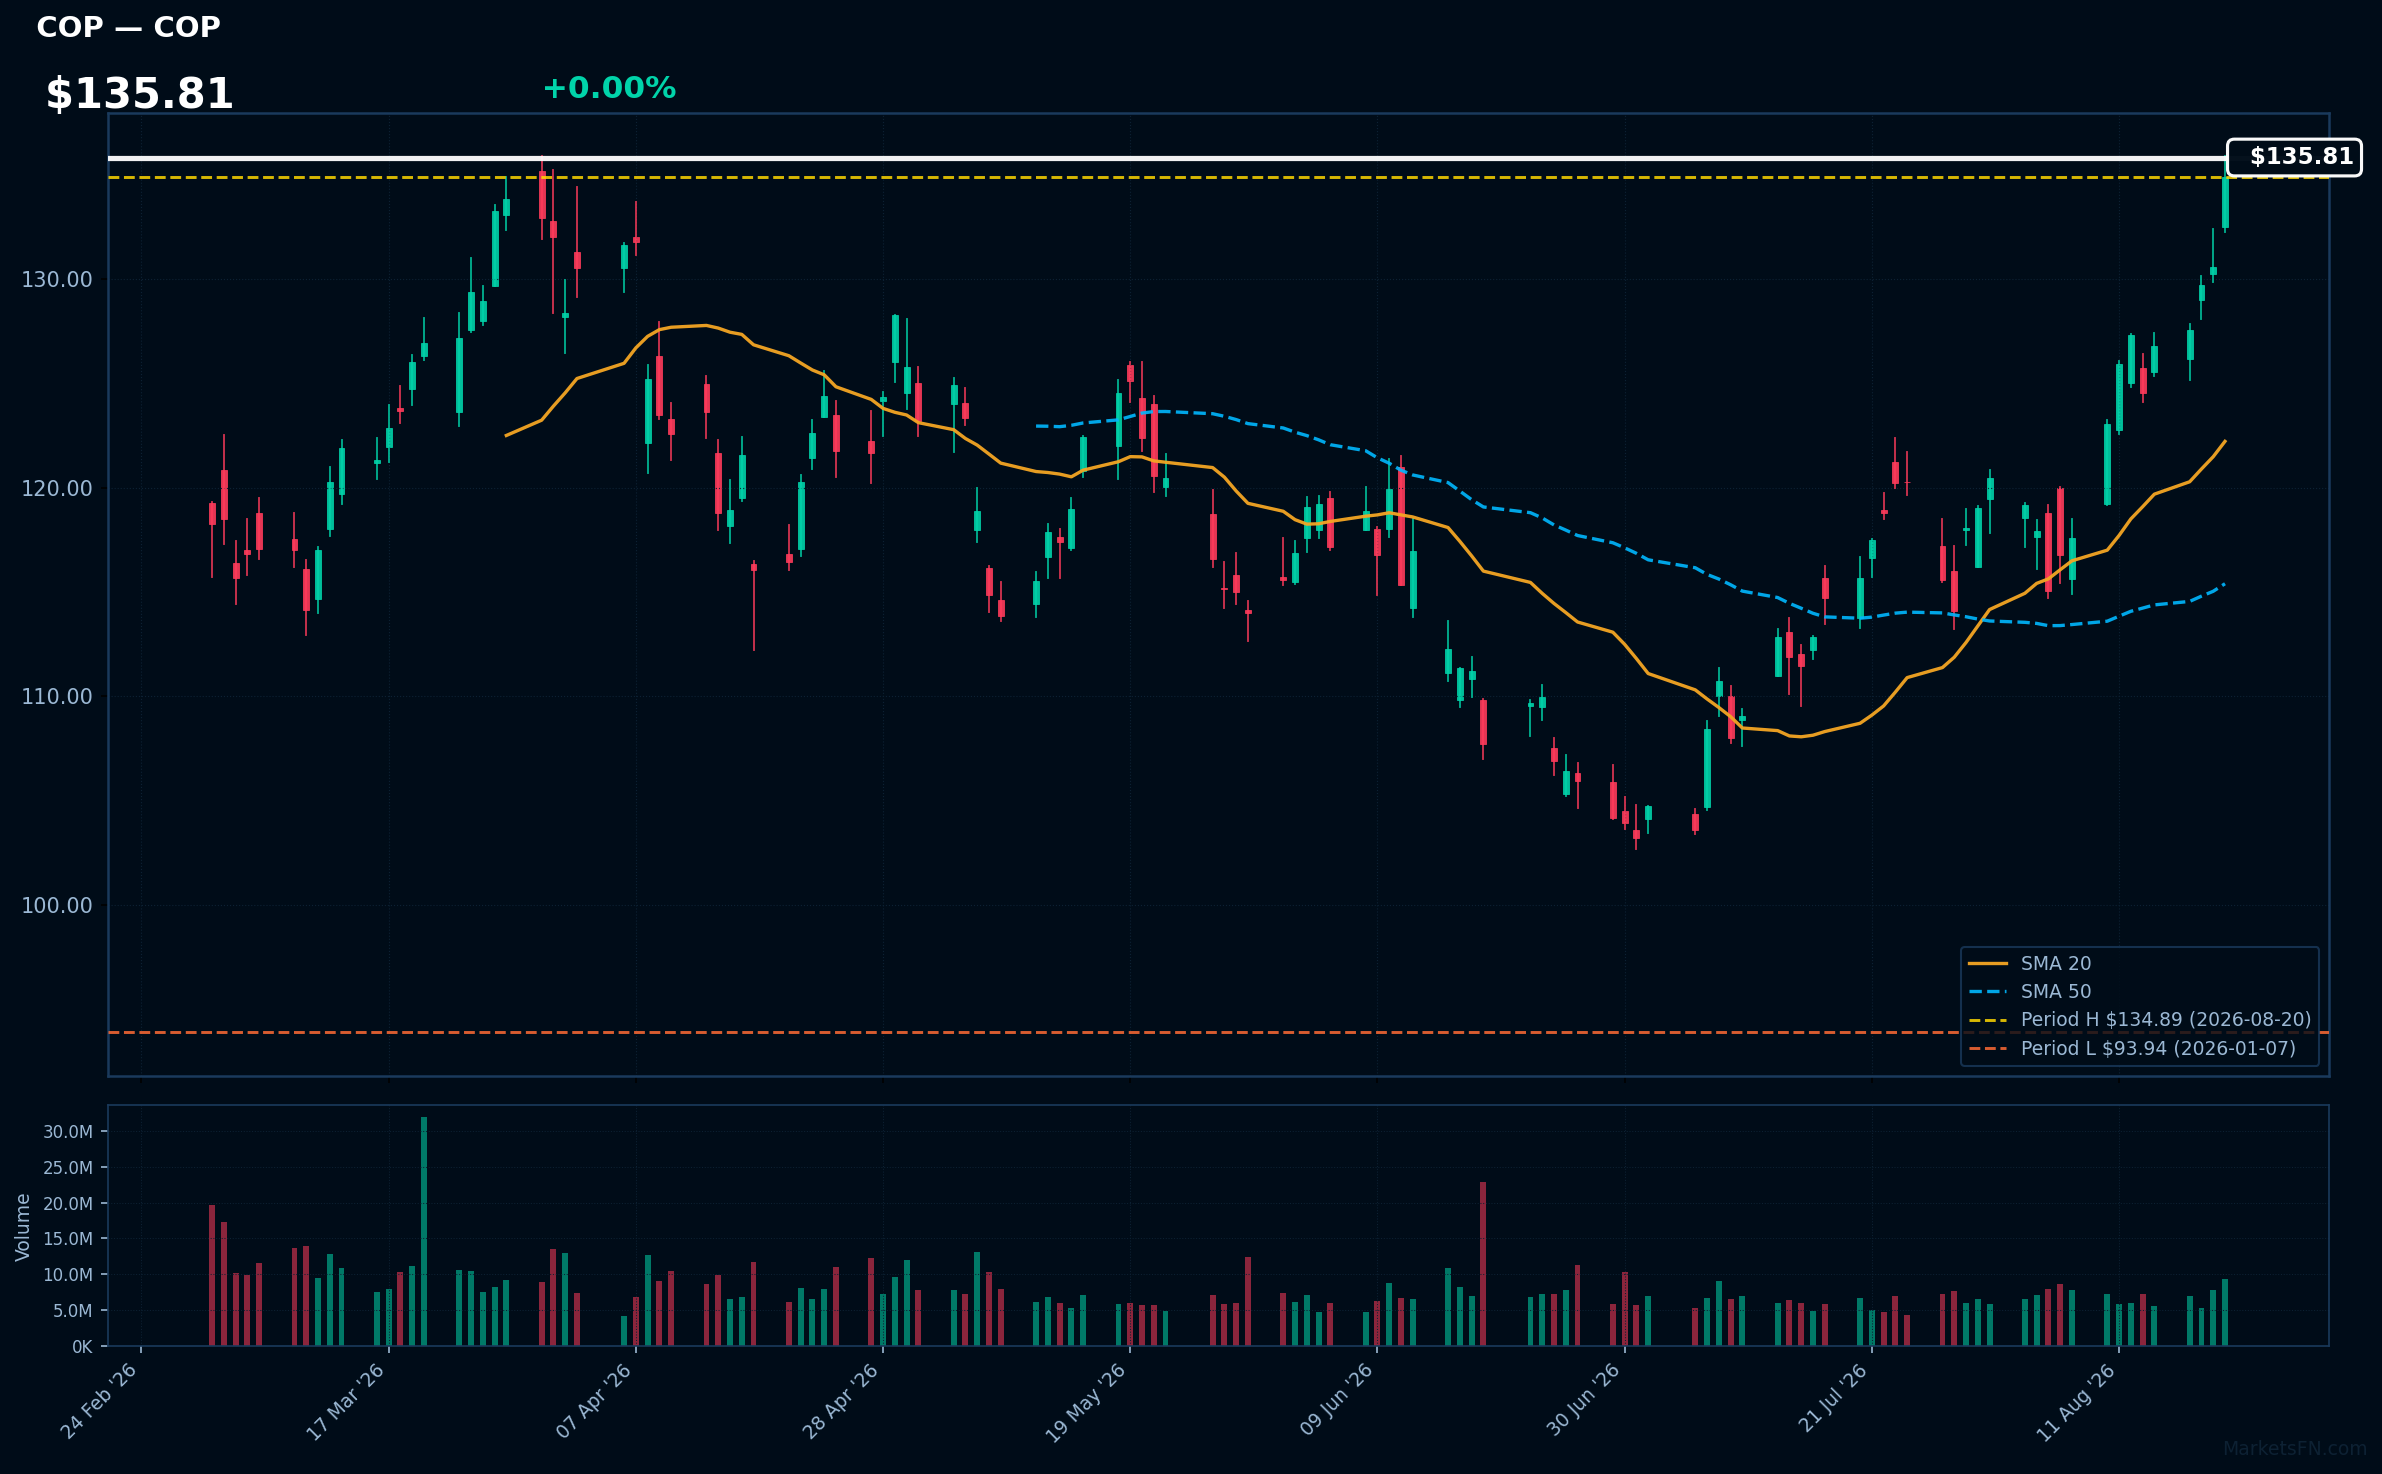
COP | Conoco Phillips | Energy | Price Last: $134.89 | % Realized: +39.49% | RSI: 74.9 | % above MA200: +22.1% | Trend: Above MA20, MA50, MA200
Conoco Phillips (COP) is a leading independent exploration and production company focused on oil and natural gas. Investors should care due to its significant role in energy markets and potential for strong returns, especially amid fluctuating commodity prices.
The current technical situation indicates strong momentum, with an RSI(14) of 74.9 and a bullish MA alignment: price > MA20 > MA50 > MA200. The stock is also 0.0% below its 2026 YTD high.
Related headlines
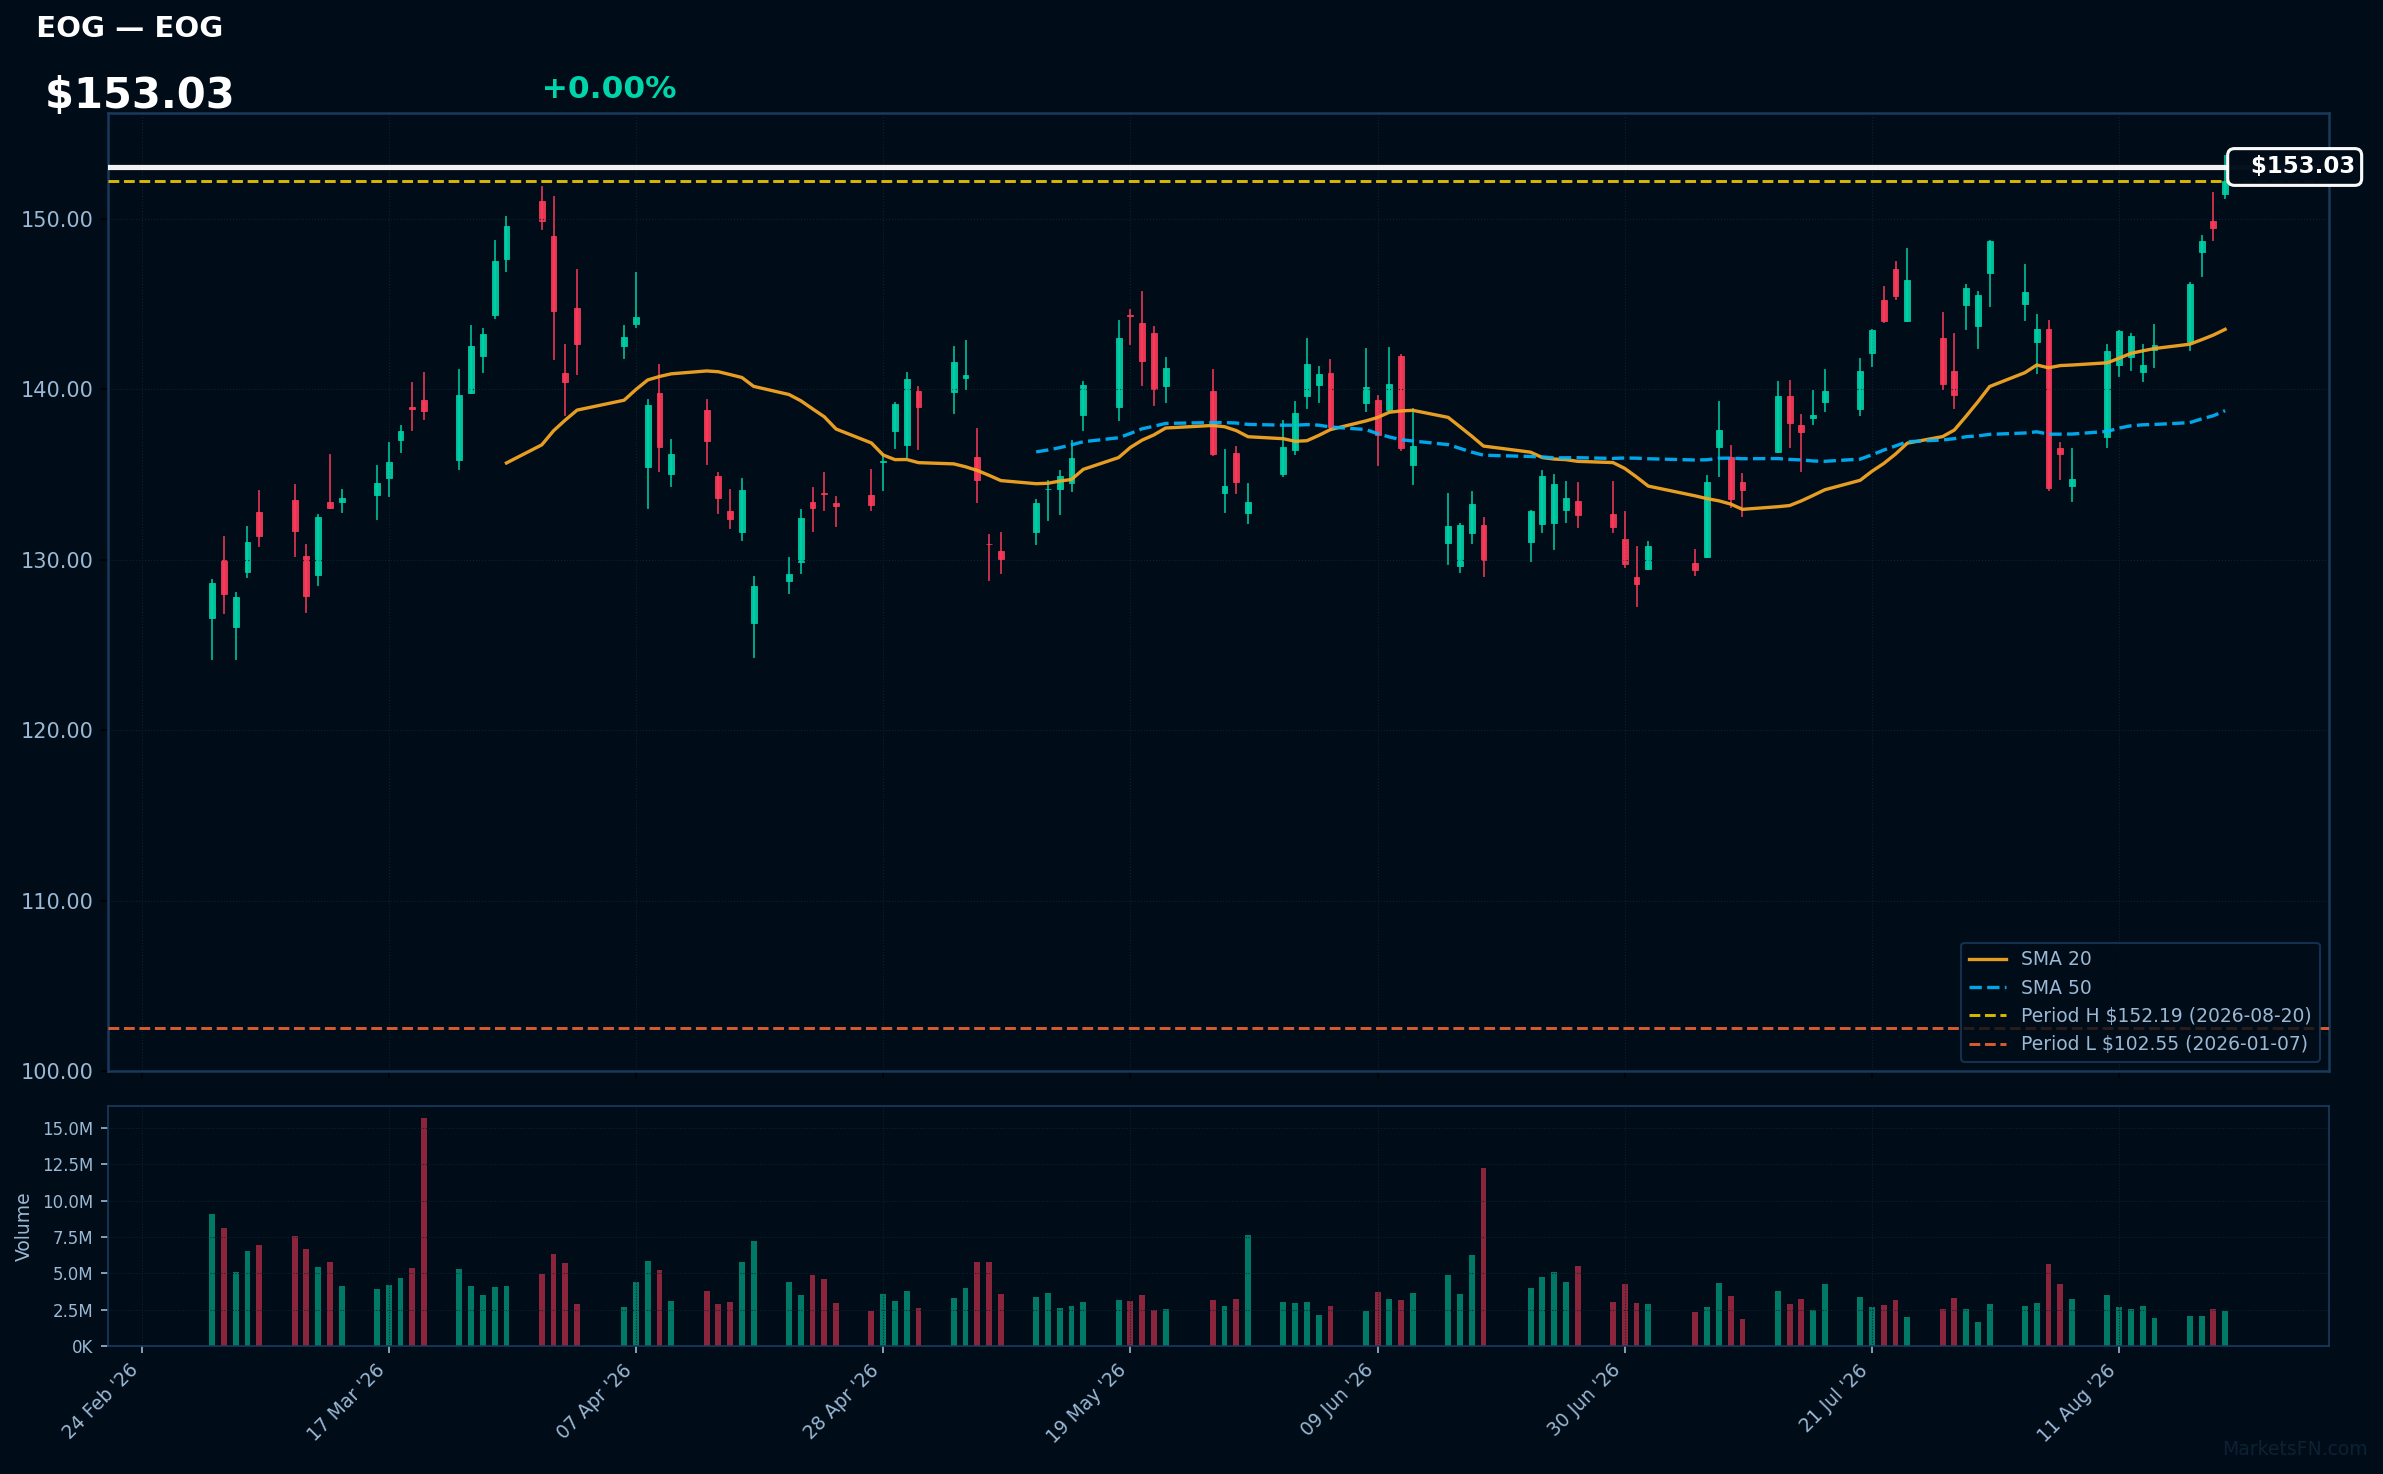
EOG | EOG Resources, Inc | Energy | Price Last: $152.19 | % Realized: +41.88% | RSI: 65.6 | % above MA200: +20.1% | Trend: Above MA20, MA50, MA200
EOG Resources, Inc. is a leading oil and natural gas exploration and production company. Investors should care due to its strong operational efficiency and significant exposure to energy markets, which can drive substantial returns amid fluctuating commodity prices.
The current technical situation shows bullish momentum with an RSI(14) of 65.6 and a bullish MA alignment: price > MA20 > MA50 > MA200. The stock is 0.0% below its 2026 YTD high, indicating potential for a breakout.
Related headlines
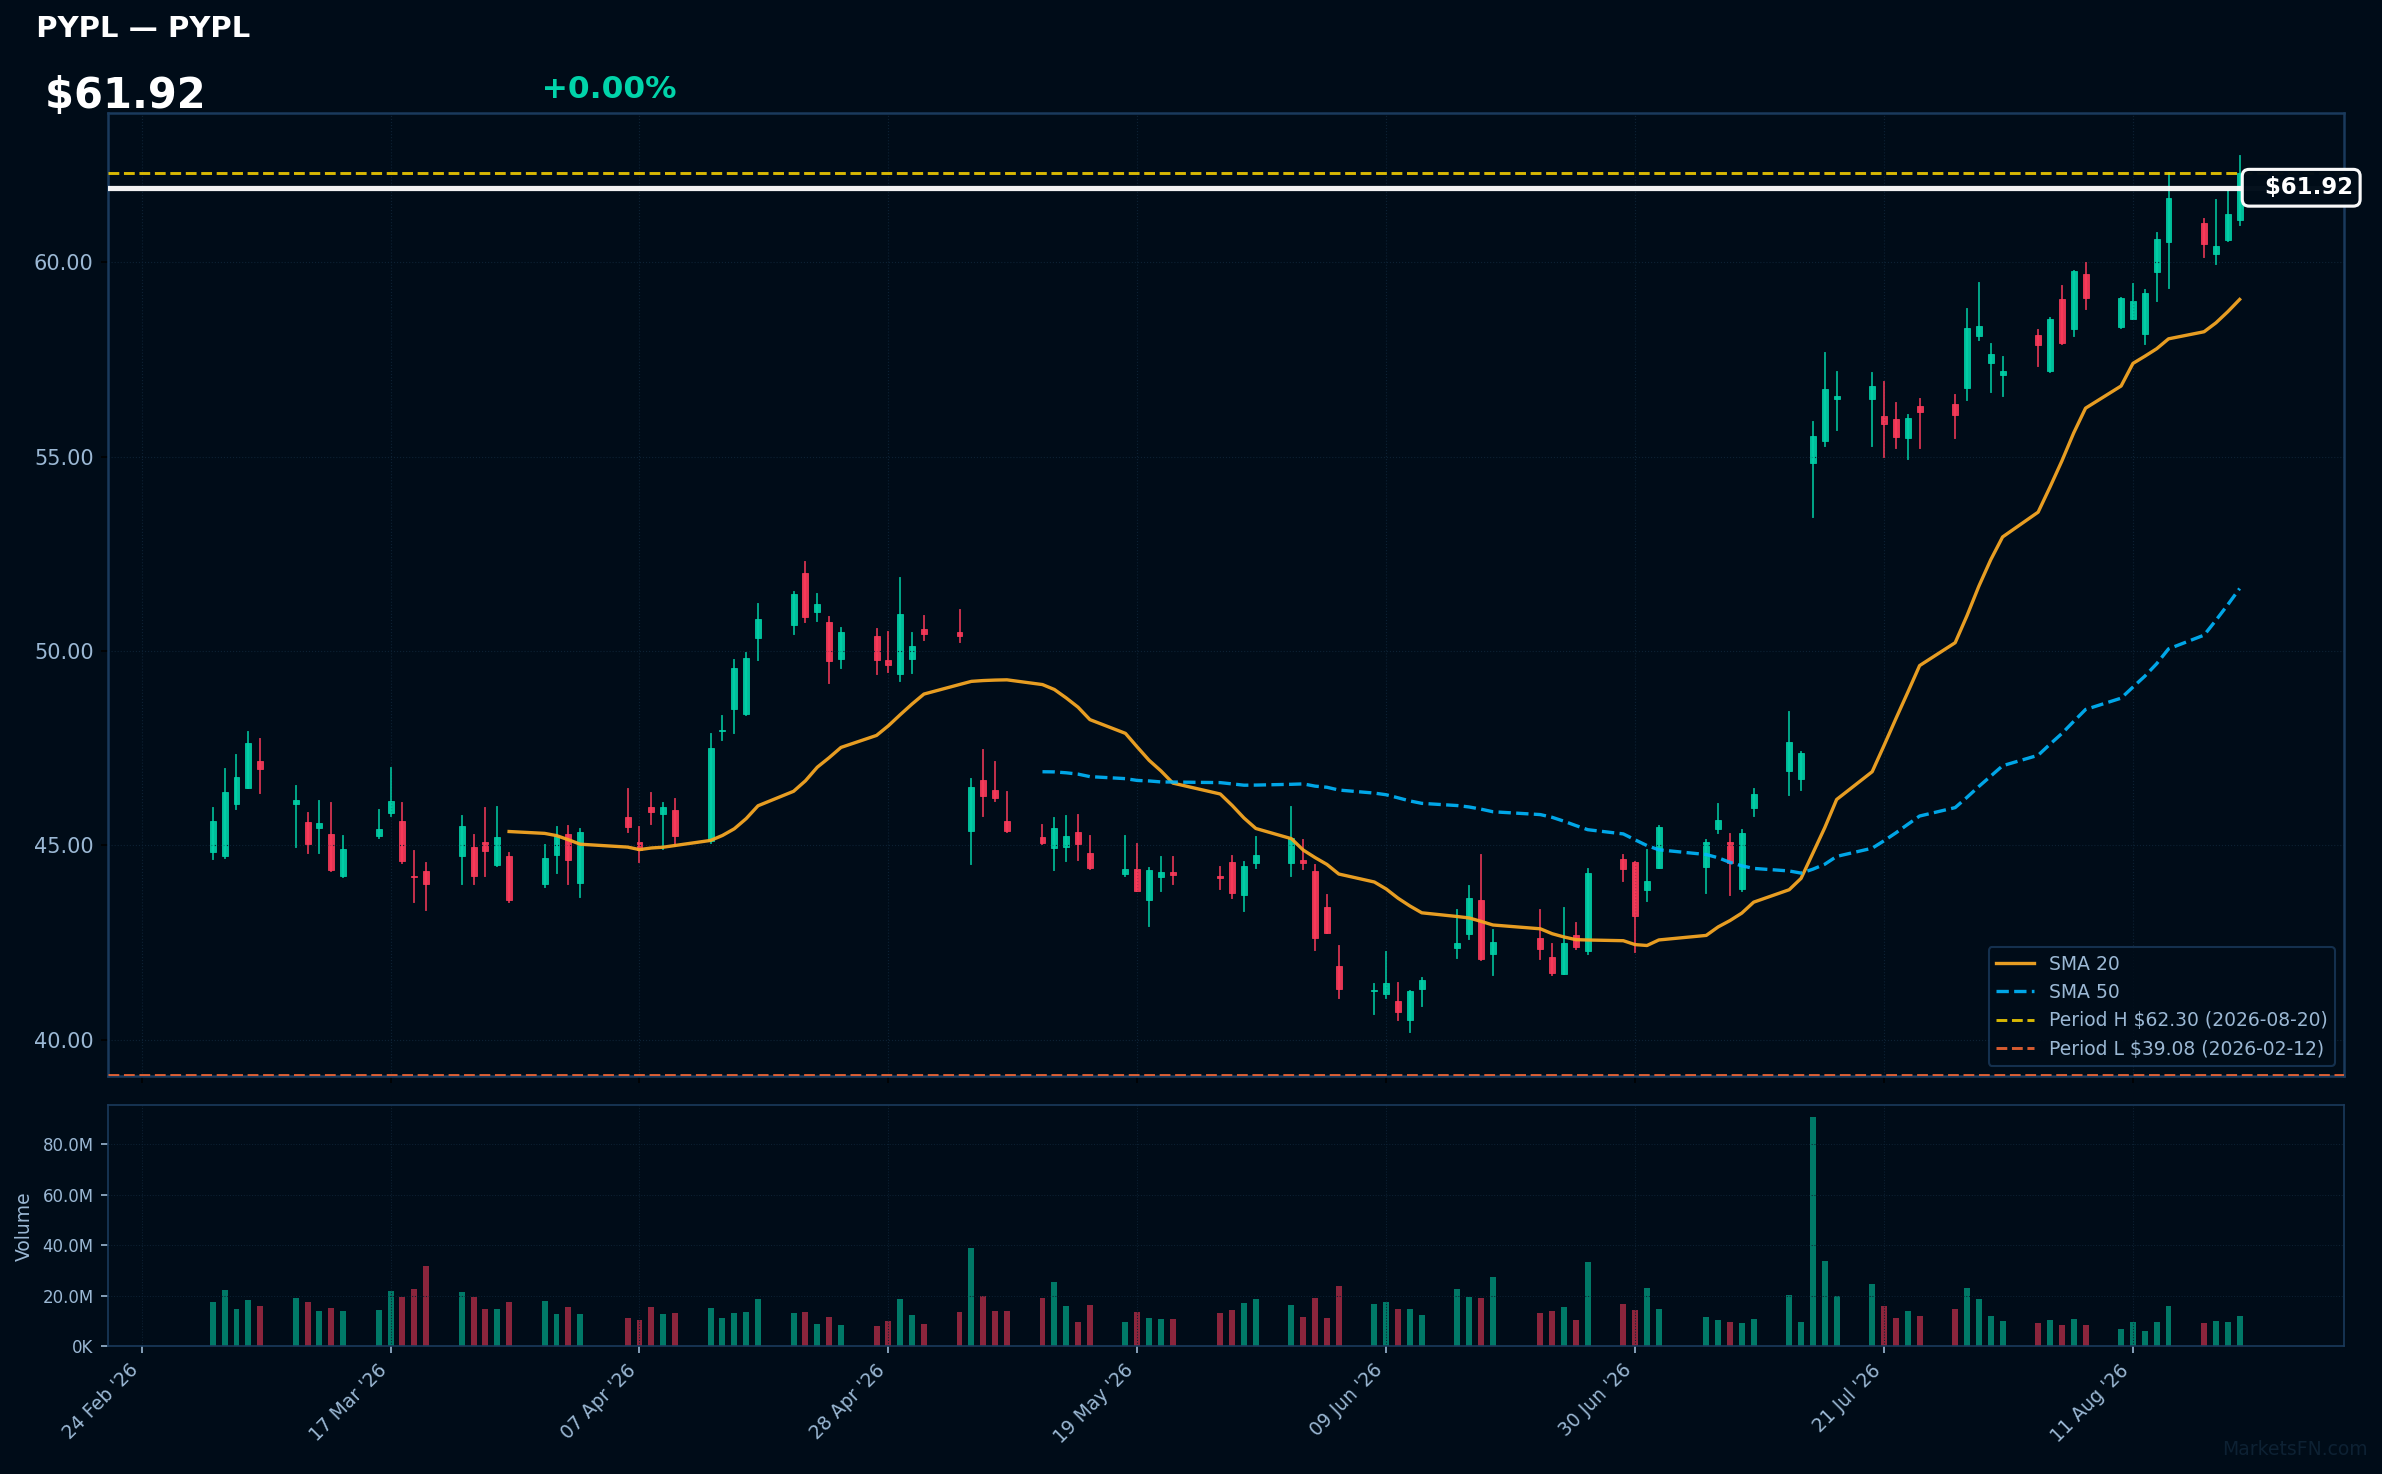
PYPL | PayPal Holdings Inc | Financial | Price Last: $62.30 | % Realized: +7.16% | RSI: 71.5 | % above MA200: +21.1% | Trend: Above MA20, MA50, MA200
PayPal Holdings Inc provides digital payment solutions, enabling consumers and merchants to transact online securely. Investors should care due to its significant market presence and ongoing innovations in fintech, which drive user engagement and revenue growth.
Currently, PayPal shows bullish momentum with an RSI(14) of 71.5 and a strong MA alignment: price > MA20 > MA50 > MA200, indicating a sustained uptrend and proximity to a breakout level.
Related headlines
- Universities Are Beginning To Roll Out An Option For Students To Pay Their Tuition Using PayPal Or Venmo
- College students can now pay tuition with PayPal or Venmo at some universities
- PYPL Stock On Track For Second Month Of Gains: PayPals Venmo Expands College Tuition Payments
- The Options Market Puts PayPal Stock Between The High Forties And The High Seventies
📉 Nearest to 2026 Low
Sectors represented: Consumer Defensive (1), Consumer Cyclical (1), Industrials (1), Utilities (1), Communication Services (1)
| Ticker | Company | Sector | Price Last | % Realized | 2026 YTD Low Date | RSI | % above MA200 | Trend |
|---|---|---|---|---|---|---|---|---|
| WMT | Walmart Inc | Consumer Defensive | $103.84 | -7.91% | 2026-08-20 | 29.1 | -12.4% | Below MA20, MA50, MA200 |
| TJX | TJX Companies, Inc | Consumer Cyclical | $140.69 | -8.81% | 2026-08-20 | 25.3 | -9.4% | Below MA20, MA50, MA200 |
| LHX | L3Harris Technologies Inc | Industrials | $270.44 | -11.18% | 2026-08-20 | 37.1 | -14.3% | Below MA20, MA50, MA200 |
| NRG | NRG Energy Inc | Utilities | $115.36 | -30.57% | 2026-08-20 | 40.0 | -22.8% | Below MA20, MA50, MA200 |
| TTD | Trade Desk Inc | Communication Services | $13.32 | -64.65% | 2026-08-20 | 31.9 | -49.8% | Below MA20, MA50, MA200 |
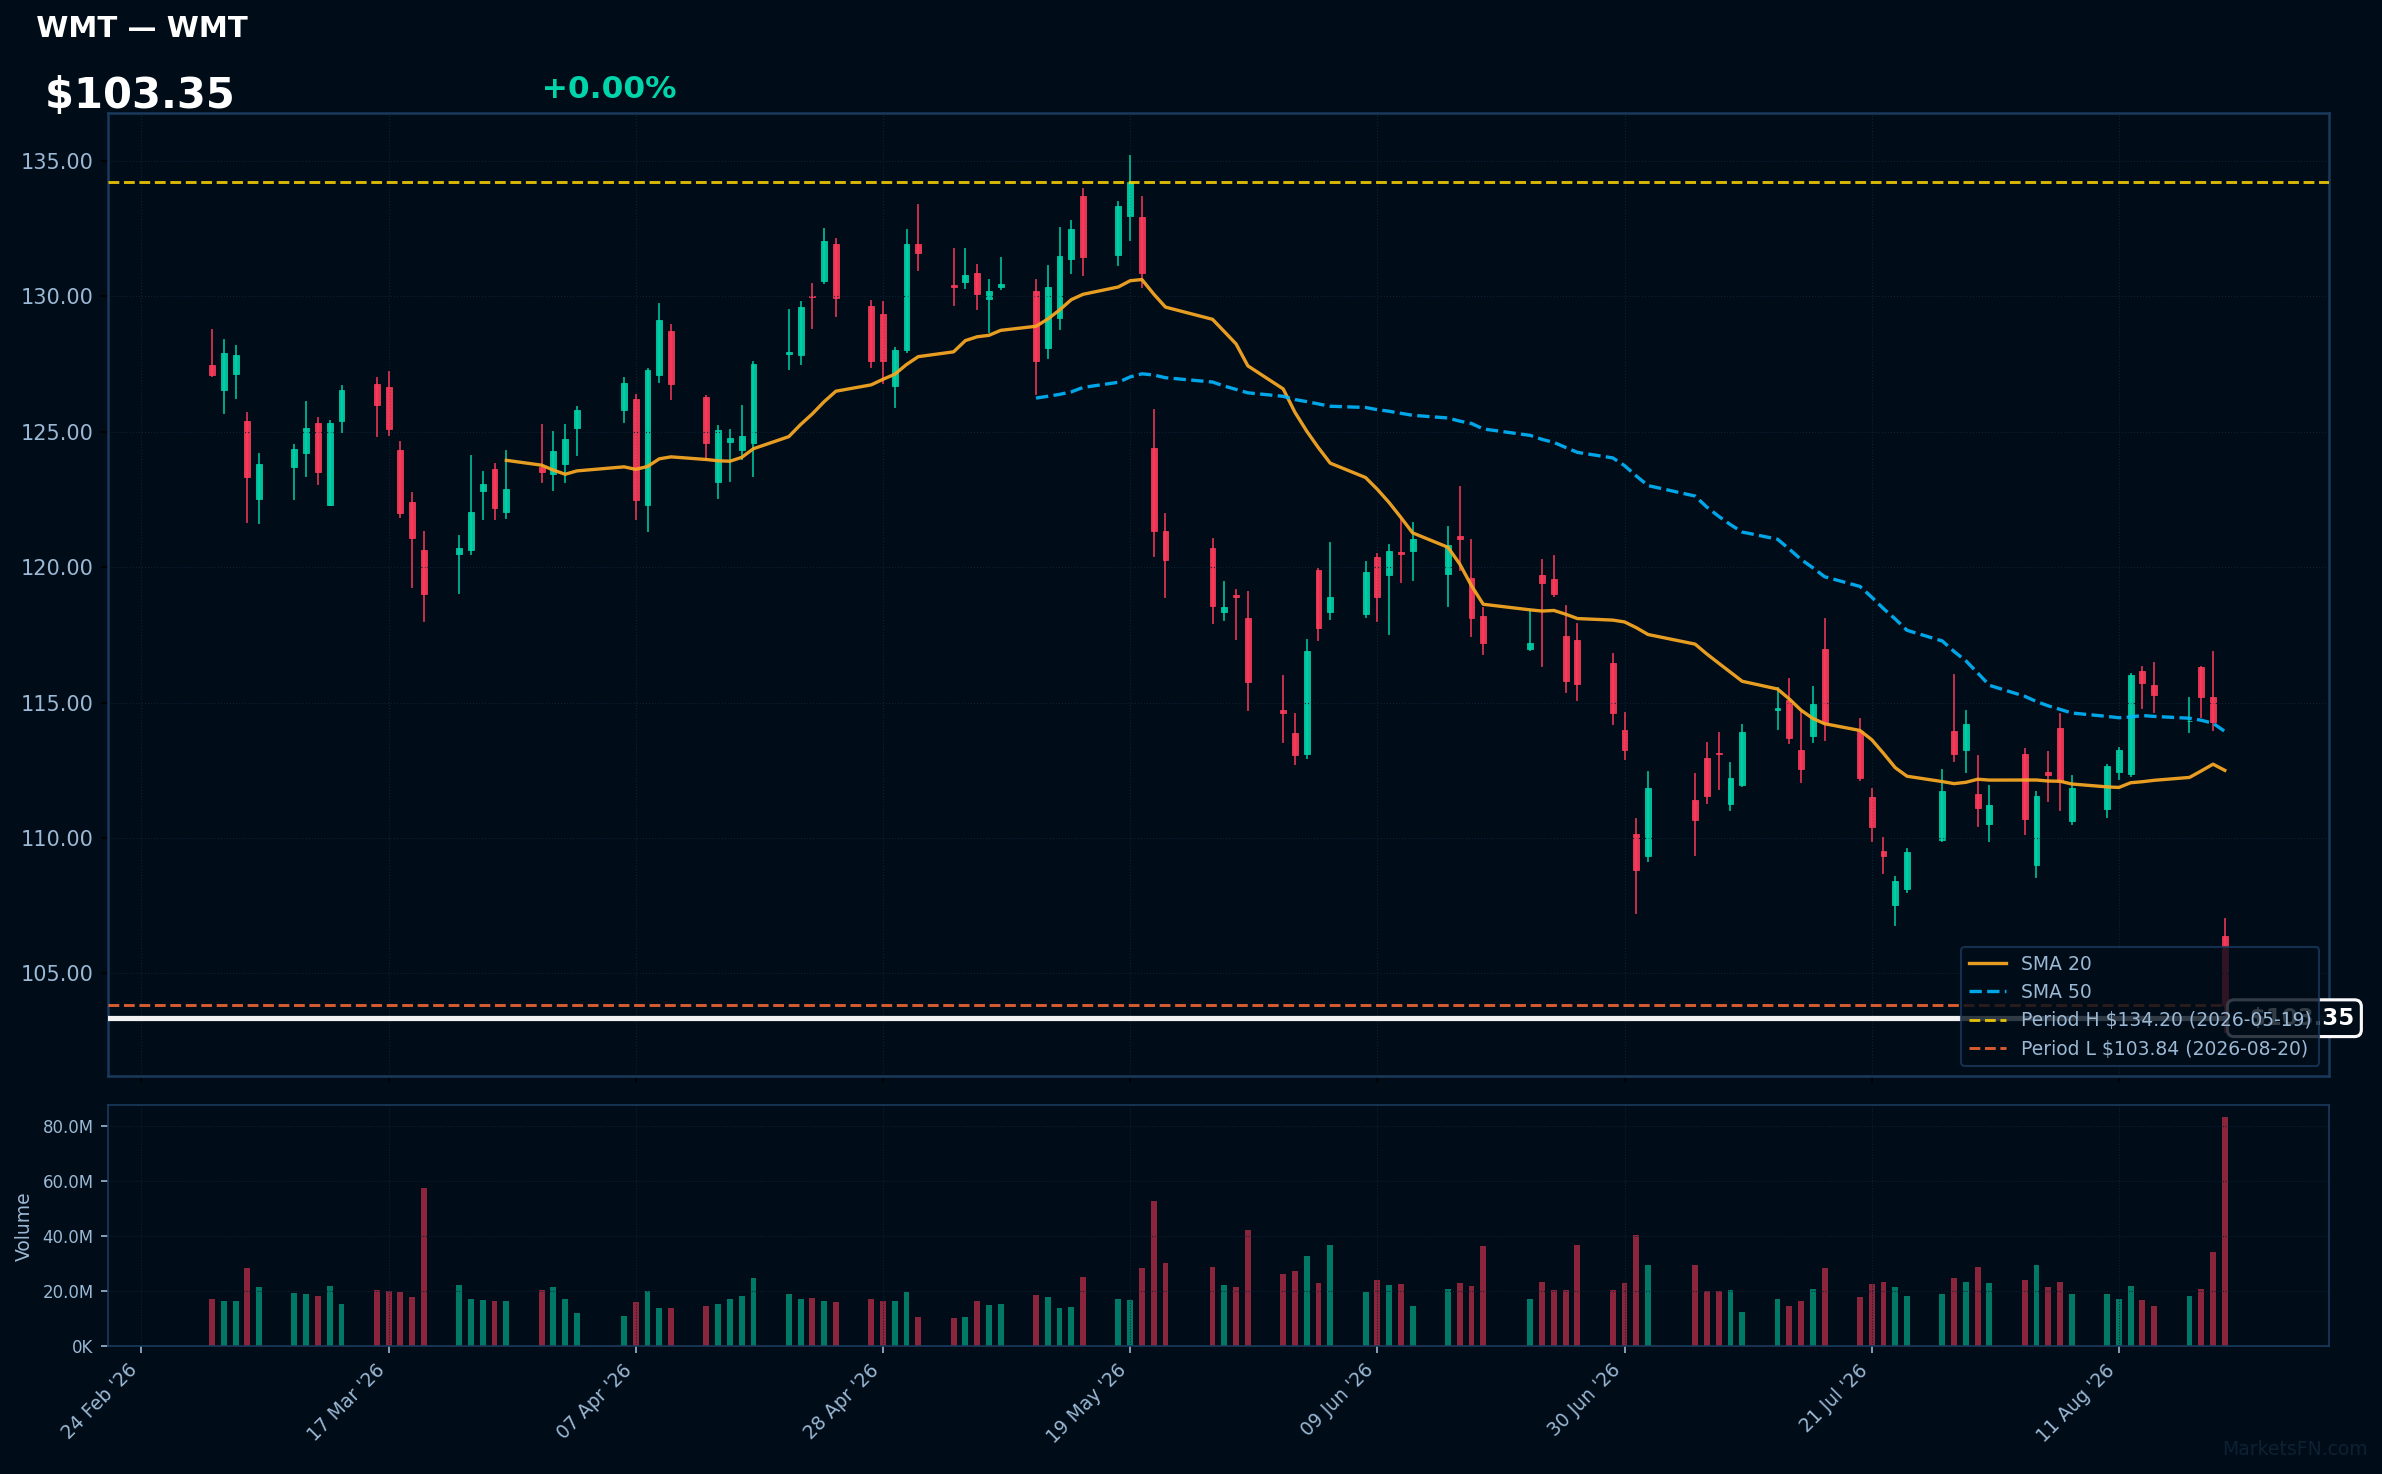
WMT | Walmart Inc | Consumer Defensive | Price Last: $103.84 | % Realized: -7.91% | RSI: 29.1 | % above MA200: -12.4% | Trend: Below MA20, MA50, MA200
Walmart Inc operates as a retail giant, offering a wide range of products including groceries, electronics, and clothing. Investors should care due to its significant market presence and ability to adapt to consumer trends, impacting revenue stability and growth potential.
The current technical situation indicates a bearish trend, with an RSI of 29.1 and a MA alignment of price < MA20 < MA50 < MA200, suggesting sustained downtrend and testing major support, as the stock is only 0.0% above its 2026 YTD low.
Related headlines
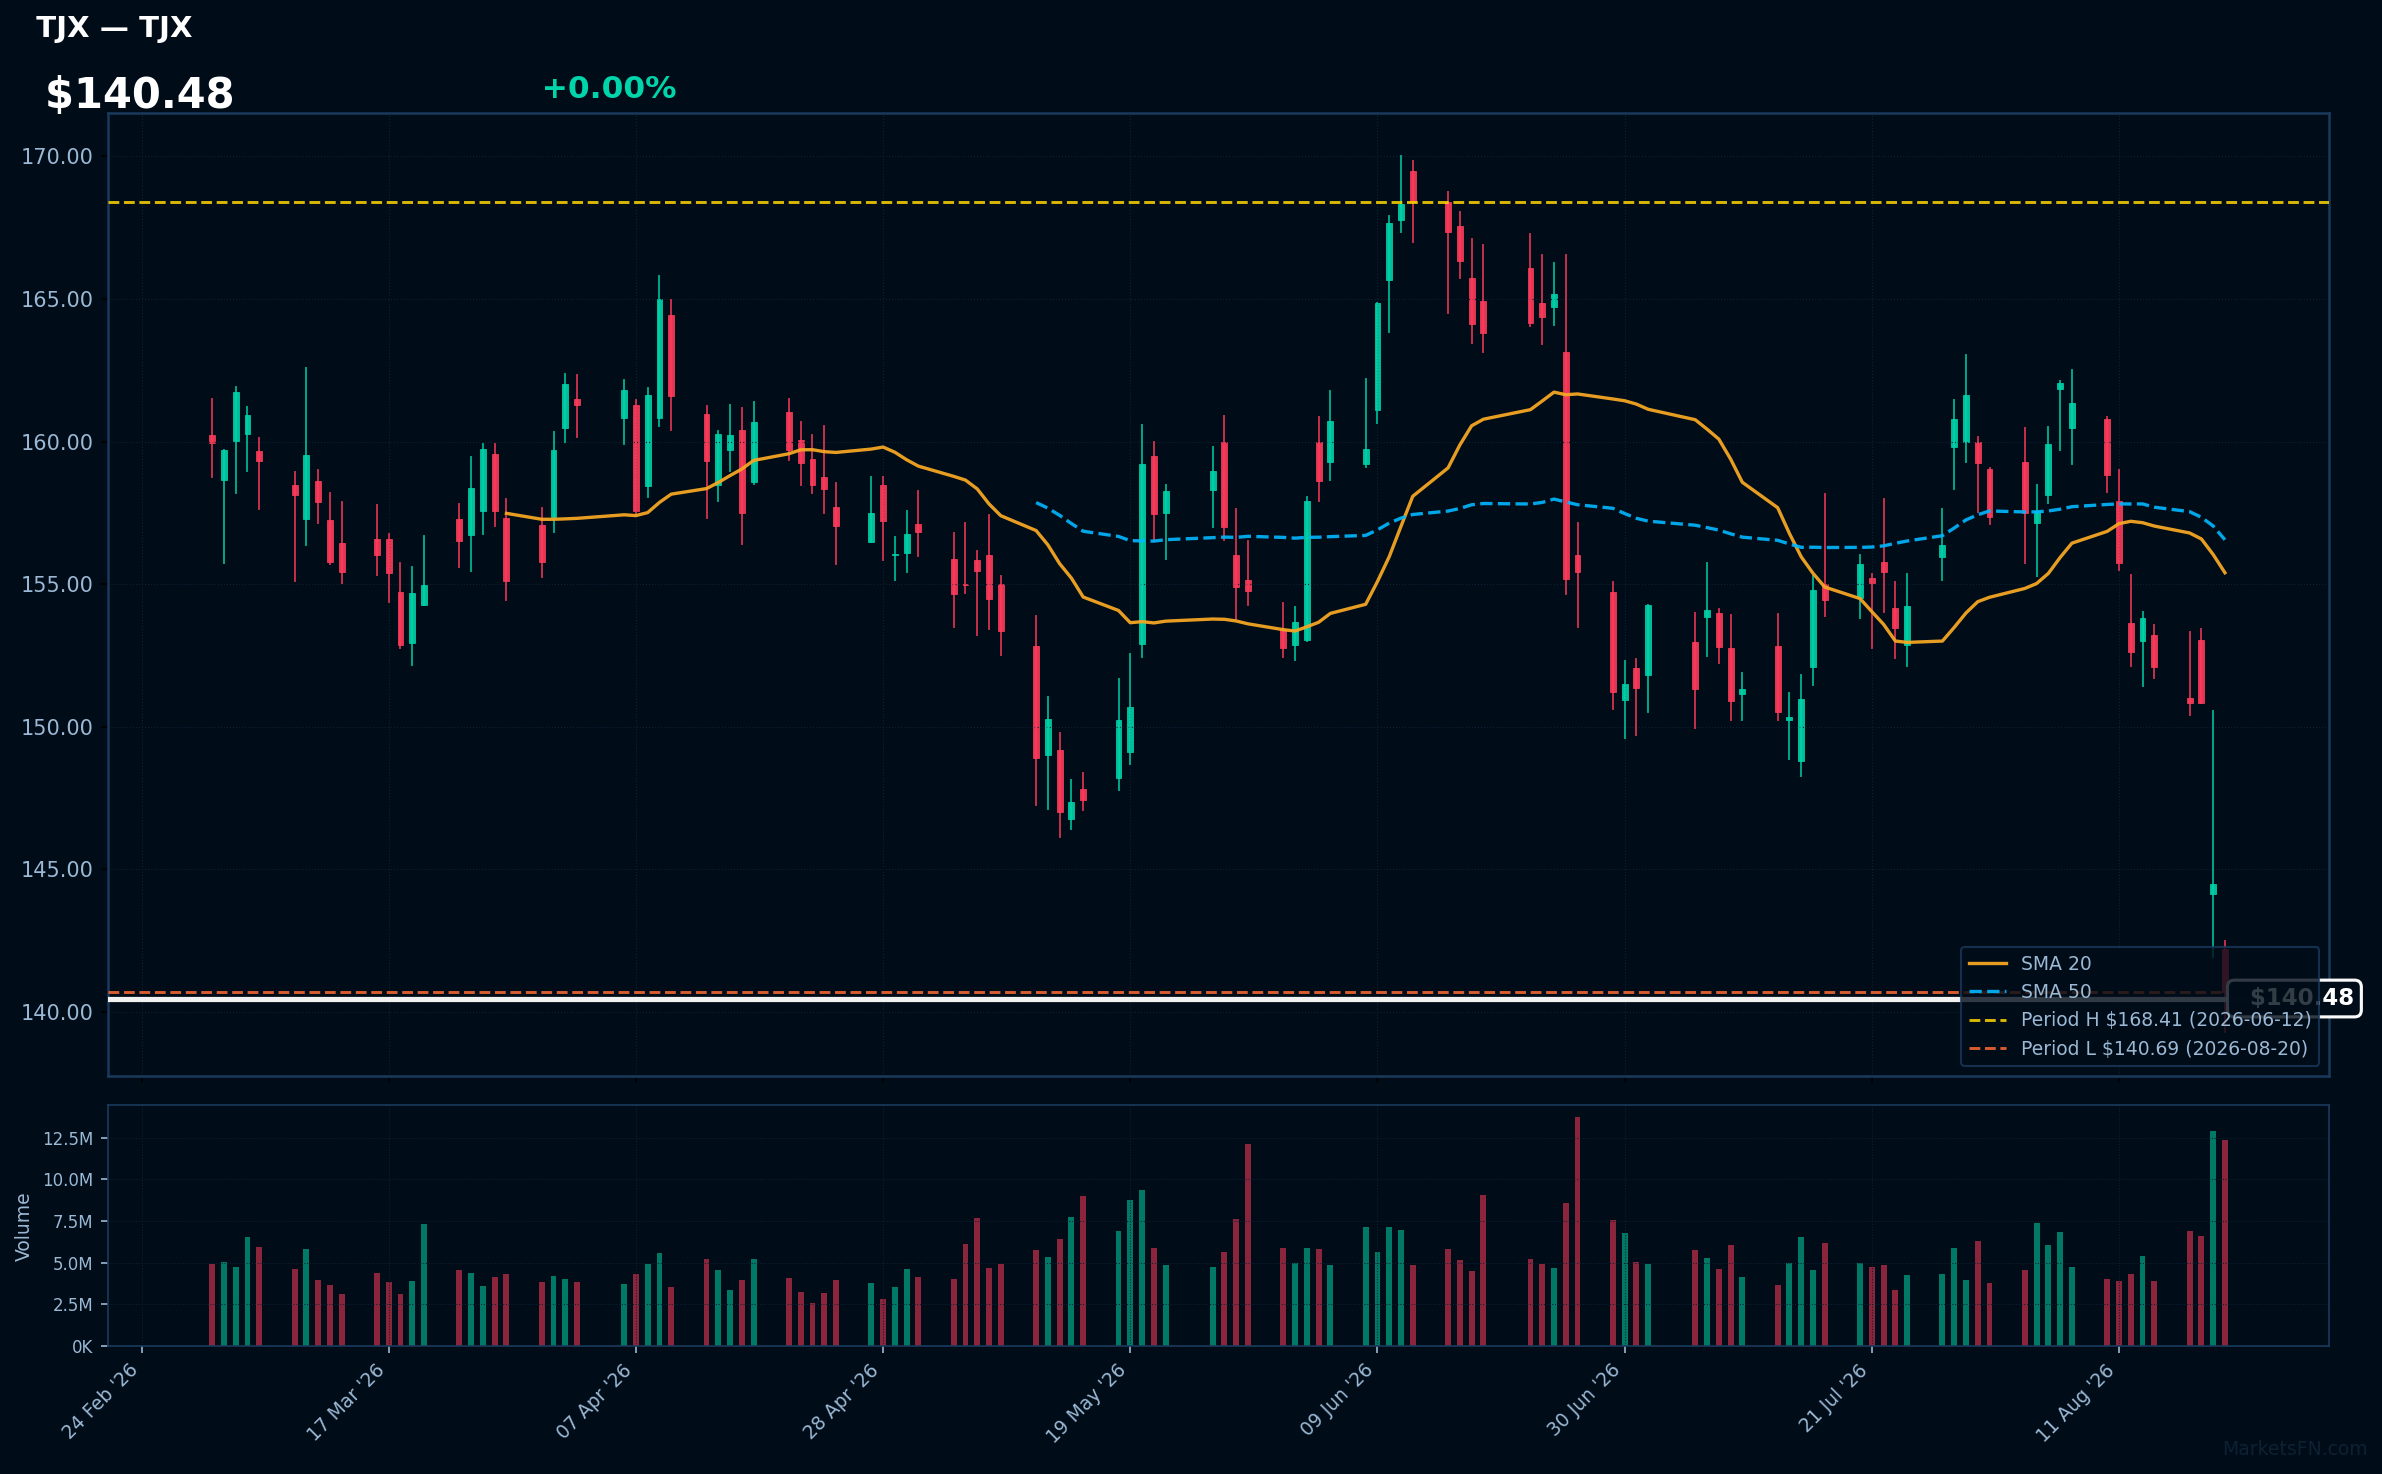
TJX | TJX Companies, Inc | Consumer Cyclical | Price Last: $140.69 | % Realized: -8.81% | RSI: 25.3 | % above MA200: -9.4% | Trend: Below MA20, MA50, MA200
TJX Companies, Inc operates off-price retail stores, offering discounted apparel and home goods. Investors should care due to its ability to attract cost-conscious consumers, especially in economic downturns, which can drive sales and market share growth.
The current technical situation shows a bearish trend with an RSI(14) of 25.3, indicating oversold conditions, and mixed signals as the stock is below MA20/MA50/MA200. It is testing major support, being only 0.0% above its 2026 YTD low.
Related headlines
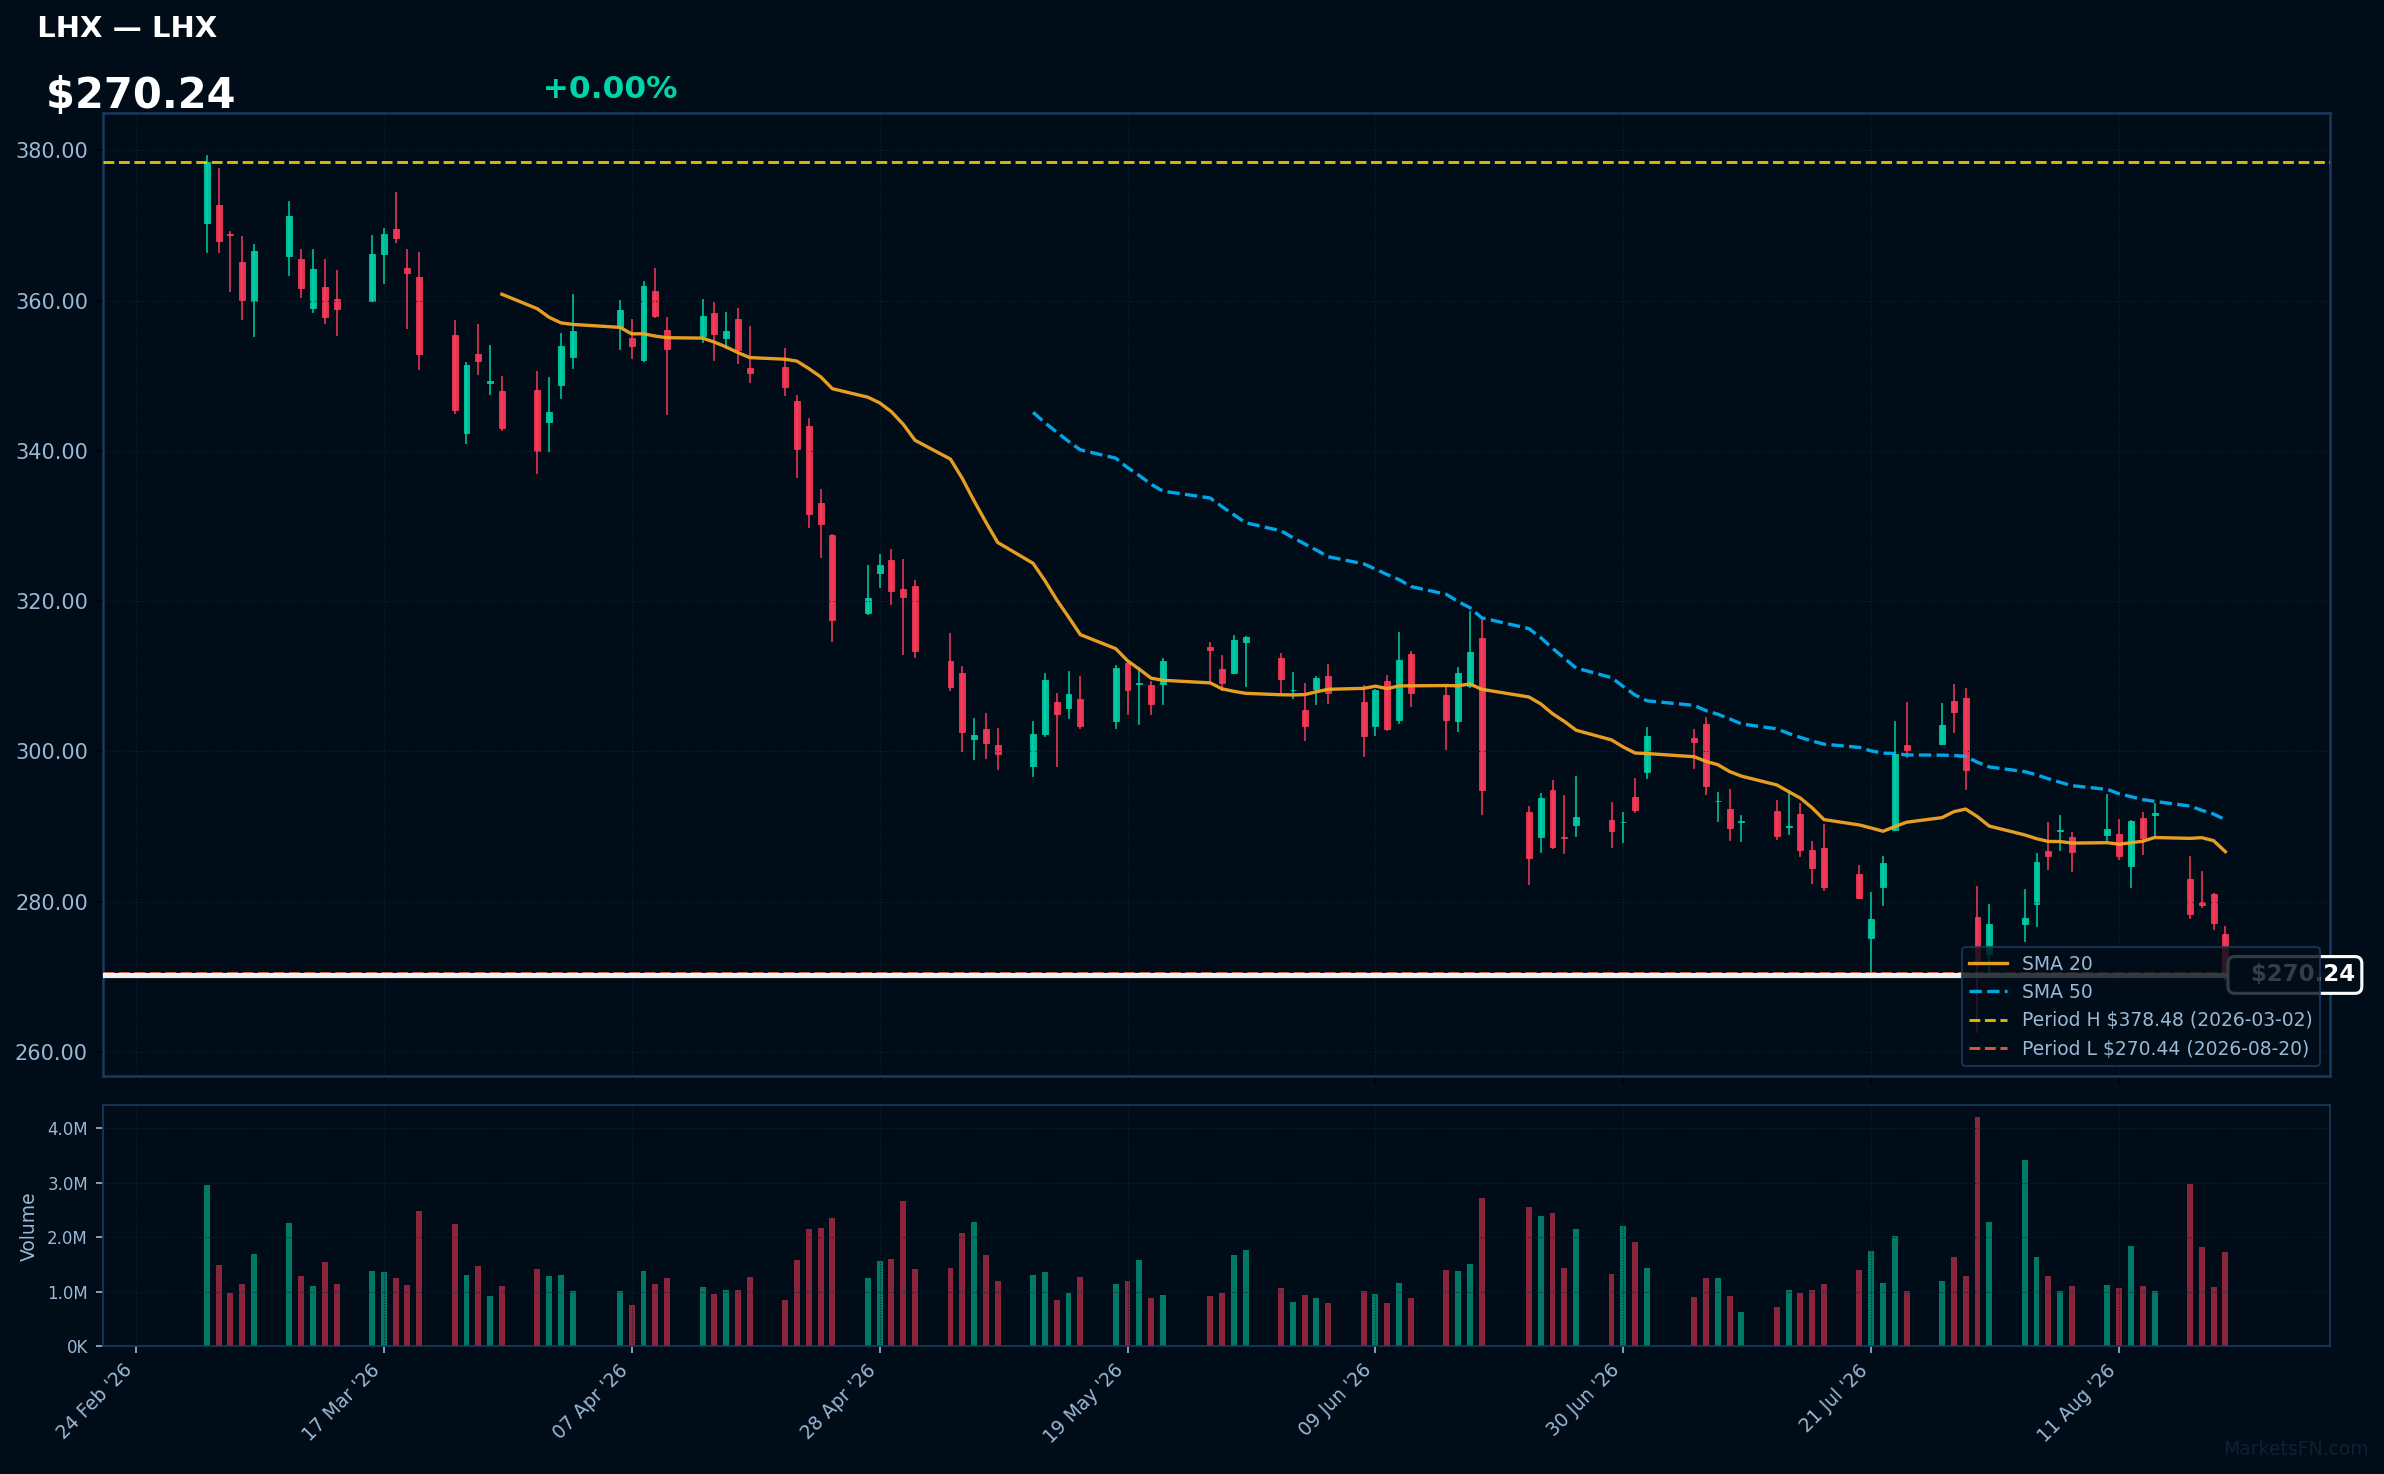
LHX | L3Harris Technologies Inc | Industrials | Price Last: $270.44 | % Realized: -11.18% | RSI: 37.1 | % above MA200: -14.3% | Trend: Below MA20, MA50, MA200
L3Harris Technologies Inc specializes in communication and electronic systems for government and commercial customers, focusing on defense, aerospace, and public safety sectors. Investors should care due to its critical role in national security and technological advancements, which can drive future growth.
The current technical situation indicates a bearish trend, with an RSI(14) of 37.1 and a MA alignment of price < MA20 < MA50 < MA200, suggesting a sustained downtrend and testing major support just 0.0% above its 2026 YTD low.
Related headlines
- Women at L3Harris Shared Concerns About CEO's Behavior Years Before Ouster
- L3Harris Demonstrates Multi-Domain Supremacy at Annual Project Convergence Exercise
- L3Harris fires CEO Chris Kubasik after conduct investigation
- Ousted L3Harris CEO Chris Kubasik forfeits $45 millionbut hell still walk away with $80 million in stock and options
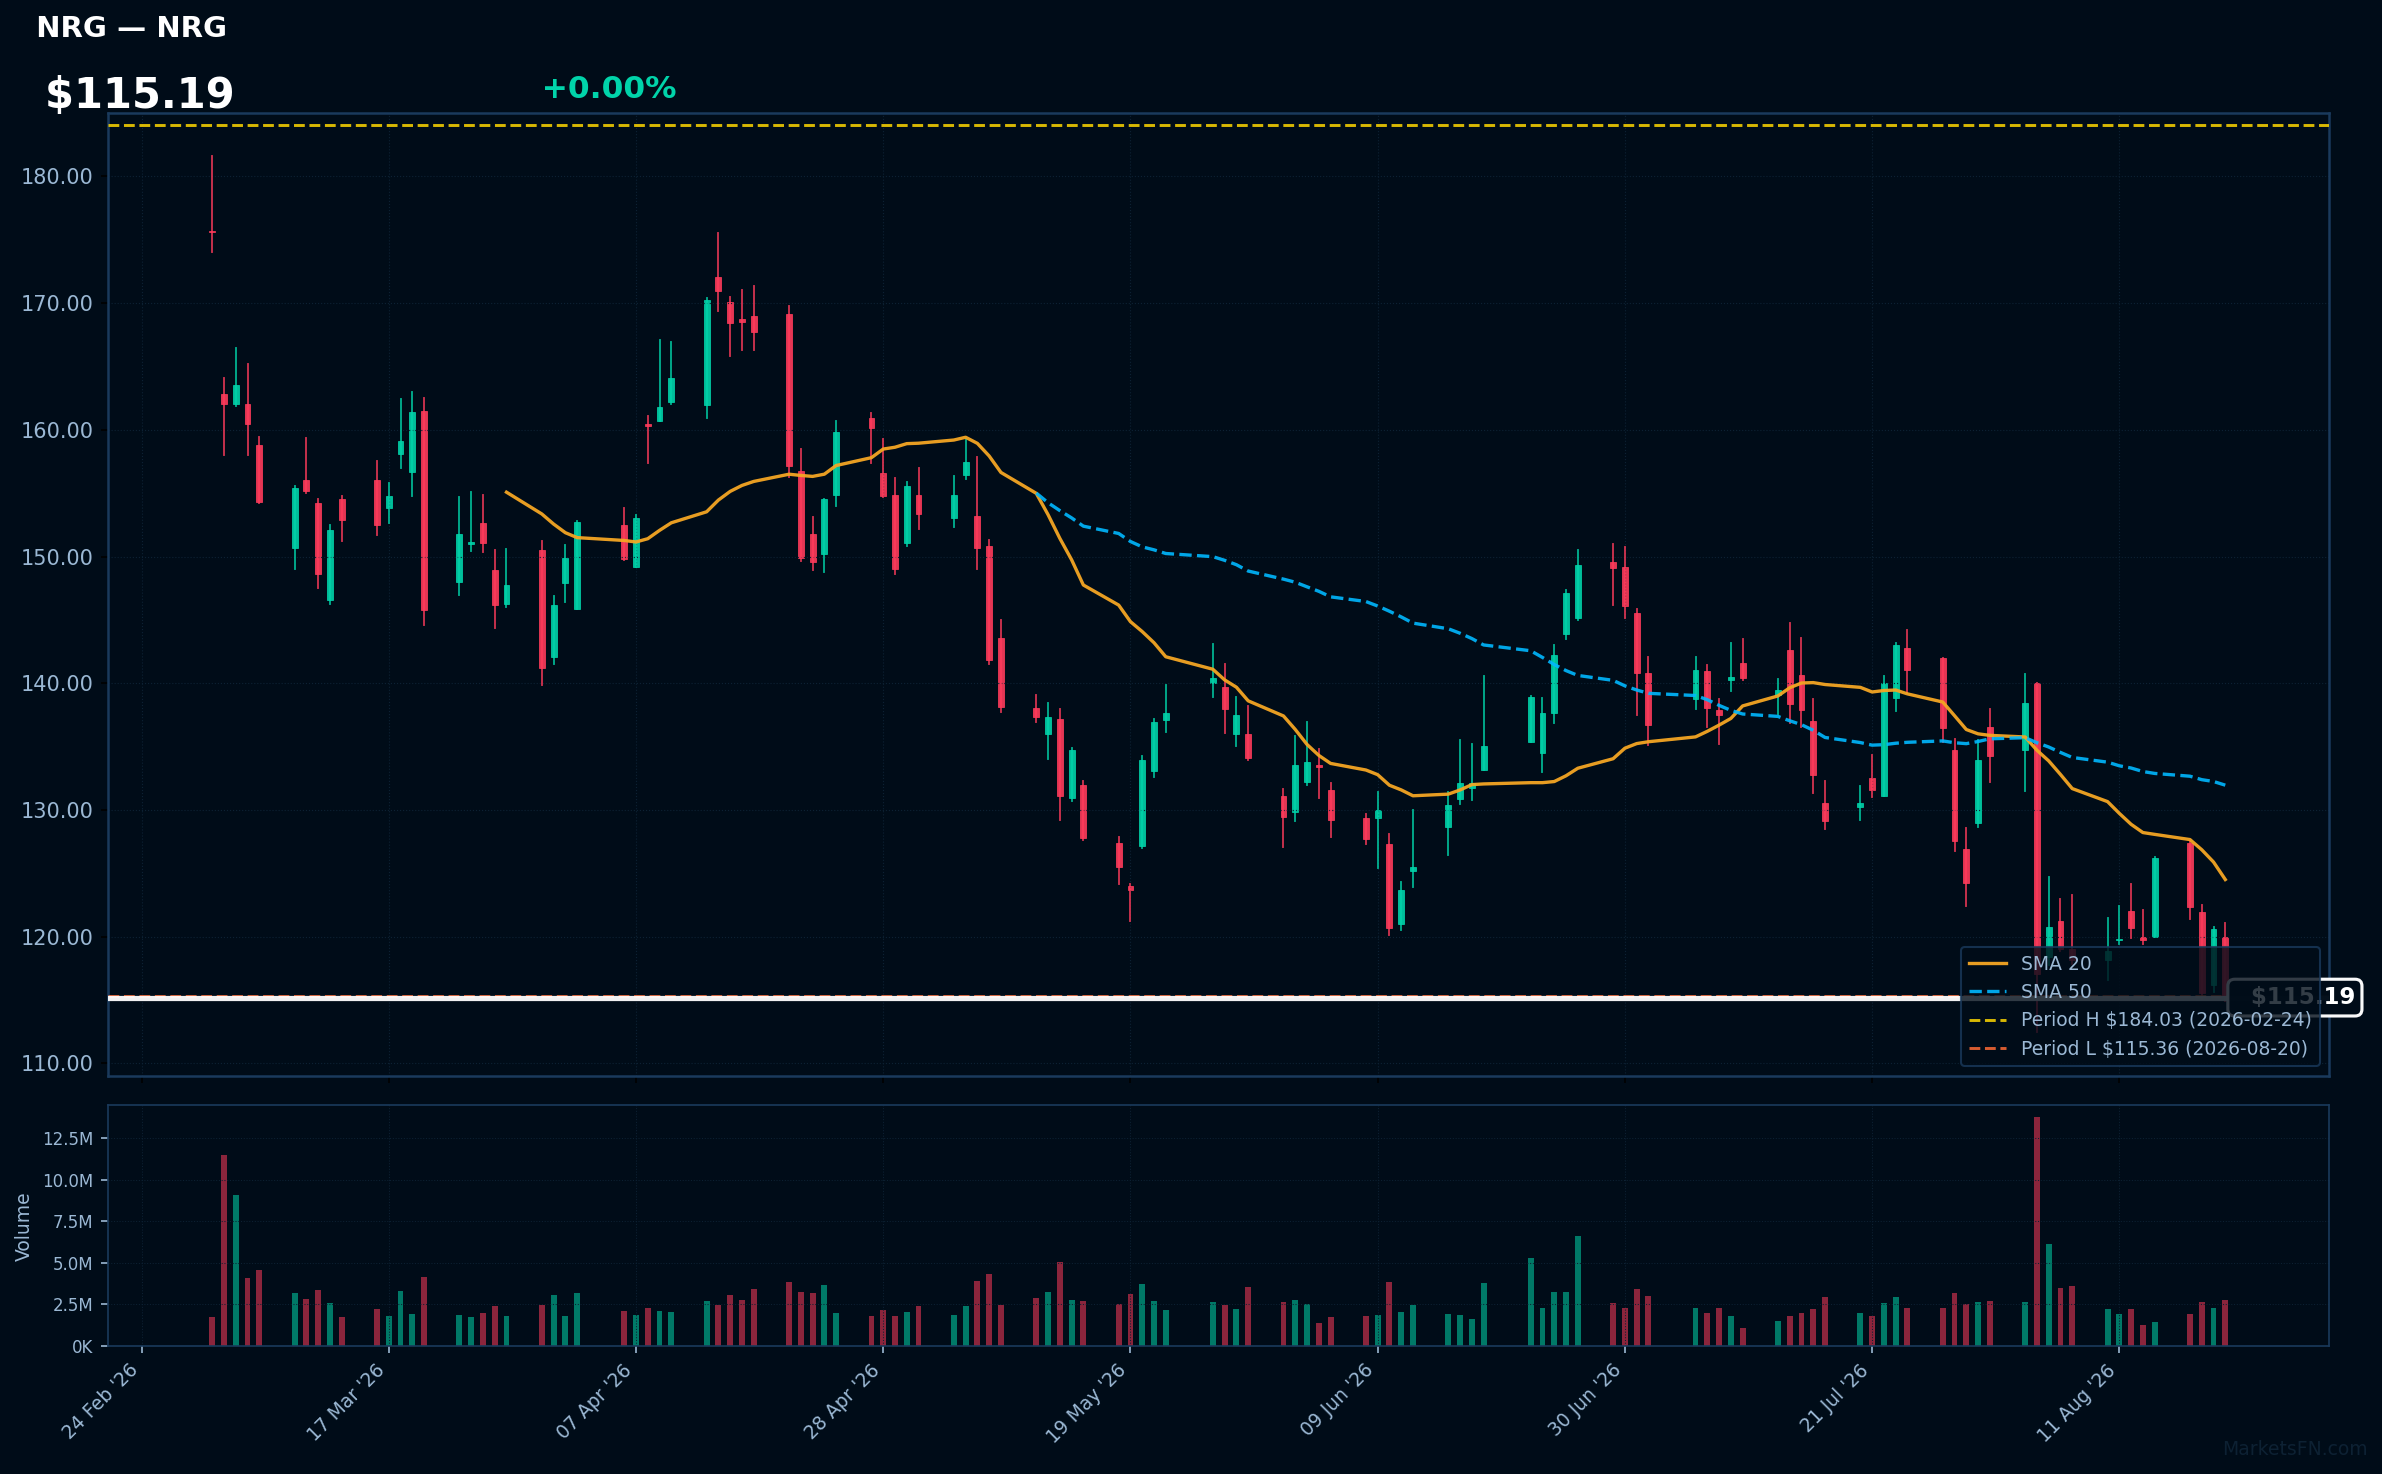
NRG | NRG Energy Inc | Utilities | Price Last: $115.36 | % Realized: -30.57% | RSI: 40.0 | % above MA200: -22.8% | Trend: Below MA20, MA50, MA200
NRG Energy Inc is a leading integrated power company, providing electricity and energy solutions across the U.S. Investors should care due to its significant role in the energy transition and potential for growth in renewable energy sectors amidst changing regulations and consumer preferences.
The current technical situation indicates a bearish trend, with an RSI(14) of 40.0 and a MA alignment of price < MA20 < MA50 < MA200, suggesting sustained downtrend and testing major support, being only 0.0% above its 2026 YTD low.
Related headlines
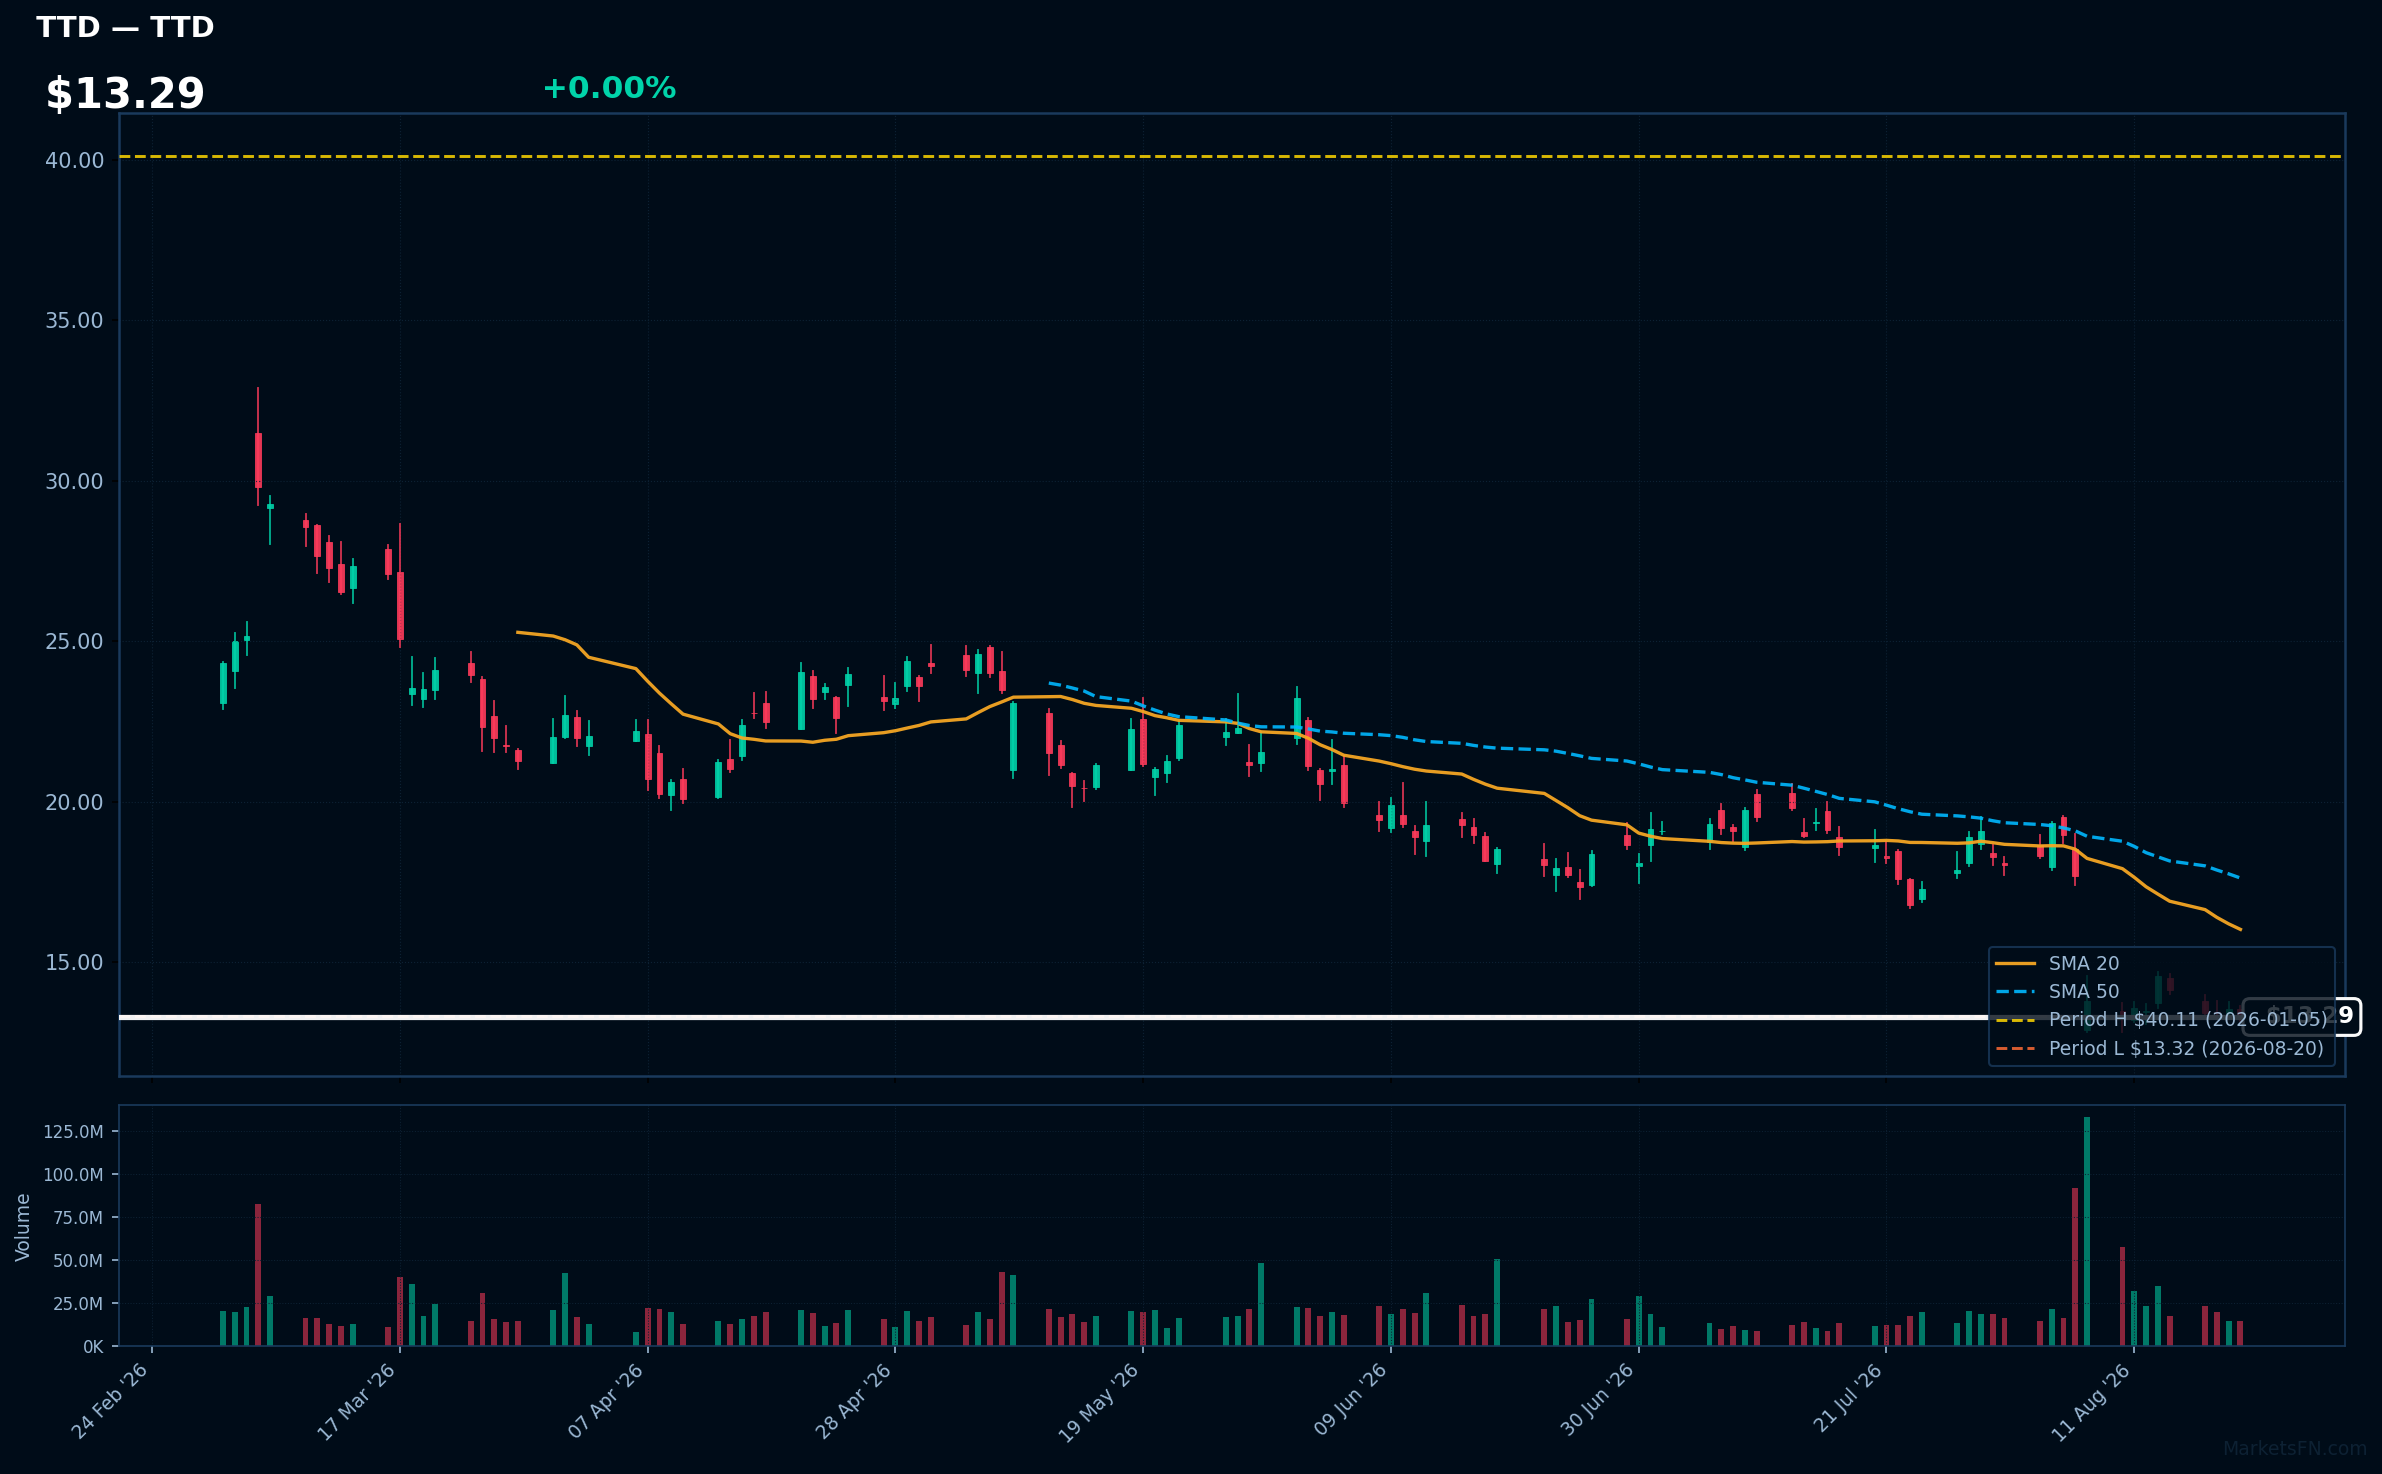
TTD | Trade Desk Inc | Communication Services | Price Last: $13.32 | % Realized: -64.65% | RSI: 31.9 | % above MA200: -49.8% | Trend: Below MA20, MA50, MA200
Trade Desk Inc (TTD) provides a technology platform for digital advertising, enabling advertisers to manage and optimize their ad campaigns across various channels. Investors should care due to its role in the growing programmatic advertising market, which is crucial for digital marketing efficiency.
The current technical situation indicates a bearish trend with an RSI(14) of 31.9 and a MA alignment of price < MA20 < MA50 < MA200. The stock is testing major support, being only 0.0% above its 2026 YTD low.
Related headlines
Market Commentary
The proximity of certain S&P 500 stocks to their 2026 year-to-date extremes indicates a significant divergence in market performance. Stocks like Coca-Cola Co, Automatic Data Processing Inc, and Conoco Phillips are at 0.0% from their highs, suggesting strong investor confidence and bullish sentiment in these companies. Conversely, Walmart Inc and others are only slightly above their lows, reflecting potential challenges or market corrections within those sectors.
This divergence can be attributed to varying sector themes and market conditions. The companies near their highs, such as EOG Resources and PayPal Holdings, may be benefiting from favorable economic conditions, strong earnings reports, or sector-specific growth trends. In contrast, those near their lows, including TJX Companies and L3Harris Technologies, might be facing headwinds such as supply chain issues, inflationary pressures, or shifts in consumer behavior that are impacting their stock performance.
Investors should closely monitor upcoming earnings reports and economic indicators that could influence these trends. Additionally, watching for changes in consumer sentiment and sector-specific news will be crucial in assessing whether the stocks near their highs can maintain momentum or if those near their lows will recover. Keeping an eye on broader market conditions will also provide insights into potential shifts in investor sentiment.
Methodology: All 503 S&P 500 constituents screened. Close prices downloaded from 2026-01-01. Period high = highest close since Jan 1 2026; period low = lowest close since Jan 1 2026. Distance = (current price / period extreme − 1) × 100. Technical indicators computed on up to 1 year of daily OHLCV data.
Disclaimer: For informational purposes only. Not investment advice. Past performance is not indicative of future results.

