S&P 500 2026 YTD Highs & Lows Radar: Chevron (CVX), TJXmpanies, (TJX) and more
MarketsFN Team

S&P 500 2026 YTD Highs & Lows Radar: Chevron (CVX), TJXmpanies, (TJX) and more
Screening all 503 S&P 500 constituents for stocks nearest to their 2026 year-to-date high and their 2026 YTD low. Data as of September 16, 2026. % Realized = total return since Jan 1 2026.
Legend: RSI > 70 = overbought · RSI < 30 = oversold · Green % Realized = positive YTD return · Red = negative.
📈 Nearest to 2026 High
Sectors represented: Energy (2), Healthcare (1), Communication Services (1), Technology (1)
| Ticker | Company | Sector | Price Last | % Realized | 2026 YTD High Date | RSI | % above MA200 | Trend |
|---|---|---|---|---|---|---|---|---|
| CVX | Chevron Corp | Energy | $217.77 | +39.69% | 2026-09-15 | 64.7 | +18.8% | Above MA20, MA50, MA200 |
| TMO | Thermo Fisher Scientific Inc | Healthcare | $641.39 | +8.25% | 2026-09-15 | 68.4 | +19.4% | Above MA20, MA50, MA200 |
| VZ | Verizon Communications Inc | Communication Services | $51.45 | +26.97% | 2026-09-15 | 68.3 | +11.7% | Above MA20, MA50, MA200 |
| COP | Conoco Phillips | Energy | $141.22 | +46.04% | 2026-09-15 | 61.7 | +23.4% | Above MA20, MA50, MA200 |
| CRWD | Crowdstrike Holdings Inc | Technology | $242.49 | +113.85% | 2026-09-15 | 61.9 | +66.3% | Above MA20, MA50, MA200 |
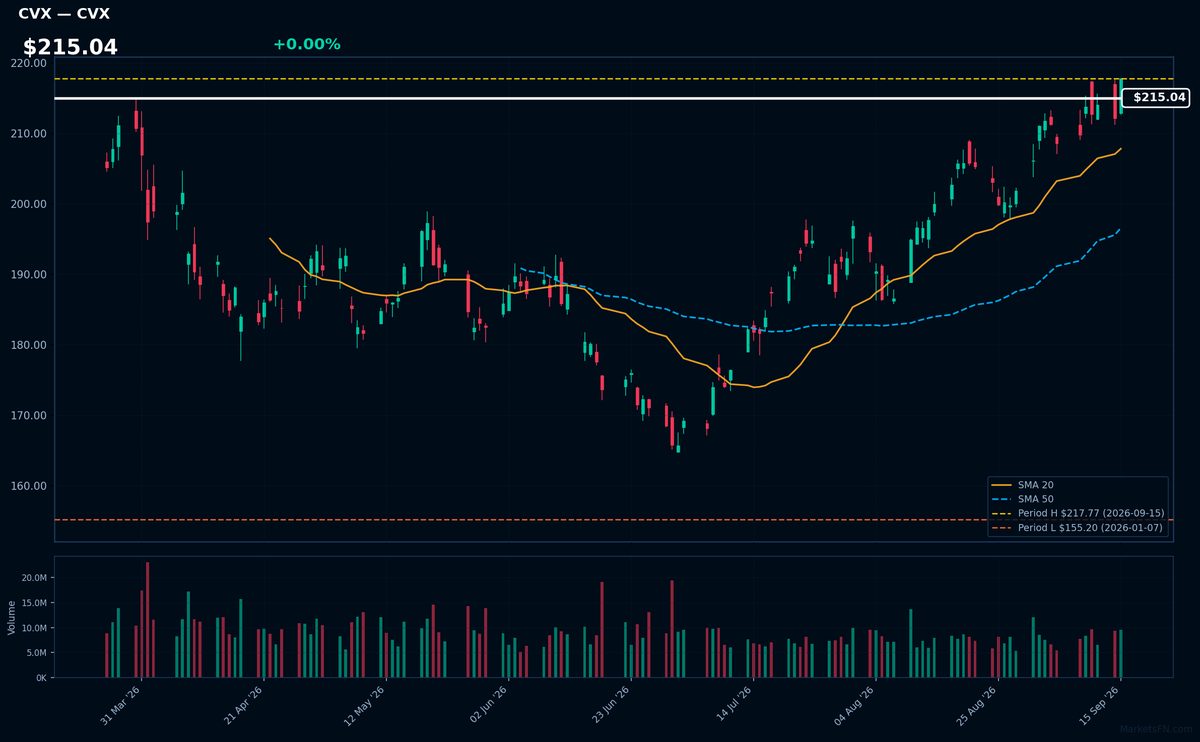
CVX | Chevron Corp | Energy | Price Last: $217.77 | % Realized: +39.69% | RSI: 64.7 | % above MA200: +18.8% | Trend: Above MA20, MA50, MA200
Chevron Corp is a multinational energy corporation that engages in the exploration, production, and refining of oil and natural gas. Investors care about its ability to navigate the energy transition while maintaining profitability.
Chevron Corp's current technical situation indicates sustained uptrend with price > MA20 > MA50 > MA200, RSI(14) at 64.7, and 0.0% below its 2026 YTD high, suggesting momentum with a potential breakout.
Related headlines
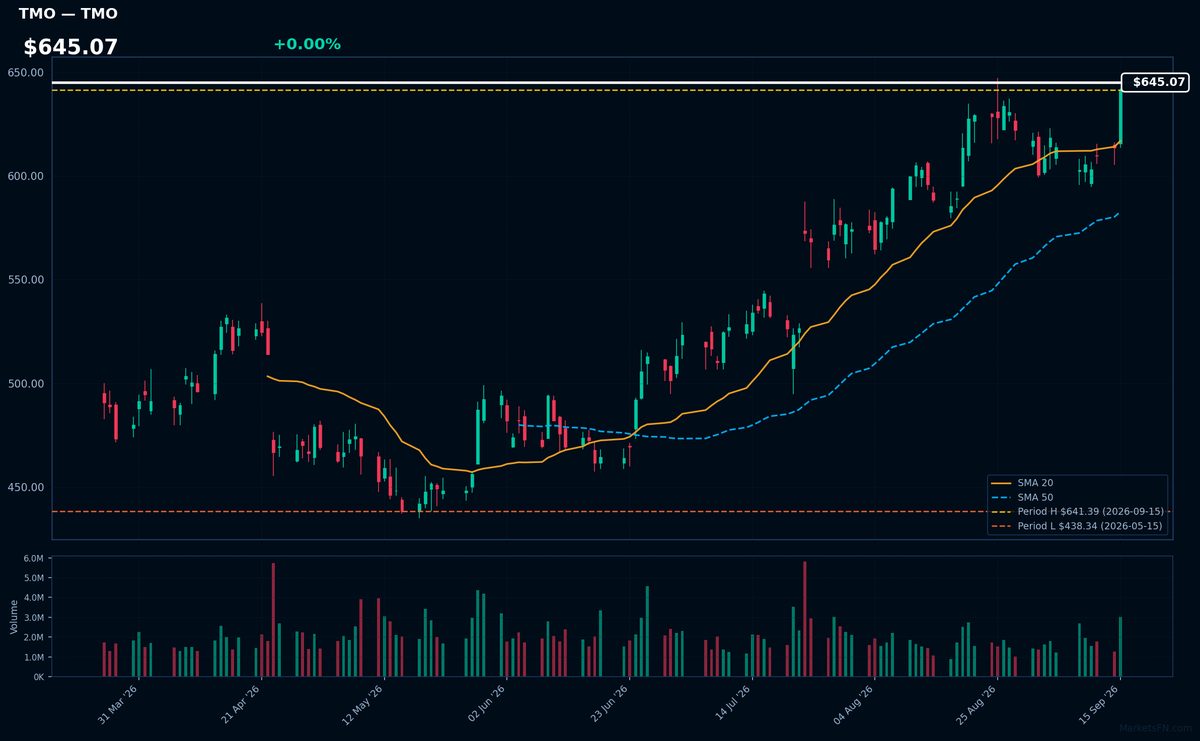
TMO | Thermo Fisher Scientific Inc | Healthcare | Price Last: $641.39 | % Realized: +8.25% | RSI: 68.4 | % above MA200: +19.4% | Trend: Above MA20, MA50, MA200
Thermo Fisher Scientific Inc is a life sciences and laboratory equipment company providing analytical instruments, laboratory equipment, and services to pharmaceutical, biotech, and research institutions, enabling them to advance scientific discovery and product development.
Thermo Fisher's current technical situation indicates sustained uptrend with bullish MA alignment (price > MA20 > MA50 > MA200) and RSI(14) at 68.4, near its 2026 YTD high, suggesting momentum; the stock is 0.0% below this level, potentially setting up for a breakout.
Related headlines
- Thermo Fisher CEO Says AI Will Drive More Pharma Spending Sees 7% Organic Growth By 2028
- Uber initiated, Thermo Fisher upgraded: Wall Street's top analyst calls
- Thermo Fisher Scientific to Present at the Morgan Stanley 24th Annual Global Healthcare Conference on September 15, 2026
- Top Research Reports for Amgen, Thermo Fisher & Pepsi
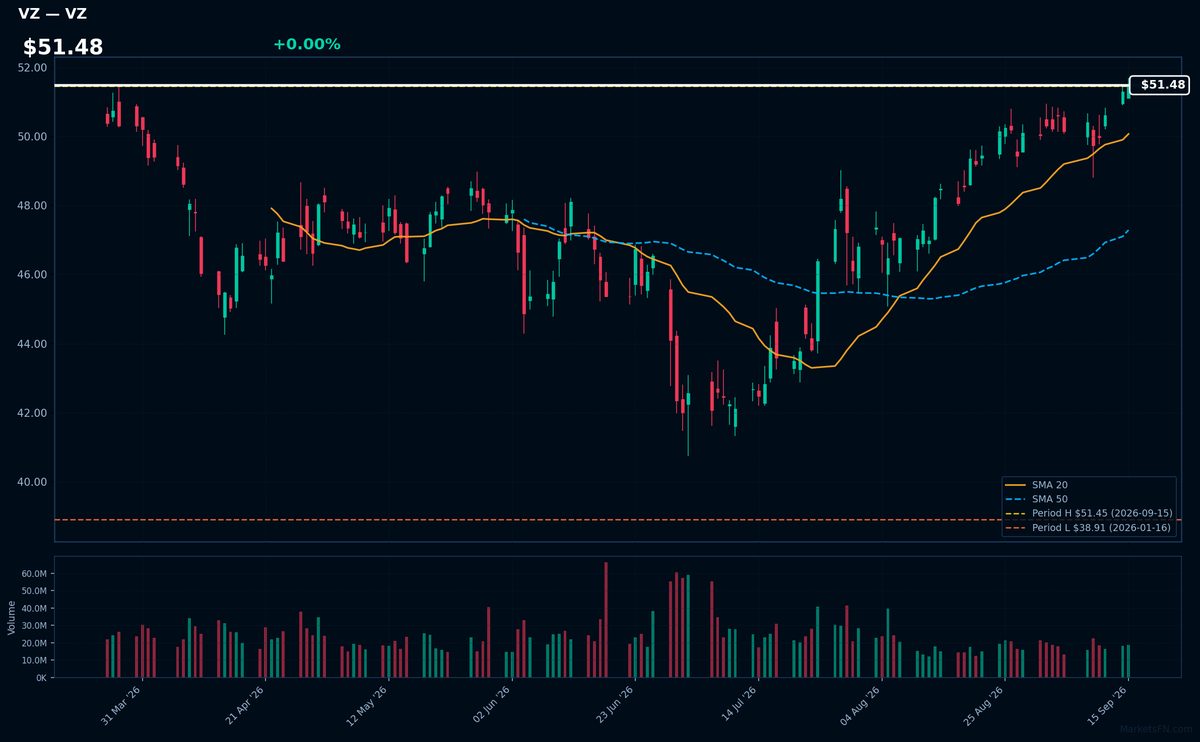
VZ | Verizon Communications Inc | Communication Services | Price Last: $51.45 | % Realized: +26.97% | RSI: 68.3 | % above MA200: +11.7% | Trend: Above MA20, MA50, MA200
Verizon Communications Inc is a telecommunications giant providing wireless services, broadband, and Fios. Investors should care due to its stable cash flows and dividend yield, making it attractive for income-seeking investors.
Verizon's technicals indicate sustained uptrend with price > MA20 > MA50 > MA200, RSI(14) at 68.3, and 0.0% below 2026 YTD high, suggesting momentum; 27.0% 2026 YTD return reinforces this.
Related headlines
- Is Verizon Stock Counting On Money That Has Not Arrived Yet?
- Verizon Leads 6G Momentum with Nine New Forum Members and Successful Real-World ISAC and AI-Native Trials
- Switch to Verizon and get the new iPhone 18 Pro now. No trade-in needed. And get the latest iPhone every year.
- Is The Next Leg In Verizon Stock Riding On Customers Who Stay?
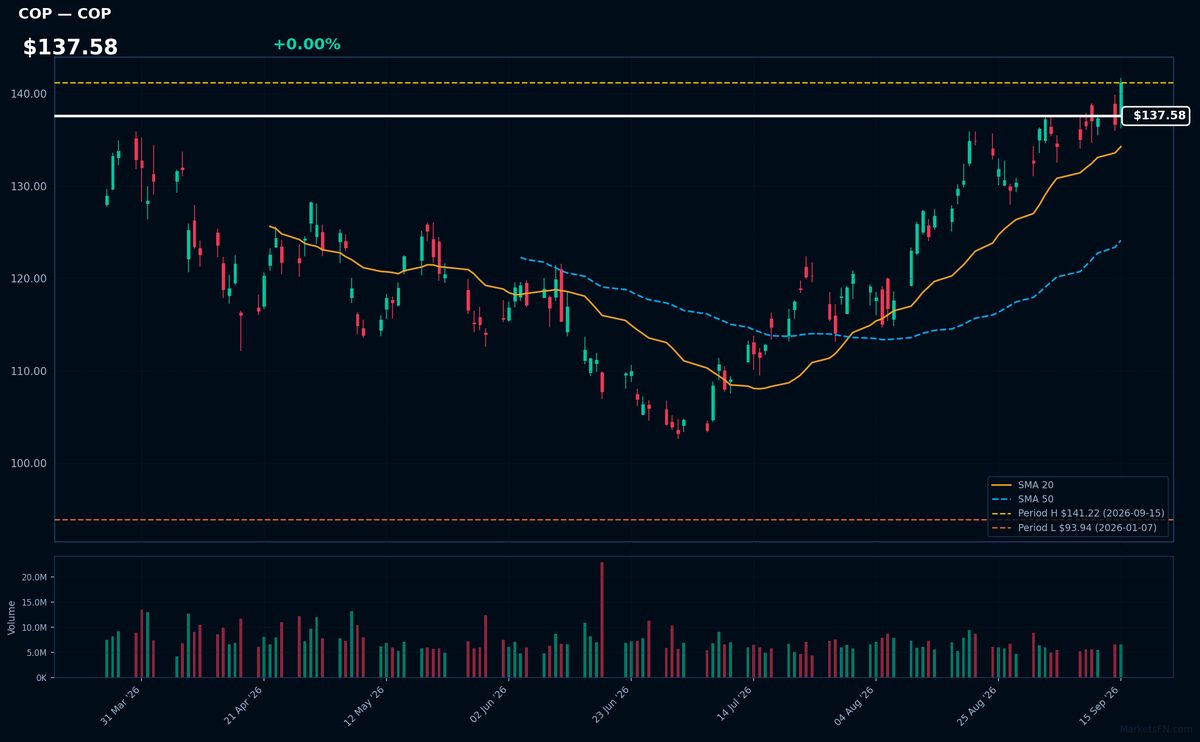
COP | Conoco Phillips | Energy | Price Last: $141.22 | % Realized: +46.04% | RSI: 61.7 | % above MA200: +23.4% | Trend: Above MA20, MA50, MA200
ConocoPhillips is an energy company focused on hydrocarbon exploration and production. Investors should care about its operational efficiency, reserve replacement, and ability to navigate energy transition trends, as these factors directly impact its long-term profitability and stock performance.
ConocoPhillips is in a sustained uptrend with price > MA20 > MA50 > MA200. The RSI(14) is 61.7, indicating strong momentum. The stock is 0.0% below its 2026 YTD high, suggesting a potential breakout, with a 46.0% return over the 2026 YTD period.
Related headlines
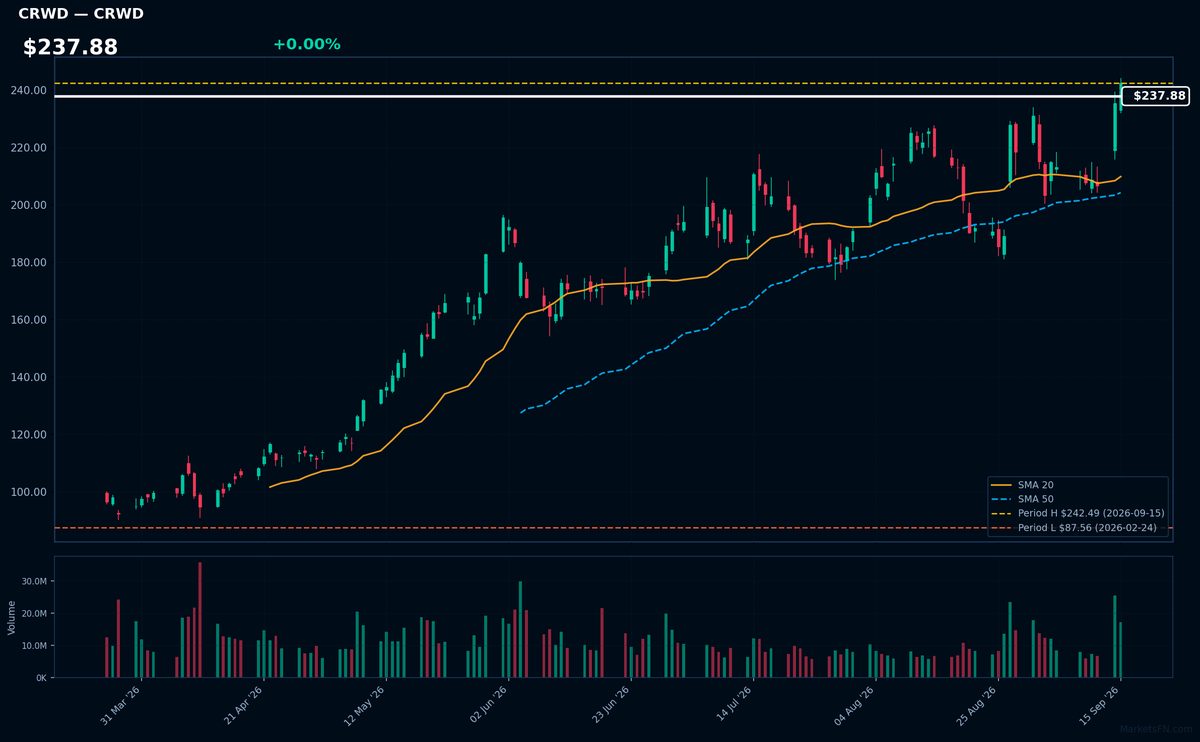
CRWD | Crowdstrike Holdings Inc | Technology | Price Last: $242.49 | % Realized: +113.85% | RSI: 61.9 | % above MA200: +66.3% | Trend: Above MA20, MA50, MA200
Crowdstrike Holdings Inc is a cybersecurity company providing cloud-delivered endpoint and cloud workload protection. Investors should care because its innovative solutions are in high demand, driving growth. Specific details about its products and services are not available in the given data.
Crowdstrike's current technical situation indicates strong momentum: RSI(14) is 61.9, and the stock exhibits a bullish MA alignment with price > MA20 > MA50 > MA200. It's near its 2026 YTD high, up 113.8% YTD.
Related headlines
- CrowdStrike Named the Only Customers Choice in the 2026 Gartner Peer Insights Voice of the Customer for Identity Threat Detection and Response (ITDR)
- Why Did DELL, CRWD, CVX Stocks Jump To 52-Week Highs Today?
- CRWD, PANW Stocks Extend AI-Fueled Rally As Cybersecurity Bets Outpace Software
- CrowdStrike CEO Warns AI Cyber Threat Is Already Here
📉 Nearest to 2026 Low
Sectors represented: Consumer Cyclical (3), Technology (1), Utilities (1)
| Ticker | Company | Sector | Price Last | % Realized | 2026 YTD Low Date | RSI | % above MA200 | Trend |
|---|---|---|---|---|---|---|---|---|
| TJX | TJX Companies, Inc | Consumer Cyclical | $124.60 | -19.24% | 2026-09-15 | 16.5 | -19.0% | Below MA20, MA50, MA200 |
| LOW | Lowe's Cos., Inc | Consumer Cyclical | $194.61 | -21.18% | 2026-09-15 | 36.1 | -17.2% | Below MA20, MA50, MA200 |
| NKE | Nike, Inc | Consumer Cyclical | $36.22 | -42.76% | 2026-09-15 | 34.4 | -28.3% | Below MA20, MA50, MA200 |
| SNPS | Synopsys, Inc | Technology | $367.70 | -23.46% | 2026-09-15 | 35.5 | -17.7% | Below MA20, MA50, MA200 |
| SO | Southern Company | Utilities | $85.95 | -1.41% | 2026-09-15 | 32.7 | -6.9% | Below MA20, MA50, MA200 |
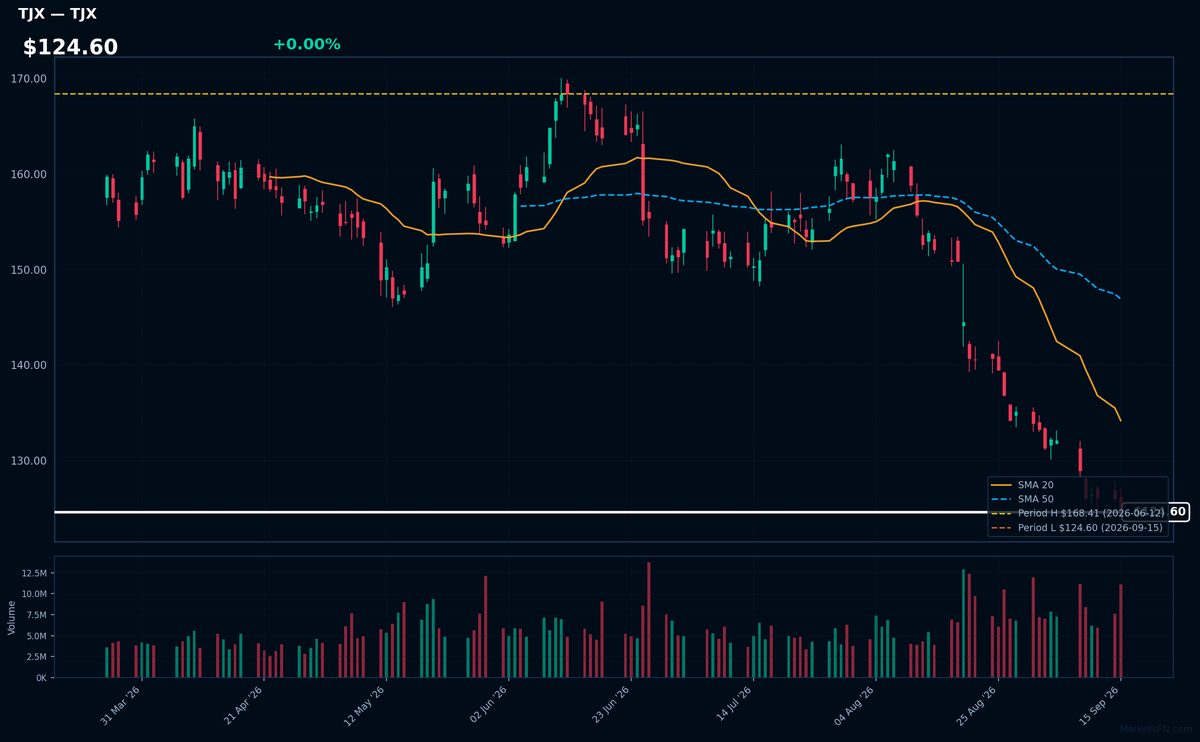
TJX | TJX Companies, Inc | Consumer Cyclical | Price Last: $124.60 | % Realized: -19.24% | RSI: 16.5 | % above MA200: -19.0% | Trend: Below MA20, MA50, MA200
TJX Companies, Inc operates off-price retail stores, offering brand-name merchandise at discounted prices. Investors should care about its ability to maintain margins and sales growth amidst changing consumer behavior and competitive pressures.
TJX is in a sustained downtrend with price ($124.60) below MA20, MA50, and MA200. The RSI(14) is 16.5, near oversold territory, and the stock is testing its 2026 YTD low, a potential warning sign.
Related headlines
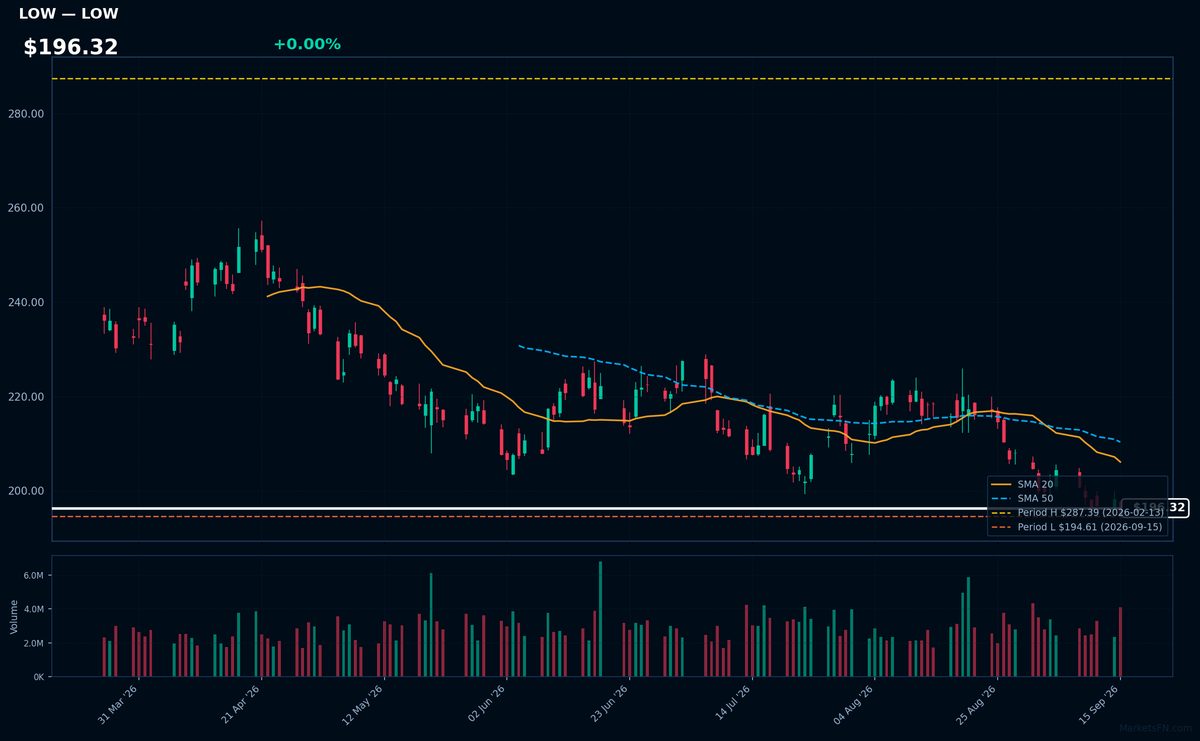
LOW | Lowe's Cos., Inc | Consumer Cyclical | Price Last: $194.61 | % Realized: -21.18% | RSI: 36.1 | % above MA200: -17.2% | Trend: Below MA20, MA50, MA200
Lowe's Cos., Inc is a home improvement retailer operating a chain of stores offering building materials, home decor, and appliances. Investors should care as its performance reflects housing market trends and consumer spending habits.
Lowe's is testing major support with a price 0.0% above its 2026 YTD low. The RSI(14) is 36.1, and MA alignment is bearish (price < MA20 < MA50 < MA200), indicating a sustained downtrend and potential further decline, a warning sign for investors.
Related headlines
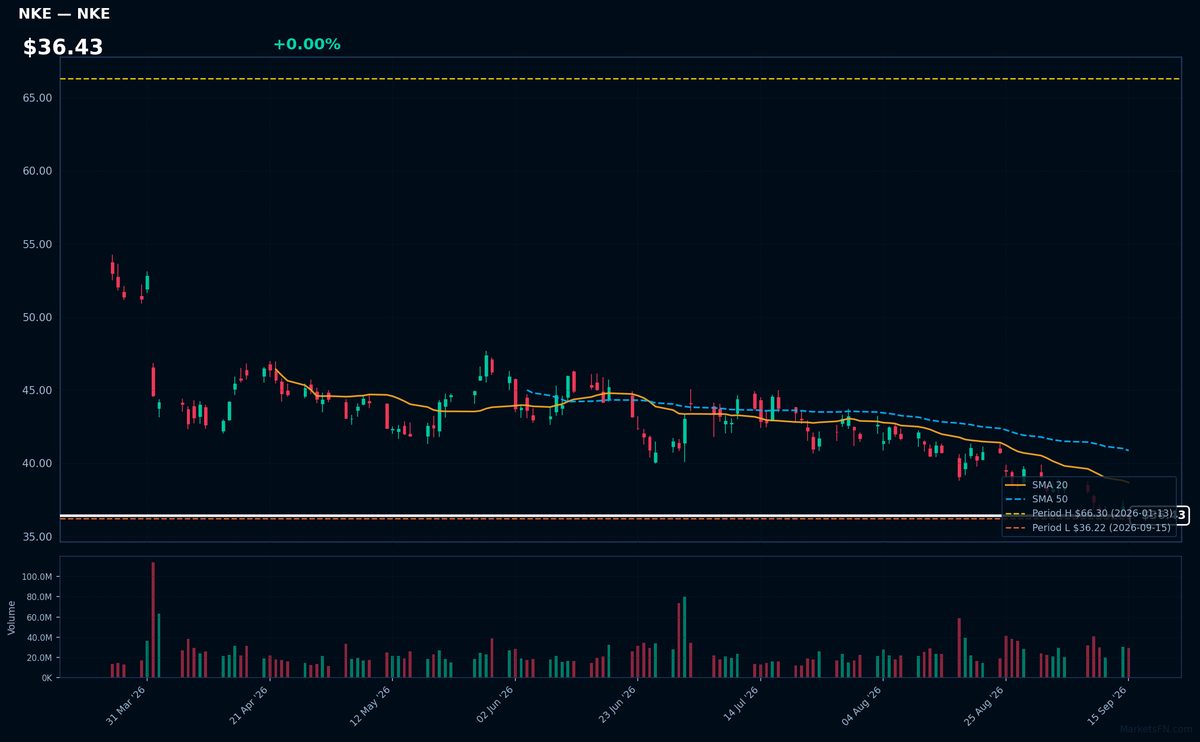
NKE | Nike, Inc | Consumer Cyclical | Price Last: $36.22 | % Realized: -42.76% | RSI: 34.4 | % above MA200: -28.3% | Trend: Below MA20, MA50, MA200
Nike, Inc designs and sells athletic footwear, apparel, and equipment. Investors should care because its brand strength and global distribution network drive revenue growth, while margin management and innovation impact profitability.
Nike's technicals indicate a sustained downtrend with price at $36.43 below all key MAs (MA20, MA50, MA200) and RSI(14) at 34.4, signaling bearish momentum; it's testing major support at its 2026 YTD low.
Related headlines
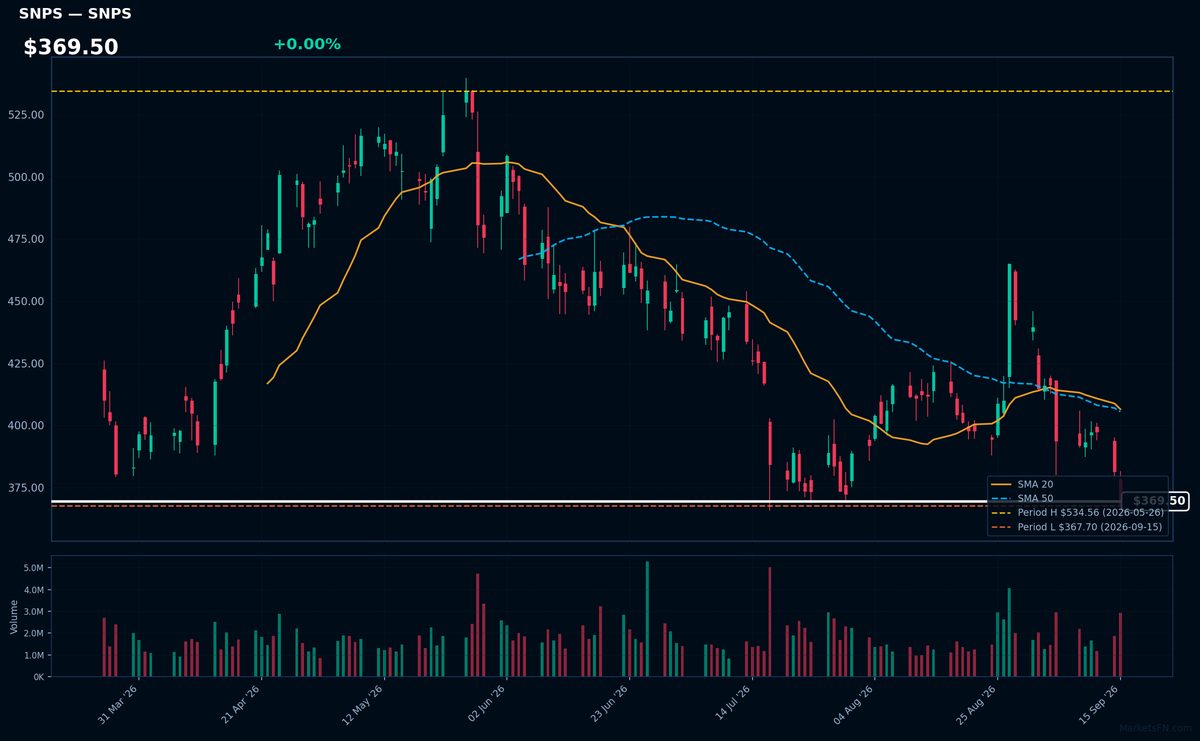
SNPS | Synopsys, Inc | Technology | Price Last: $367.70 | % Realized: -23.46% | RSI: 35.5 | % above MA200: -17.7% | Trend: Below MA20, MA50, MA200
Synopsys, Inc (SNPS) is a leading provider of electronic design automation (EDA) software and semiconductor intellectual property (IP), crucial for chip design and manufacturing. Investors care due to its dominant position in the growing semiconductor industry.
SNPS is testing major support with its price 0.0% above its 2026 YTD low. The RSI(14) is 35.5, indicating potential oversold conditions, and the stock is below MA20, MA50, and MA200, showing mixed signals and a bearish trend.
Related headlines
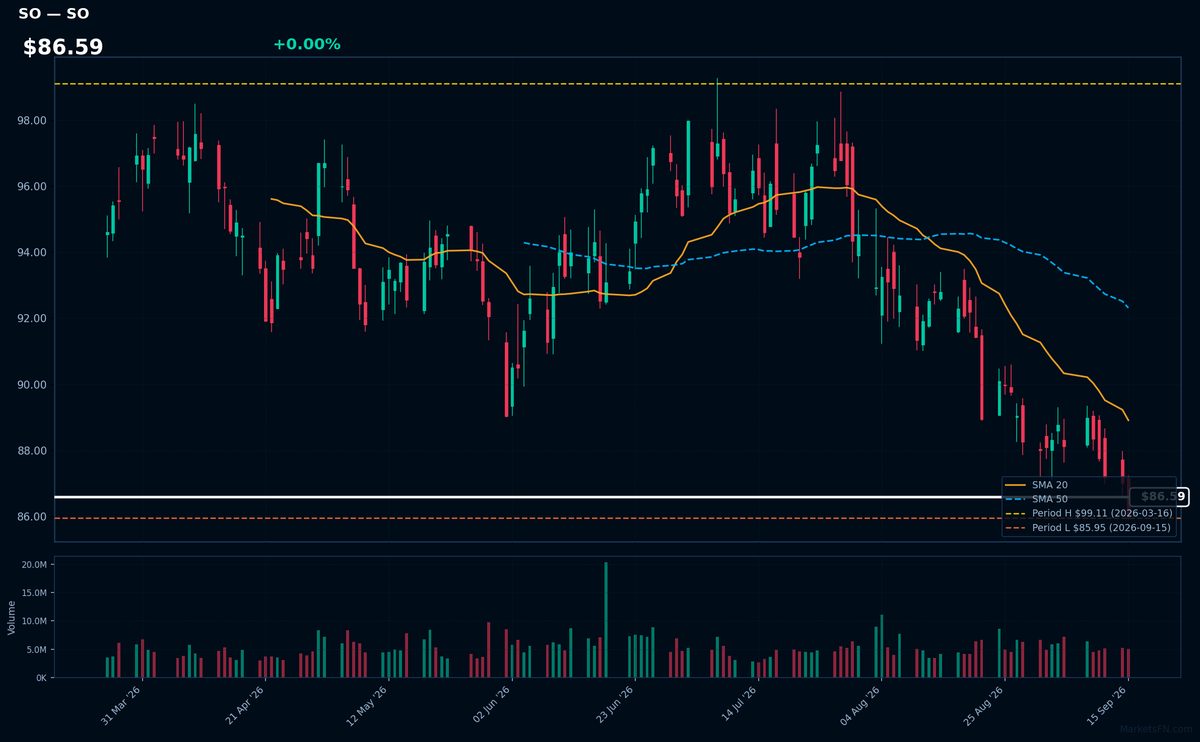
SO | Southern Company | Utilities | Price Last: $85.95 | % Realized: -1.41% | RSI: 32.7 | % above MA200: -6.9% | Trend: Below MA20, MA50, MA200
Southern Company is a large electric utility holding company. Investors should care because it provides essential services to a large customer base, and its stock performance can be influenced by regulatory changes, energy demand, and fuel prices.
Southern Company's technical situation is bearish, with an RSI(14) of 32.7 indicating oversold conditions. The stock is in a sustained downtrend, with price below MA20, MA50, and MA200, and is testing major support at its 2026 YTD low.
Related headlines
Market Commentary
The S&P 500 stocks listed are near their 2026 year-to-date (YTD) extremes, with some at their highs and others at their lows. Specifically, CVX, TMO, VZ, COP, and CRWD are at their 2026 YTD highs, while TJX, LOW, NKE, SNPS, and SO are at their 2026 YTD lows.
The stocks near their 2026 YTD highs span various sectors, including energy (CVX, COP), technology (CRWD, TMO), and telecommunications (VZ). In contrast, the stocks near their 2026 YTD lows are from retail (TJX, LOW, NKE), technology (SNPS), and utilities (SO). This divergence may indicate differing sectoral trends and market conditions, with energy and certain tech stocks performing strongly, while retail and utilities are under pressure.
Investors should monitor these stocks for signs of continued trend or reversal. As these stocks are at their YTD extremes, a breakout or reversal could signal broader market movements. Watching the performance of these stocks and their respective sectors will be crucial in understanding the overall market direction for the remainder of 2026.
Methodology: All 503 S&P 500 constituents screened. Close prices downloaded from 2026-01-01. Period high = highest close since Jan 1 2026; period low = lowest close since Jan 1 2026. Distance = (current price / period extreme − 1) × 100. Technical indicators computed on up to 1 year of daily OHLCV data.
Disclaimer: For informational purposes only. Not investment advice. Past performance is not indicative of future results.

