S&P 500 2026 YTD Highs & Lows Radar: Berkshire Hathaway (BRK-B), Paramount Skydance (PSKY) and more
MarketsFN Team

Screening all 503 S&P 500 constituents for stocks nearest to their 2026 year-to-date high and their 2026 YTD low. Data as of October 21, 2026. % Realized = total return since Jan 1 2026.
Legend: RSI > 70 = overbought · RSI < 30 = oversold · Green % Realized = positive YTD return · Red = negative.
📈 Nearest to 2026 High
Sectors represented: Financial (3), Healthcare (2)
| Ticker | Company | Sector | Price Last | % Realized | 2026 YTD High Date | RSI | % above MA200 | Trend |
|---|---|---|---|---|---|---|---|---|
| BRK-B | Berkshire Hathaway Inc | Financial | $539.82 | +8.65% | 2026-10-20 | 80.1 | +9.2% | Above MA20, MA50, MA200 |
| LLY | Lilly(Eli) & Co | Healthcare | $1283.66 | +18.82% | 2026-10-20 | 65.9 | +18.5% | Above MA20, MA50, MA200 |
| V | Visa Inc | Financial | $406.57 | +17.34% | 2026-10-20 | 74.1 | +19.6% | Above MA20, MA50, MA200 |
| MA | Mastercard Incorporated | Financial | $620.42 | +10.17% | 2026-10-20 | 74.4 | +16.2% | Above MA20, MA50, MA200 |
| ABBV | Abbvie Inc | Healthcare | $289.08 | +26.07% | 2026-10-20 | 68.9 | +23.1% | Above MA20, MA50, MA200 |
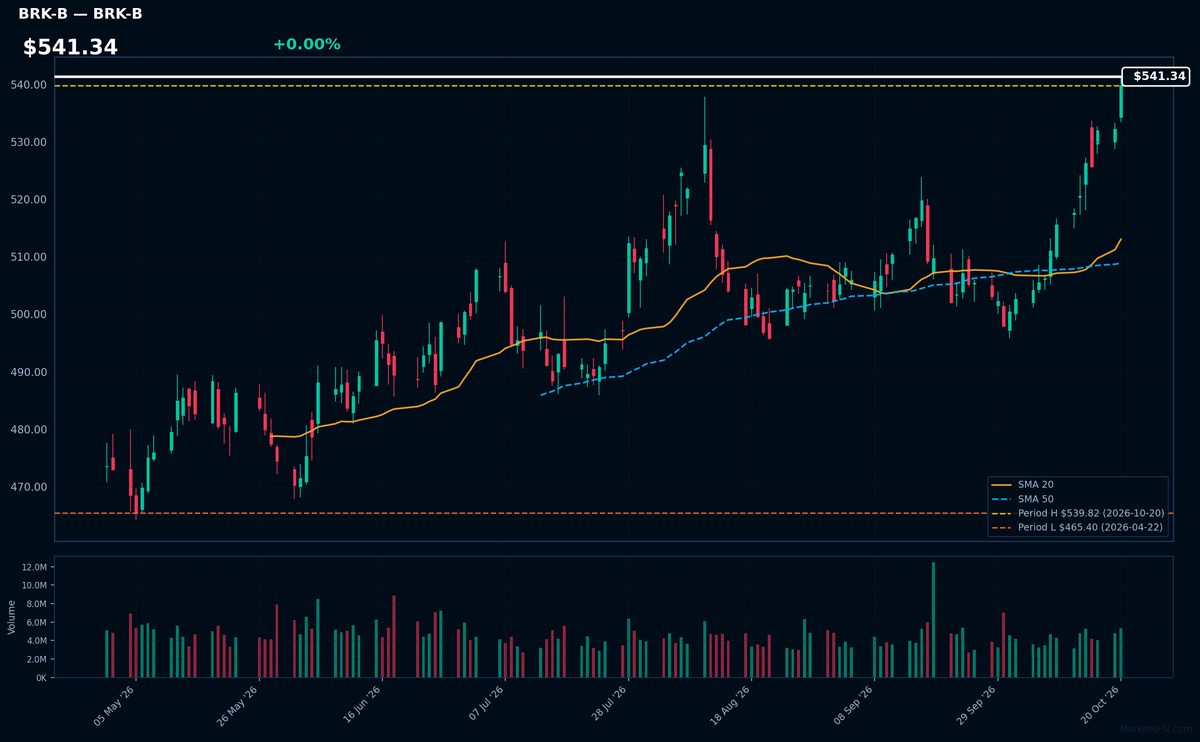
BRK-B | Berkshire Hathaway Inc | Financial | Price Last: $539.82 | % Realized: +8.65% | RSI: 80.1 | % above MA200: +9.2% | Trend: Above MA20, MA50, MA200
Berkshire Hathaway operates a diversified portfolio of wholly-owned businesses (insurance, utilities, manufacturing) and major equity stakes (Apple, Bank of America). Investors care for its unique capital allocation under Warren Buffett's philosophy, combining cash-generating subsidiaries with opportunistic public market investments.
Technically overbought (RSI 80.1) but in strong uptrend (price > MA20 > MA50 > MA200). The 8.6% YTD gain tests 2026 highs — momentum extreme that warrants caution despite bullish structure.
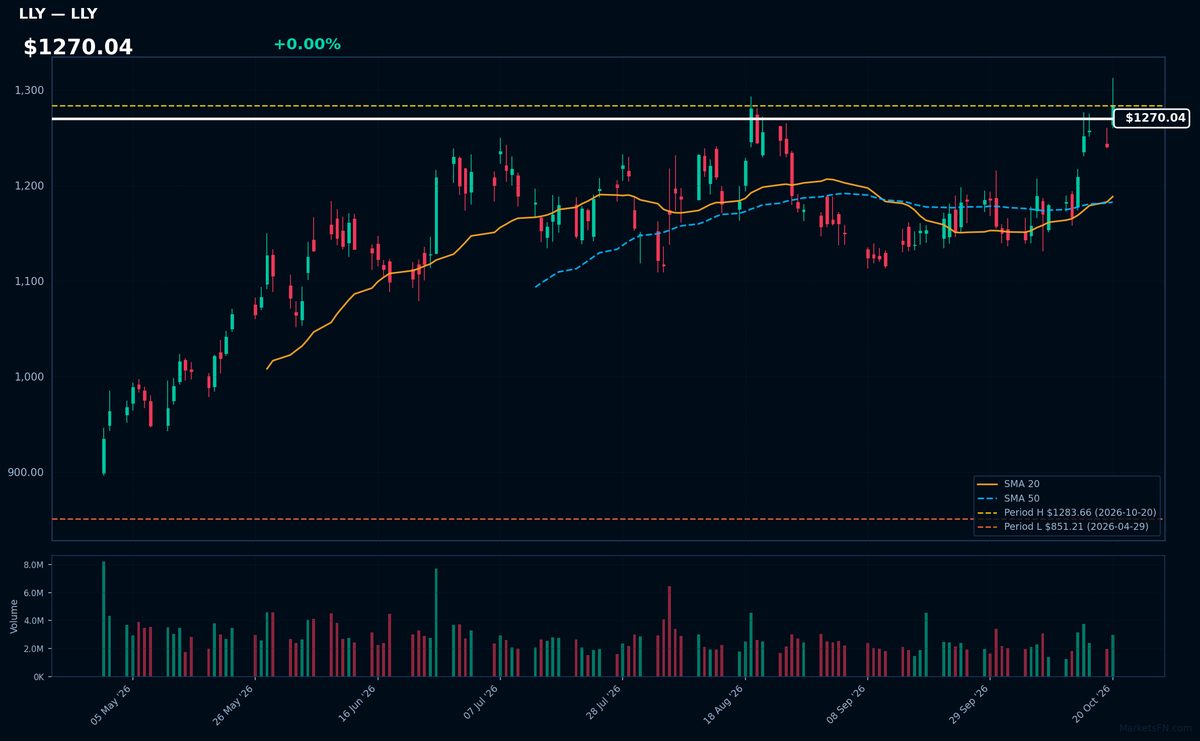
LLY | Lilly(Eli) & Co | Healthcare | Price Last: $1283.66 | % Realized: +18.82% | RSI: 65.9 | % above MA200: +18.5% | Trend: Above MA20, MA50, MA200
Lilly(Eli) & Co develops blockbuster drugs like diabetes/obesity treatments Mounjaro and Zepbound, driving revenue growth. Investors care because its pipeline addresses high-demand chronic conditions with strong pricing power in pharma.
LLY shows bullish momentum with RSI(14) at 65.9 and price > MA20 > MA50 > MA200. At 18.8% YTD return, it tests 2026 highs (0.0% below) — watch for breakout confirmation.
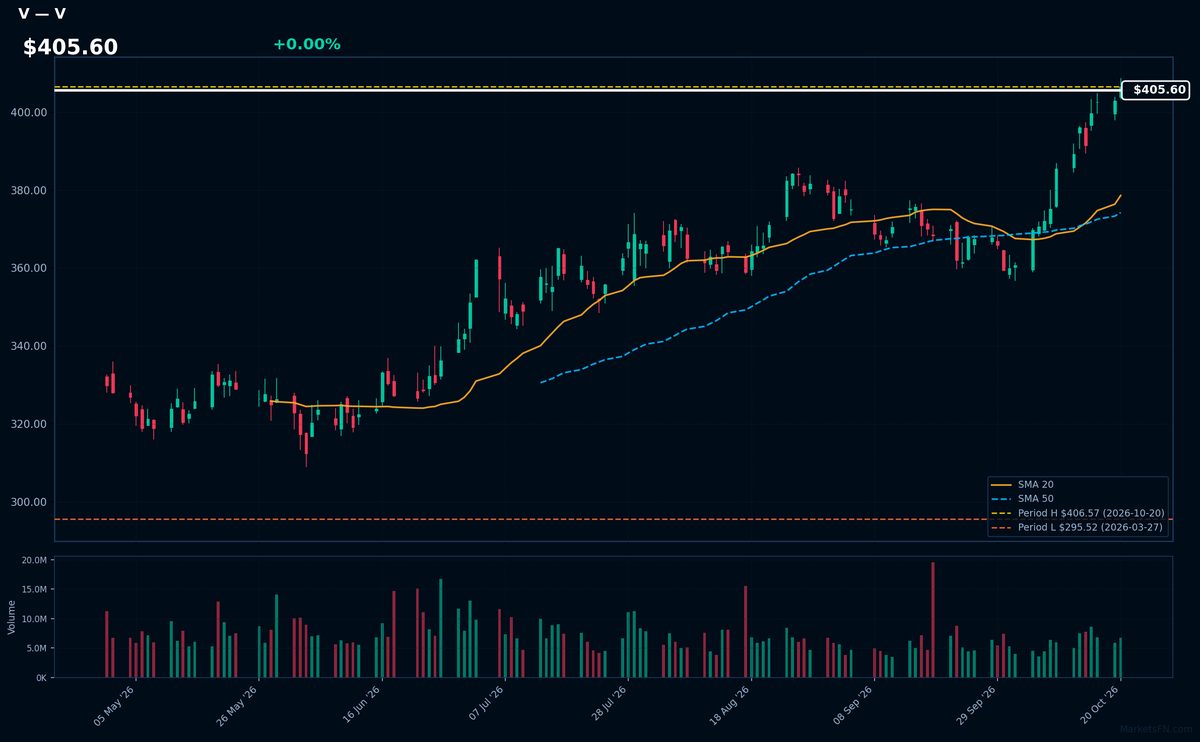
V | Visa Inc | Financial | Price Last: $406.57 | % Realized: +17.34% | RSI: 74.1 | % above MA200: +19.6% | Trend: Above MA20, MA50, MA200
Visa operates the world's largest electronic payments network, processing over $15 trillion annually. Investors care because its asset-light model generates 60%+ operating margins as global cashless adoption grows, with pricing power from its entrenched duopoly position alongside Mastercard in card networks.
Visa trades at $405.60 with extreme bullish momentum: RSI(14) at 74.1 (overbought) while maintaining a bullish MA alignment (price > MA20 > MA50 > MA200). The 17.3% YTD gain brings it to 0.0% below its 2026 high — a potential breakout level, though elevated RSI warrants caution.
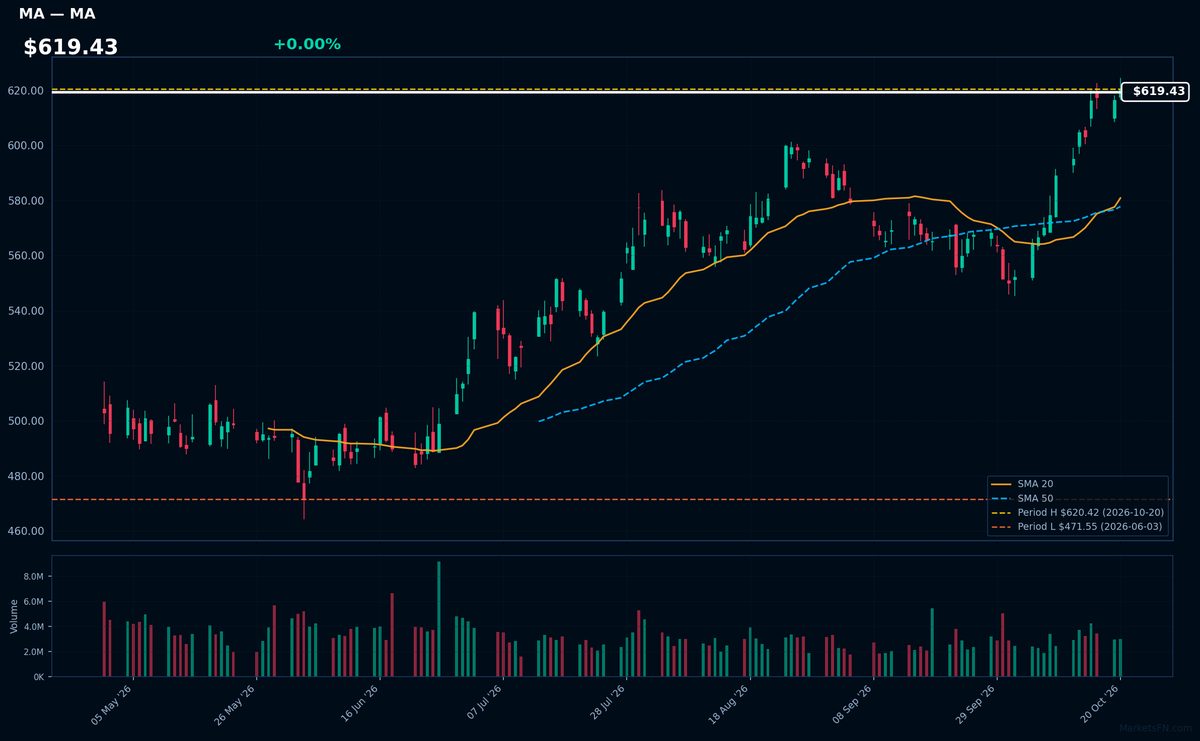
MA | Mastercard Incorporated | Financial | Price Last: $620.42 | % Realized: +10.17% | RSI: 74.4 | % above MA200: +16.2% | Trend: Above MA20, MA50, MA200
Mastercard operates the world's second-largest payment network, processing $9.9 trillion in annual transaction volume. Investors care because its asset-light model converts global digital payment growth into 30%+ operating margins with minimal capital expenditure.
Technically overbought (RSI 74.4) but bullish MA alignment (price > MA20 > MA50 > MA200) suggests sustained momentum. At YTD highs after 10.2% gain, watch for breakout confirmation.
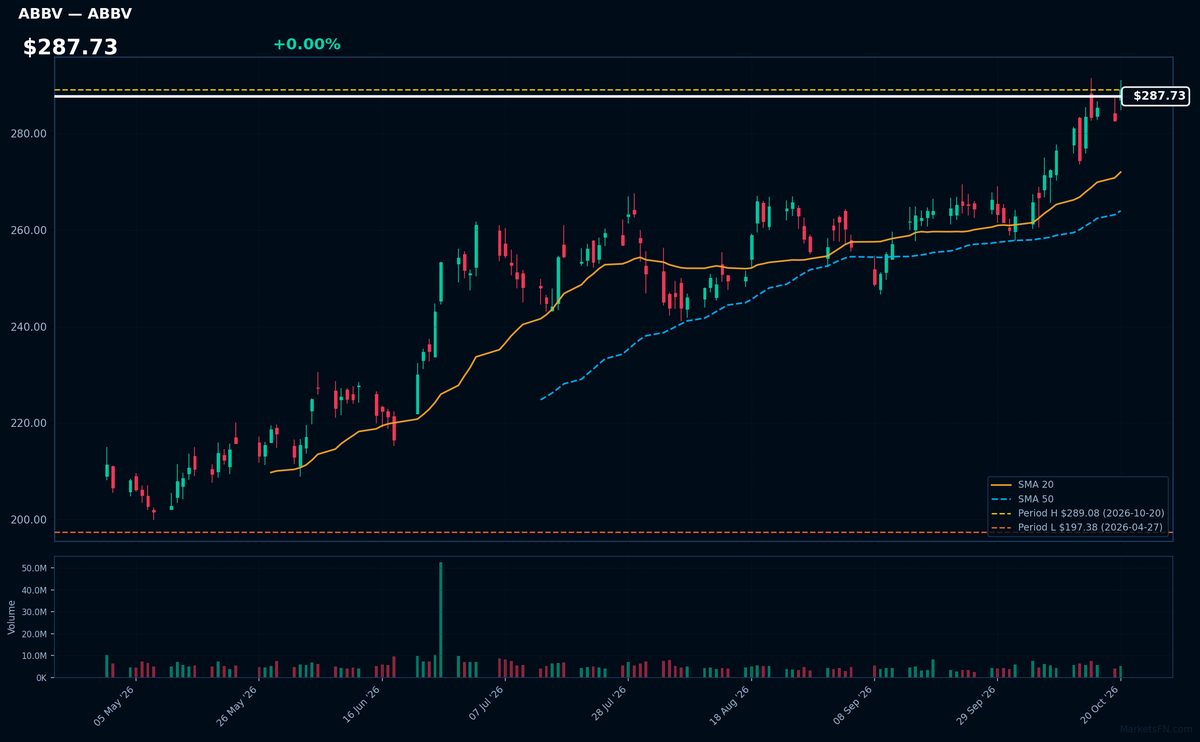
ABBV | Abbvie Inc | Healthcare | Price Last: $289.08 | % Realized: +26.07% | RSI: 68.9 | % above MA200: +23.1% | Trend: Above MA20, MA50, MA200
AbbVie Inc develops and markets immunology, oncology, and neuroscience therapies, including blockbuster drug Humira. Investors watch its pipeline for patent expirations and new drug approvals that drive pharmaceutical revenue streams.
ABBV shows bullish momentum with price at $287.73 above all key MAs (20/50/200) and RSI(14) at 68.9 nearing overbought. The 26.1% YTD gain suggests sustained uptrend, though proximity to YTD highs warrants caution.
📉 Nearest to 2026 Low
Sectors represented: Basic Materials (2), Communication Services (1), Consumer Cyclical (1), Industrials (1)
| Ticker | Company | Sector | Price Last | % Realized | 2026 YTD Low Date | RSI | % above MA200 | Trend |
|---|---|---|---|---|---|---|---|---|
| PSKY | Paramount Skydance Corp | Communication Services | $6.91 | -13.08% | 2026-10-16 | 34.7 | — | — |
| MOS | Mosaic Company | Basic Materials | $17.86 | -28.62% | 2026-10-20 | 25.8 | -26.1% | Below MA20, MA50, MA200 |
| LKQ | LKQ Corp | Consumer Cyclical | $21.53 | -28.31% | 2026-10-19 | 32.3 | -22.2% | Below MA20, MA50, MA200 |
| ALB | Albemarle Corp | Basic Materials | $95.77 | -33.46% | 2026-10-19 | 27.0 | -37.2% | Below MA20, MA50, MA200 |
| PNR | Pentair plc | Industrials | $52.88 | -49.86% | 2026-10-14 | 37.7 | -31.9% | Above MA20 · Below MA50, MA200 |
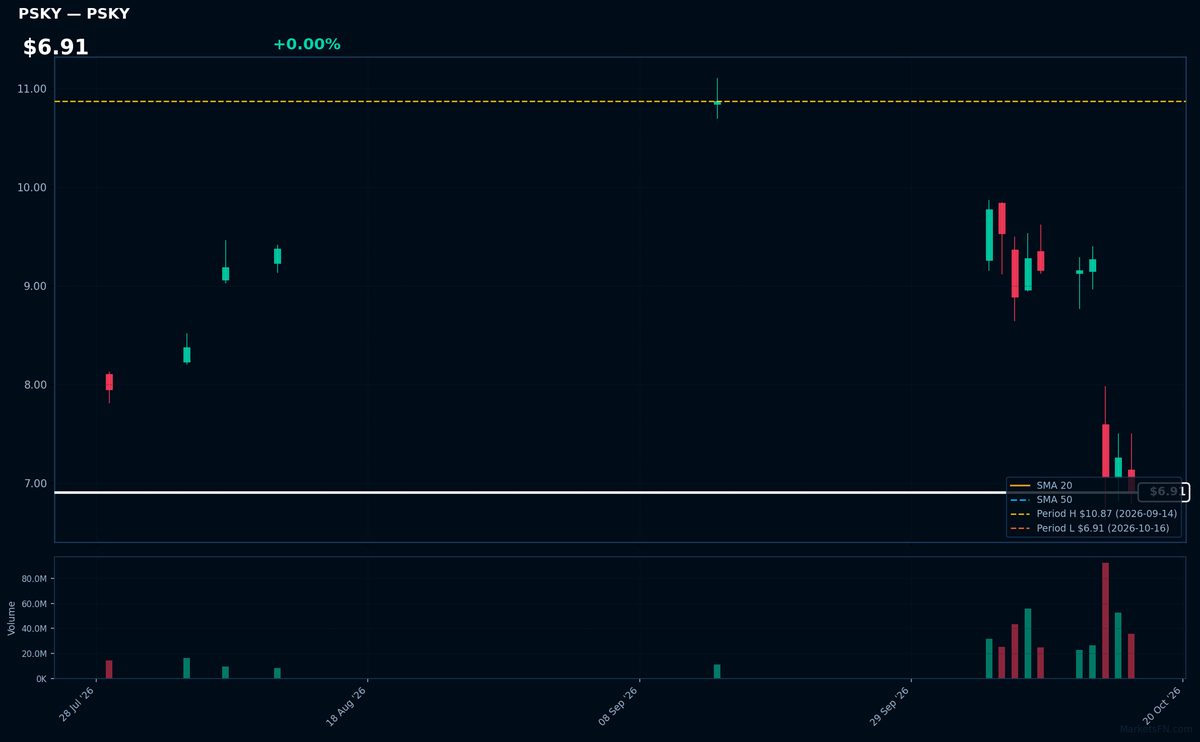
PSKY | Paramount Skydance Corp | Communication Services | Price Last: $6.91 | % Realized: -13.08% | RSI: 34.7 | % above MA200: — | Trend: —
Paramount Skydance Corp operates in [industry not specified in data]. Investors should monitor its [specific catalyst not stated in data] given its distressed technical setup at $6.91, though fundamental drivers are unclear from provided metrics.
PSKY trades just 0.0% above its 2026 low with RSI(14) at 34.7 (approaching oversold) and YTD return of -13.1%. MA alignment data is incomplete, but the extreme proximity to support suggests capitulation risk outweighs momentum potential.
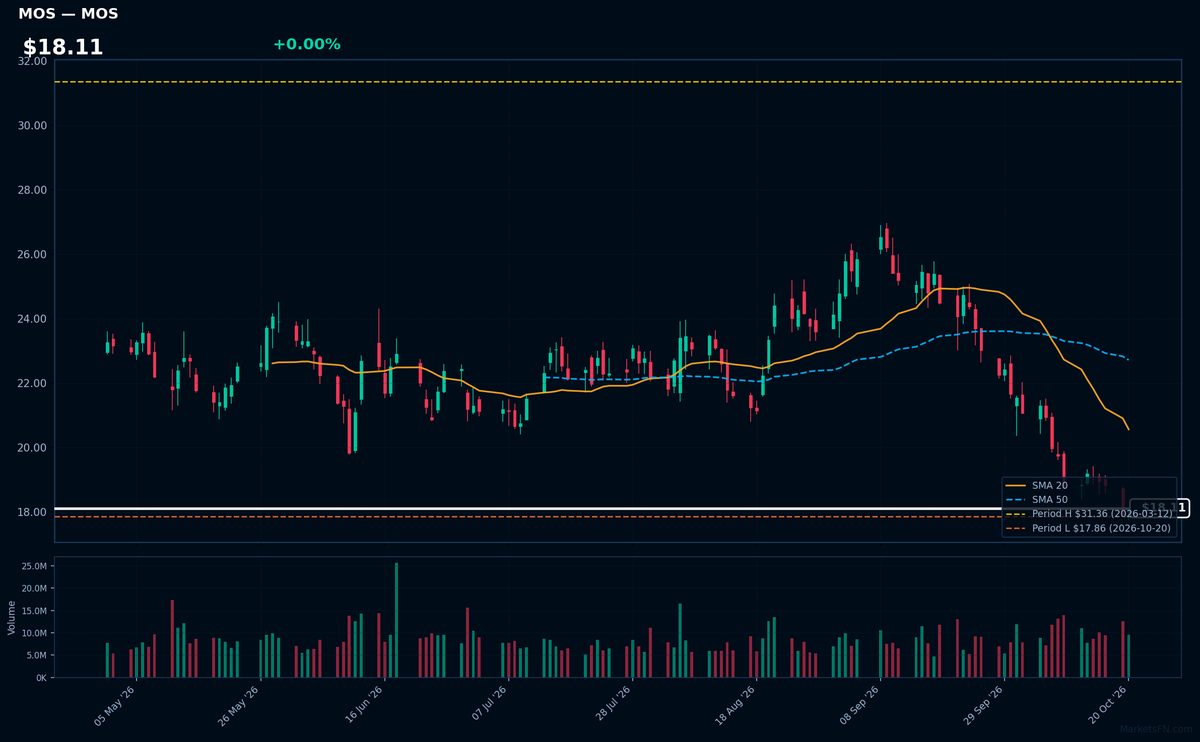
MOS | Mosaic Company | Basic Materials | Price Last: $17.86 | % Realized: -28.62% | RSI: 25.8 | % above MA200: -26.1% | Trend: Below MA20, MA50, MA200
Mosaic Company produces concentrated phosphate and potash crop nutrients for global agriculture. Investors monitor MOS as a pure-play fertilizer stock with direct exposure to agricultural commodity cycles and food security trends, currently trading at $18.11.
MOS shows extreme technical weakness: RSI(14) at 25.8 (oversold) with bearish MA alignment (price < MA20 < MA50 < MA200). The stock tests 2026 lows after a -28.6% YTD plunge, signaling severe downtrend momentum. No support evident at current levels.
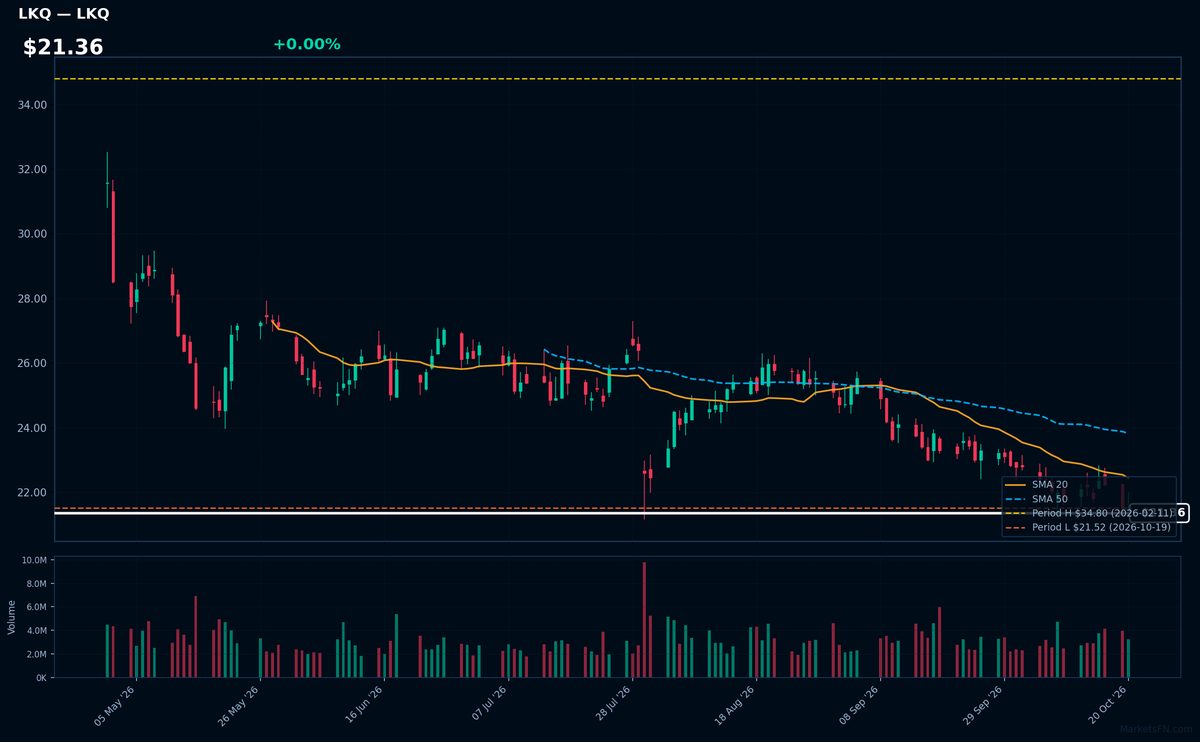
LKQ | LKQ Corp | Consumer Cyclical | Price Last: $21.53 | % Realized: -28.31% | RSI: 32.3 | % above MA200: -22.2% | Trend: Below MA20, MA50, MA200
LKQ Corp supplies replacement parts for vehicles, specializing in aftermarket and recycled components. Investors care because its business model thrives when consumers opt for cheaper alternatives to OEM parts during economic downturns or high inflation periods.
LKQ shows extreme technical weakness: RSI(14) at 32.3 signals near-oversold conditions, while the bearish MA alignment (price < MA20 < MA50 < MA200) confirms a sustained downtrend. The stock tests 2026 lows after a -28.3% YTD plunge — a clear warning sign.
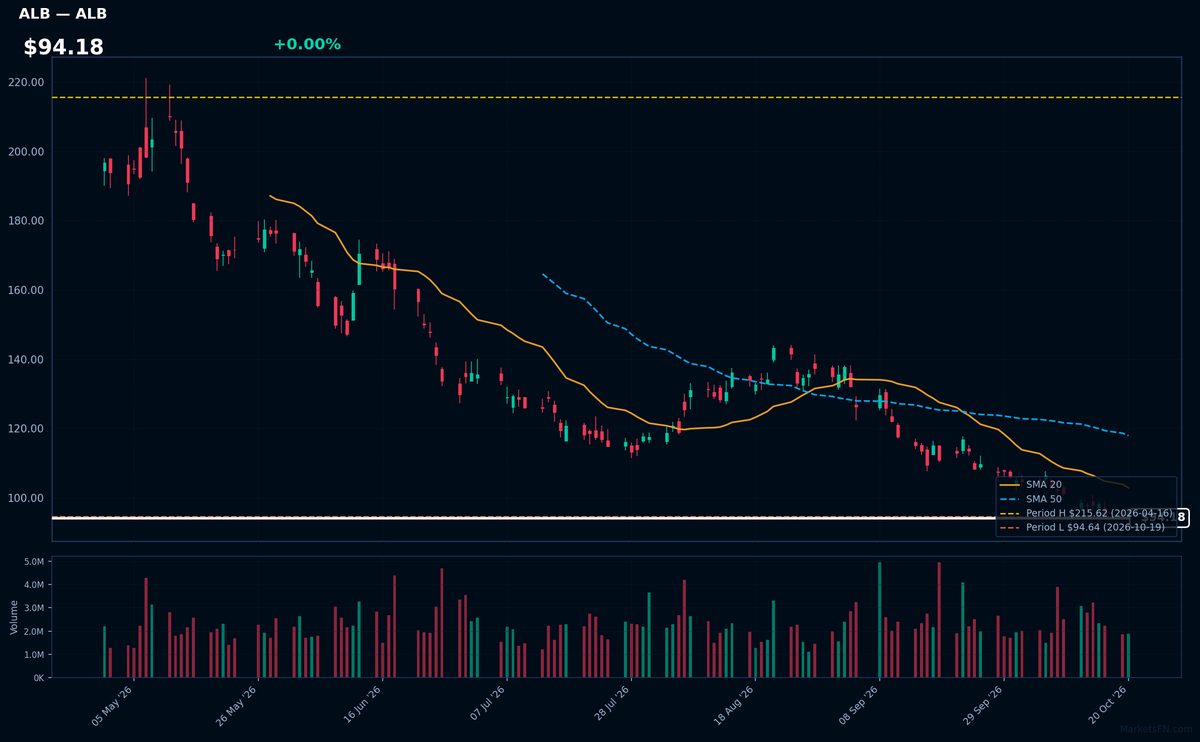
ALB | Albemarle Corp | Basic Materials | Price Last: $95.77 | % Realized: -33.46% | RSI: 27.0 | % above MA200: -37.2% | Trend: Below MA20, MA50, MA200
Albemarle Corp is a leading global producer of lithium, bromine, and catalysts critical for electric vehicle batteries, flame retardants, and refining. Investors watch ALB as a key EV supply chain play with volatile exposure to lithium price swings and energy transition demand.
ALB trades at $94.18 with extreme technical weakness: RSI(14) at 27.0 (oversold) and bearish MA alignment (price < MA20 < MA50 < MA200). Down 33.5% YTD and just 1.2% above 2026 lows, this signals severe breakdown risk, not momentum.
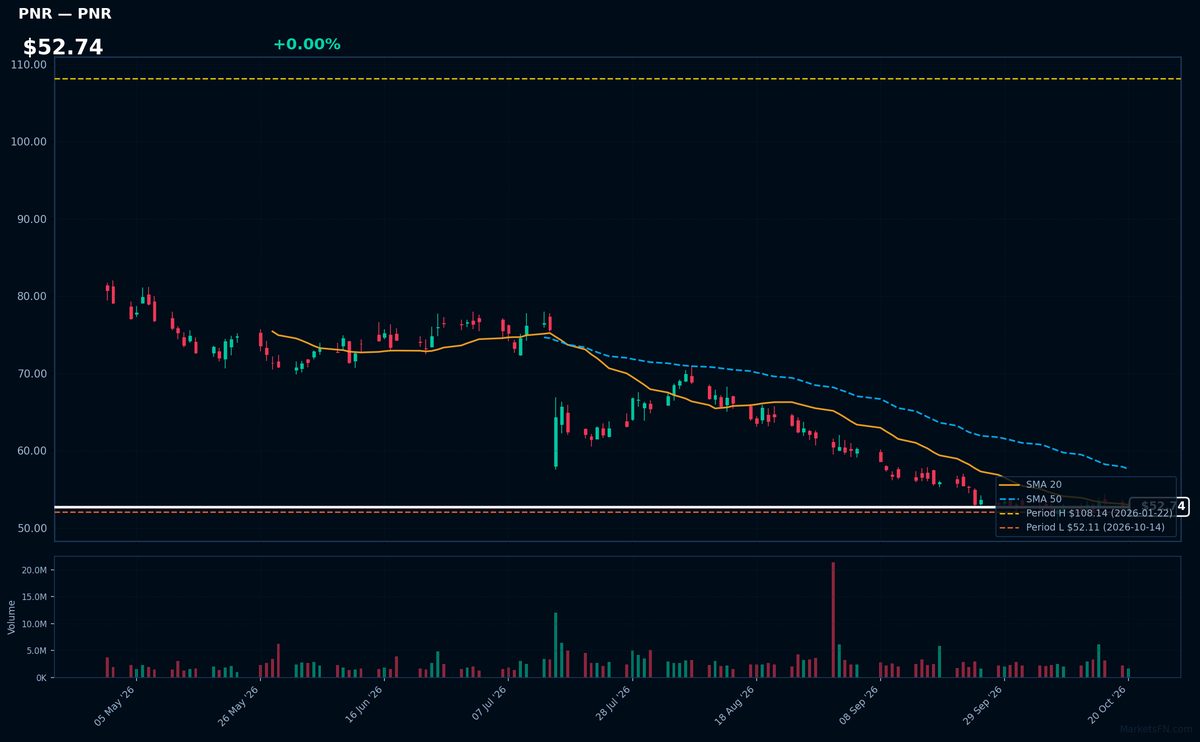
PNR | Pentair plc | Industrials | Price Last: $52.88 | % Realized: -49.86% | RSI: 37.7 | % above MA200: -31.9% | Trend: Above MA20 · Below MA50, MA200
Pentair plc specializes in water treatment and sustainable solutions, including pool equipment and industrial filtration systems. Investors should monitor its exposure to cyclical construction demand and water infrastructure spending, which drive revenue.
PNR shows severe technical weakness: RSI(14) at 37.7 signals near-oversold conditions, while a sustained downtrend (price < MA20 < MA50 < MA200) and -49.9% YTD decline warn of persistent selling pressure. Trading just 1.5% above YTD lows risks breakdown.
Market Commentary
The S&P 500 stocks trading near their 2026 highs—Berkshire Hathaway (BRK-B), Eli Lilly (LLY), Visa (V), Mastercard (MA), and AbbVie (ABBV)—reflect sustained investor confidence in defensive, high-quality names with strong cash flows and pricing power. These companies span healthcare, payments, and conglomerates, sectors that typically outperform in uncertain economic environments. Conversely, stocks near lows—Paramount Skydance (PSKY), Mosaic (MOS), LKQ (LKQ), Albemarle (ALB), and Pentair (PNR)—highlight weakness in cyclical sectors like materials, industrials, and media, where earnings are more sensitive to macroeconomic pressures.
The divergence underscores a market favoring stability over cyclical growth, likely driven by concerns over slowing global demand, higher interest rates, or sector-specific headwinds. For instance, Albemarle and Mosaic face challenges from volatile commodity prices, while Paramount struggles with streaming competition. Meanwhile, the resilience of payment networks (V, MA) and pharma (LLY, ABBV) suggests investors are prioritizing recurring revenue streams and innovation pipelines.
Investors should monitor macroeconomic indicators (e.g., inflation, Fed policy) for shifts in sector leadership, as well as company-specific catalysts like AbbVie’s drug pipeline or Albemarle’s lithium demand. A rotation into beaten-down cyclicals could signal improving growth expectations, while further strength in defensives may indicate prolonged caution.
Methodology: All 503 S&P 500 constituents screened. Close prices downloaded from 2026-01-01. Period high = highest close since Jan 1 2026; period low = lowest close since Jan 1 2026. Distance = (current price / period extreme − 1) × 100. Technical indicators computed on up to 1 year of daily OHLCV data.
Disclaimer: For informational purposes only. Not investment advice. Past performance is not indicative of future results.