S&P 500 2026 YTD Highs & Lows Radar: Apple (AAPL), Prologis (PLD) and more
MarketsFN Team

Screening all 503 S&P 500 constituents for stocks nearest to their 2026 year-to-date high and their 2026 YTD low. Data as of October 19, 2026. % Realized = total return since Jan 1 2026.
Legend: RSI > 70 = overbought · RSI < 30 = oversold · Green % Realized = positive YTD return · Red = negative.
📈 Nearest to 2026 High
Sectors represented: Financial (3), Technology (1), Energy (1)
| Ticker | Company | Sector | Price Last | % Realized | 2026 YTD High Date | RSI | % above MA200 | Trend |
|---|---|---|---|---|---|---|---|---|
| AAPL | Apple Inc | Technology | $343.46 | +26.73% | 2026-10-16 | 62.3 | +17.3% | Above MA20, MA50, MA200 |
| BRK-B | Berkshire Hathaway Inc | Financial | $532.02 | +7.08% | 2026-10-16 | 72.3 | +7.8% | Above MA20, MA50, MA200 |
| V | Visa Inc | Financial | $402.61 | +16.20% | 2026-10-16 | 72.1 | +18.6% | Above MA20, MA50, MA200 |
| MA | Mastercard Incorporated | Financial | $617.42 | +9.64% | 2026-10-16 | 72.9 | +15.8% | Above MA20, MA50, MA200 |
| XOM | Exxon Mobil Corp | Energy | $178.98 | +45.93% | 2026-10-16 | 70.8 | +17.7% | Above MA20, MA50, MA200 |
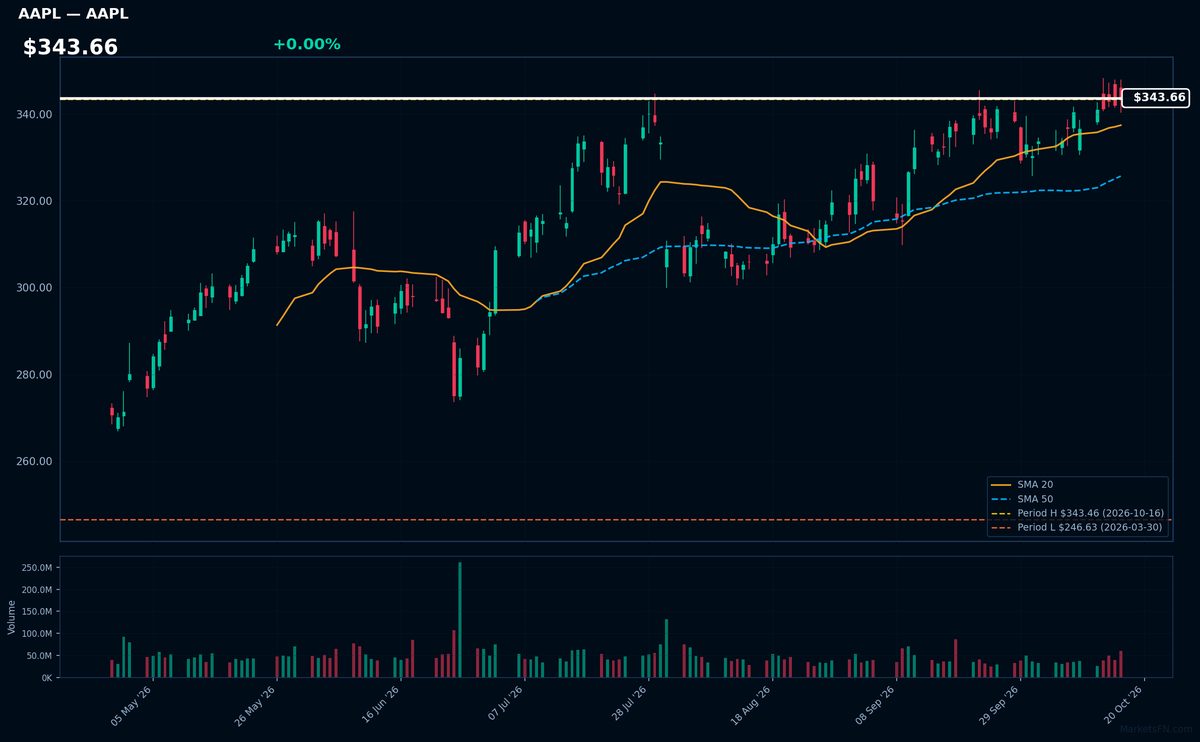
AAPL | Apple Inc | Technology | Price Last: $343.46 | % Realized: +26.73% | RSI: 62.3 | % above MA200: +17.3% | Trend: Above MA20, MA50, MA200
Apple designs premium consumer electronics (iPhone, Mac, Apple Watch) and operates high-margin services (App Store, iCloud, Apple Music). Investors care because it dominates the premium device market with 1.8B active devices and converts this into recurring services revenue.
AAPL shows strong uptrend (price > MA20 > MA50 > MA200) with RSI(14) at 62.3 — approaching overbought but not extreme. Stock tests 2026 highs (+26.7% YTD), suggesting momentum continuation if breakout holds. Monitor RSI for potential exhaustion.
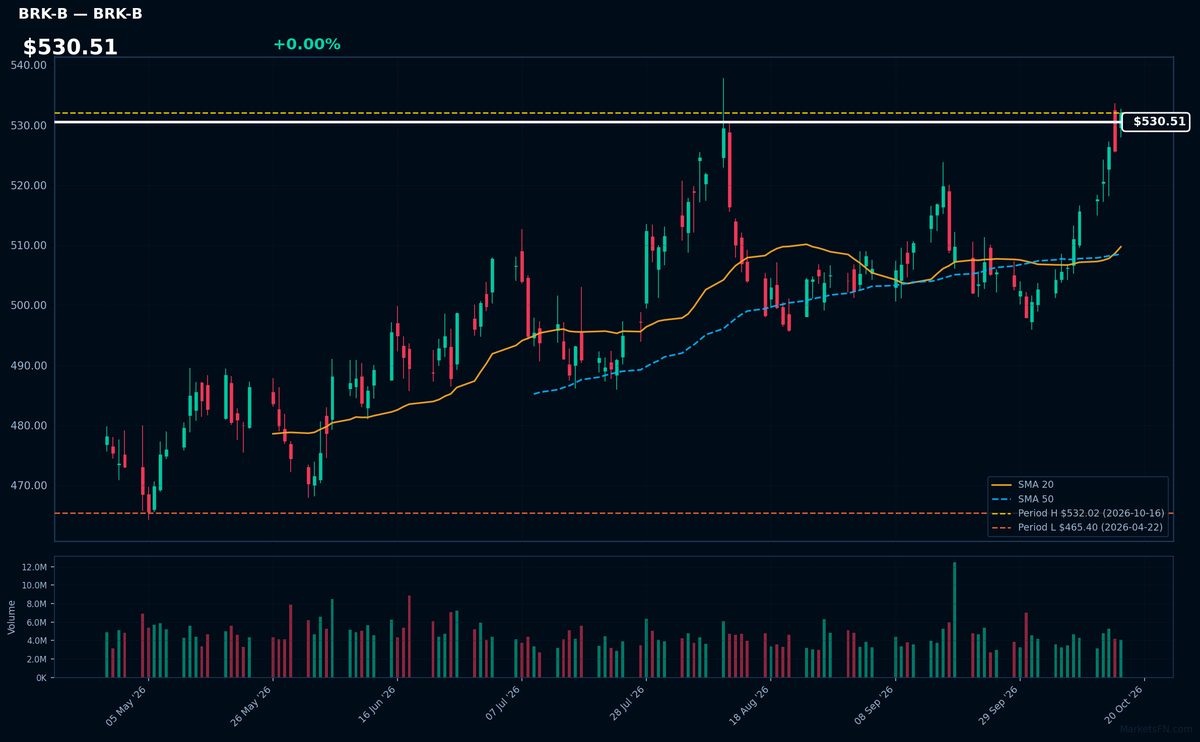
BRK-B | Berkshire Hathaway Inc | Financial | Price Last: $532.02 | % Realized: +7.08% | RSI: 72.3 | % above MA200: +7.8% | Trend: Above MA20, MA50, MA200
Berkshire Hathaway is a diversified holding company with major insurance operations (GEICO, reinsurance) and wholly-owned businesses across railroads (BNSF), energy, manufacturing, and retail. Investors care for its long-term capital allocation by Warren Buffett and now Greg Abel, compounding value through acquisitions and public equities like Apple.
BRK-B shows strong momentum with RSI(14) at 72.3 (near overbought) and bullish MA alignment (price > MA20 > MA50 > MA200). At 0.0% below its YTD high after a 7.1% YTD gain, it tests breakout levels — watch for continuation or exhaustion.
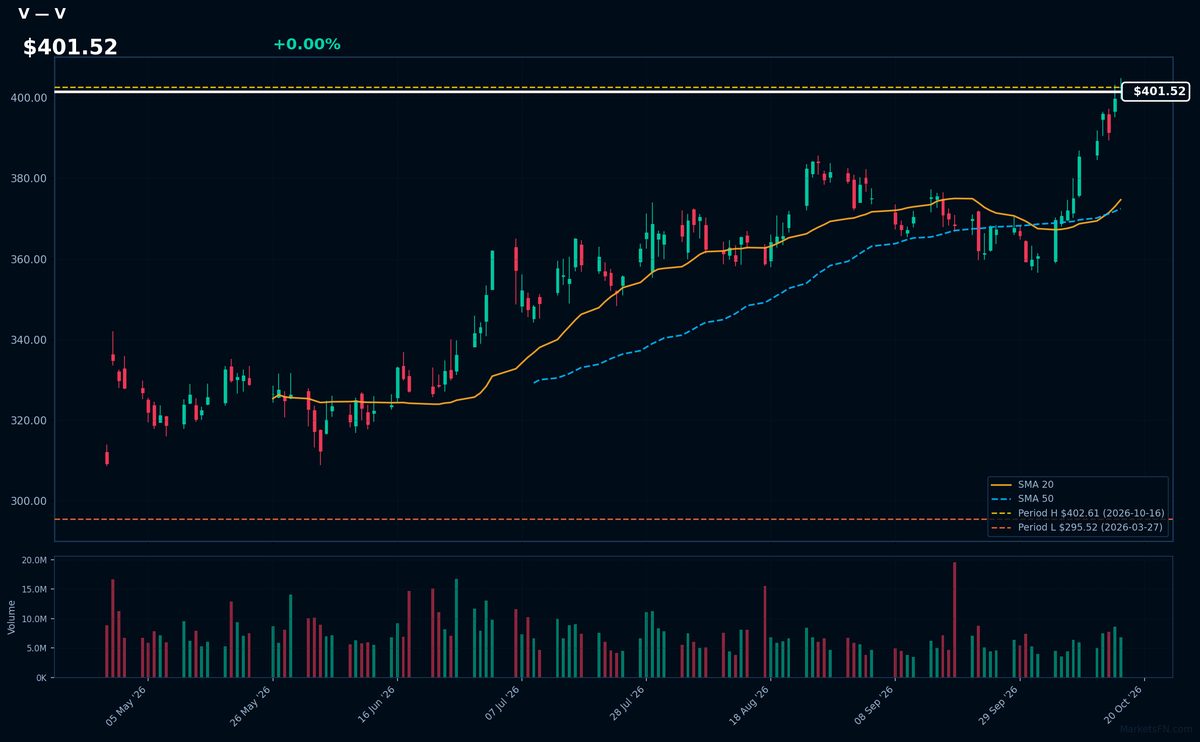
V | Visa Inc | Financial | Price Last: $402.61 | % Realized: +16.20% | RSI: 72.1 | % above MA200: +18.6% | Trend: Above MA20, MA50, MA200
Visa operates the world's largest electronic payments network, processing over $14 trillion annually. Investors care because its asset-light model (taking 0.15% of each transaction) scales globally with minimal marginal cost, driving consistent double-digit earnings growth.
Technically bullish with price ($401.52) above all key MAs and RSI(14) at 72.1 (overbought but confirming strong momentum). The 16.2% YTD gain suggests continuation potential, though near YTD highs (0.0% below) may invite profit-taking.
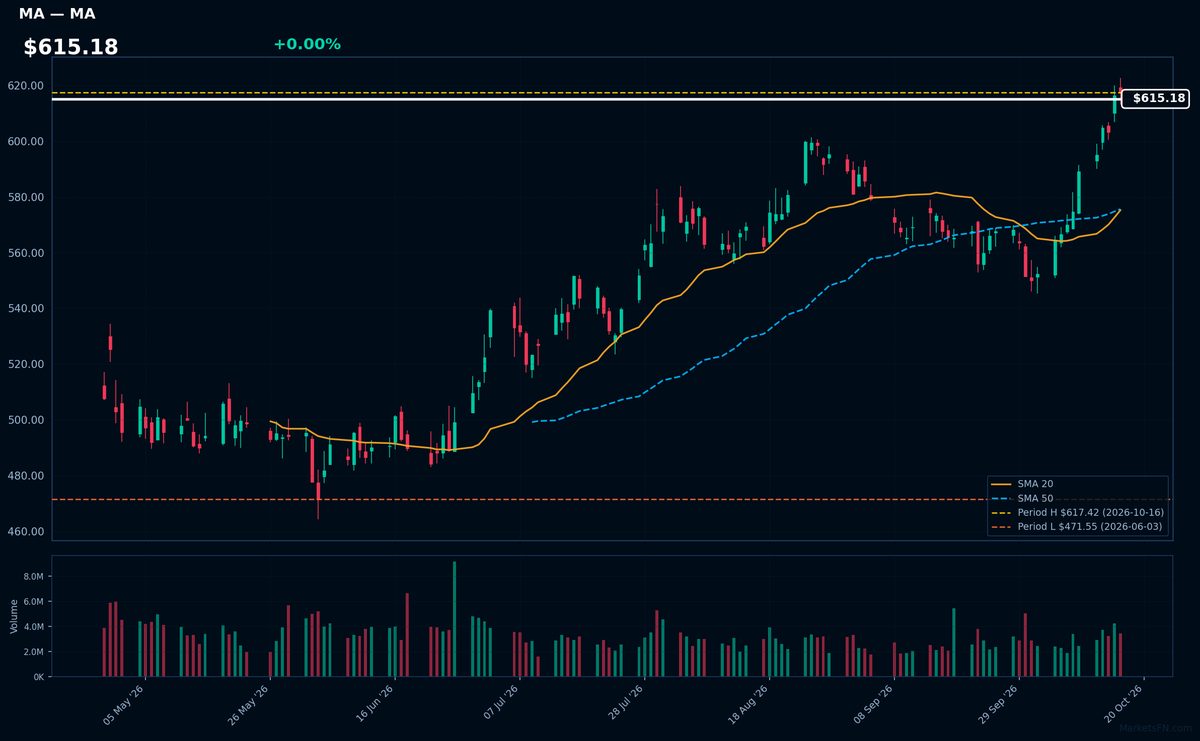
MA | Mastercard Incorporated | Financial | Price Last: $617.42 | % Realized: +9.64% | RSI: 72.9 | % above MA200: +15.8% | Trend: Above MA20, MA50, MA200
Mastercard operates a global payments network processing $9.9 trillion in annual transactions. Investors should care about its entrenched duopoly position with Visa, asset-light model with 60%+ operating margins, and exposure to cash-to-card conversion trends in emerging markets.
Technically bullish with RSI(14) at 72.9 (overbought) and price > MA20 > MA50 > MA200. The 9.6% YTD gain shows momentum, but extreme proximity to YTD highs suggests potential resistance ahead.
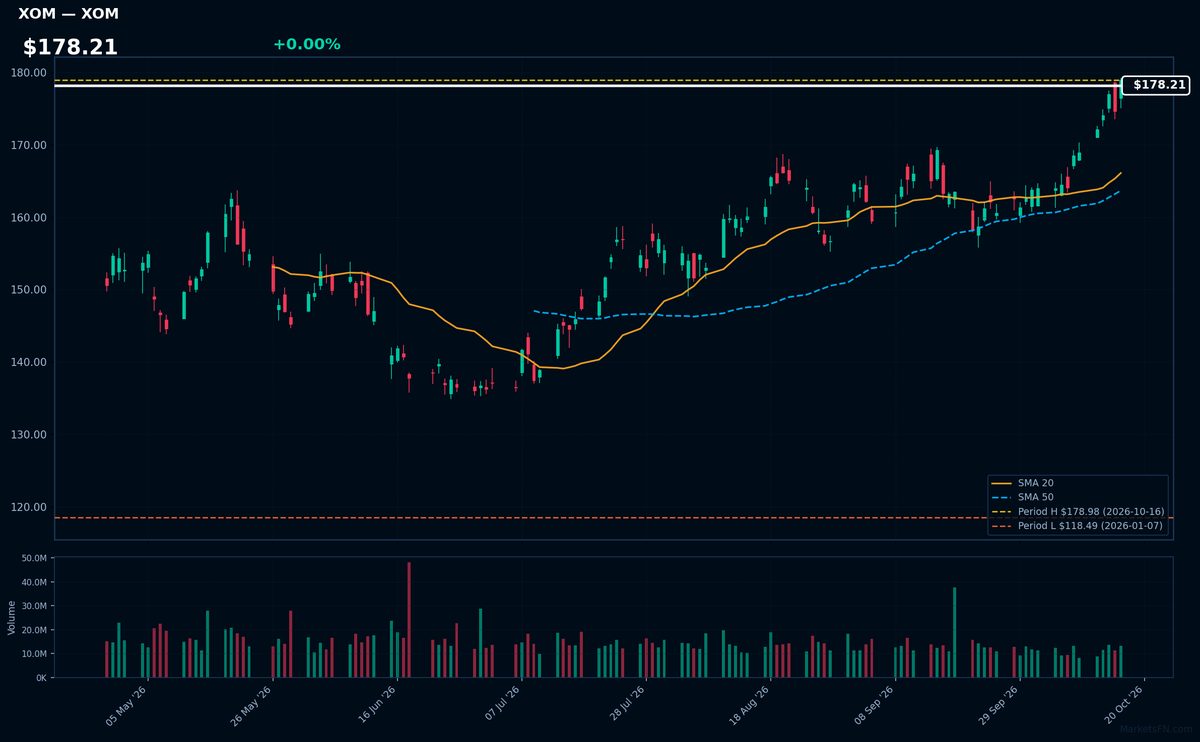
XOM | Exxon Mobil Corp | Energy | Price Last: $178.98 | % Realized: +45.93% | RSI: 70.8 | % above MA200: +17.7% | Trend: Above MA20, MA50, MA200
Exxon Mobil Corp explores, produces, and sells crude oil, natural gas, and petroleum products globally. Investors care due to its scale in energy markets, dividend reliability, and exposure to commodity cycles—critical for portfolios needing energy sector diversification.
XOM shows bullish momentum with RSI(14) at 70.8 (overbought) and price > MA20 > MA50 > MA200. The stock is 0.0% below its 2026 high—testing breakout levels after a 45.9% YTD surge. Extreme RSI warns of potential pullback despite trend strength.
📉 Nearest to 2026 Low
Sectors represented: Real Estate (1), Communication Services (1), Consumer Cyclical (1), Basic Materials (1), Technology (1)
| Ticker | Company | Sector | Price Last | % Realized | 2026 YTD Low Date | RSI | % above MA200 | Trend |
|---|---|---|---|---|---|---|---|---|
| PLD | Prologis Inc | Real Estate | $125.75 | -2.56% | 2026-10-16 | 31.9 | -8.9% | Below MA20, MA50, MA200 |
| PSKY | Paramount Skydance Corp | Communication Services | $6.91 | -13.08% | 2026-10-16 | 34.7 | — | — |
| MGM | MGM Resorts International | Consumer Cyclical | $28.60 | -21.62% | 2026-10-16 | 17.0 | -27.3% | Below MA20, MA50, MA200 |
| ALB | Albemarle Corp | Basic Materials | $95.48 | -33.66% | 2026-10-16 | 28.4 | -37.6% | Below MA20, MA50, MA200 |
| FSLR | First Solar Inc | Technology | $172.64 | -37.07% | 2026-10-01 | 39.7 | -21.3% | Below MA20, MA50, MA200 |
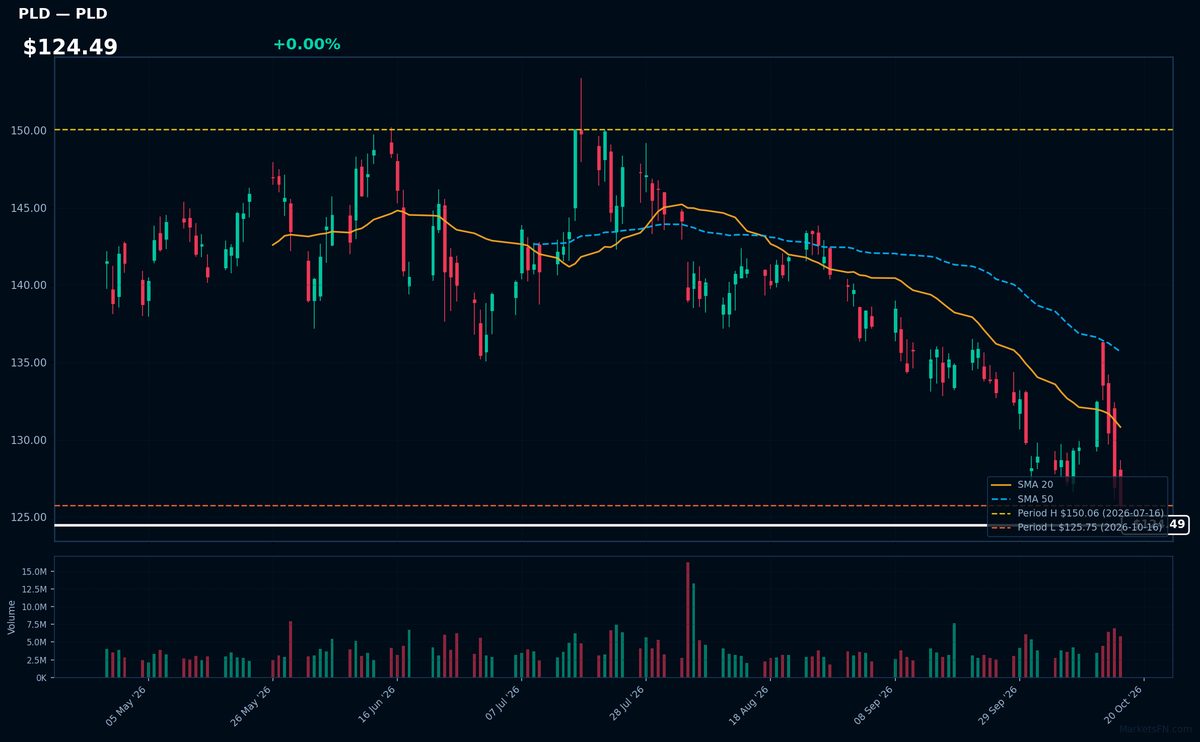
PLD | Prologis Inc | Real Estate | Price Last: $125.75 | % Realized: -2.56% | RSI: 31.9 | % above MA200: -8.9% | Trend: Below MA20, MA50, MA200
Prologis Inc (PLD) owns and operates logistics real estate, primarily warehouses and distribution centers critical for e-commerce and supply chains. Investors care because its properties serve as infrastructure for global trade, with cash flows tied to long-term leases with blue-chip tenants.
PLD shows bearish momentum: RSI at 31.9 (nearing oversold), with price ($124.49) below all key MAs (20/50/200-day). Down 2.6% YTD and just 0.0% above 2026 lows, testing critical support. MA alignment confirms sustained downtrend—a warning sign unless fundamentals reverse the technical breakdown.
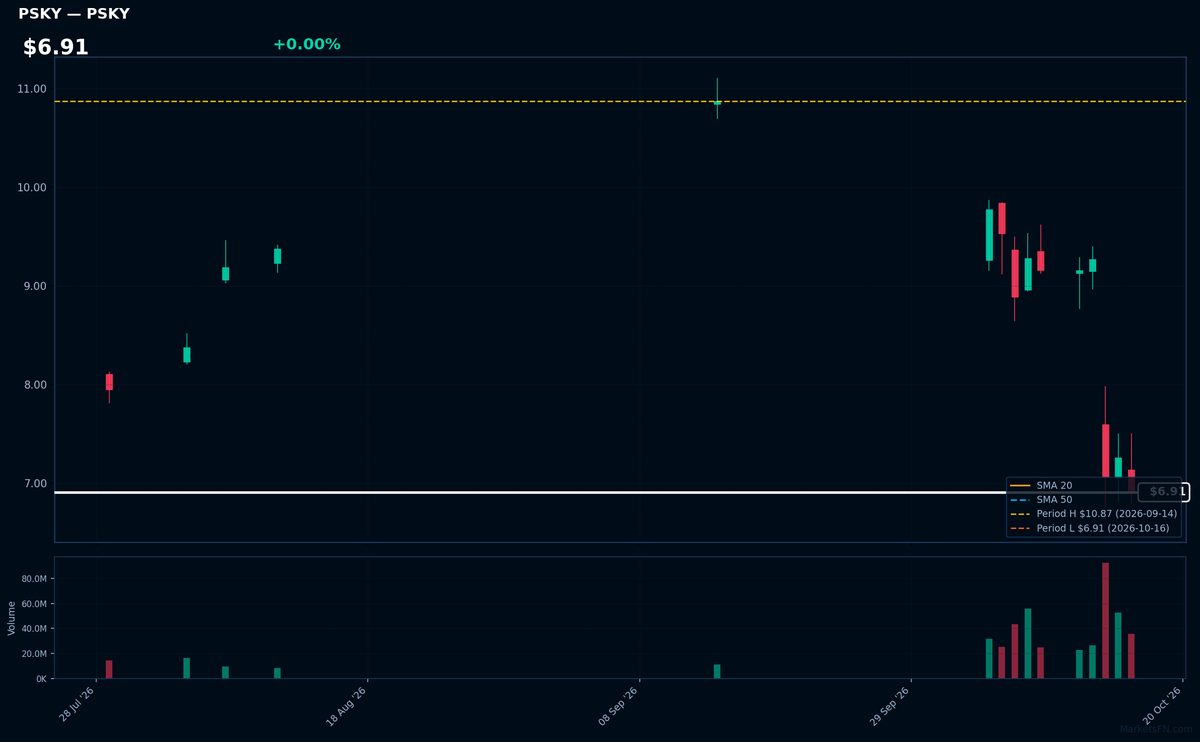
PSKY | Paramount Skydance Corp | Communication Services | Price Last: $6.91 | % Realized: -13.08% | RSI: 34.7 | % above MA200: — | Trend: —
Paramount Skydance Corp operates in [industry/sector not provided in data]. Investors should monitor its [specific catalyst not provided] given its extreme proximity to YTD lows at $6.91, signaling potential inflection or distress.
Technically concerning: PSKY trades just 0.0% above 2026 lows with oversold RSI(14) at 34.7. MA alignment data incomplete, but -13.1% YTD decline warns of persistent weakness.
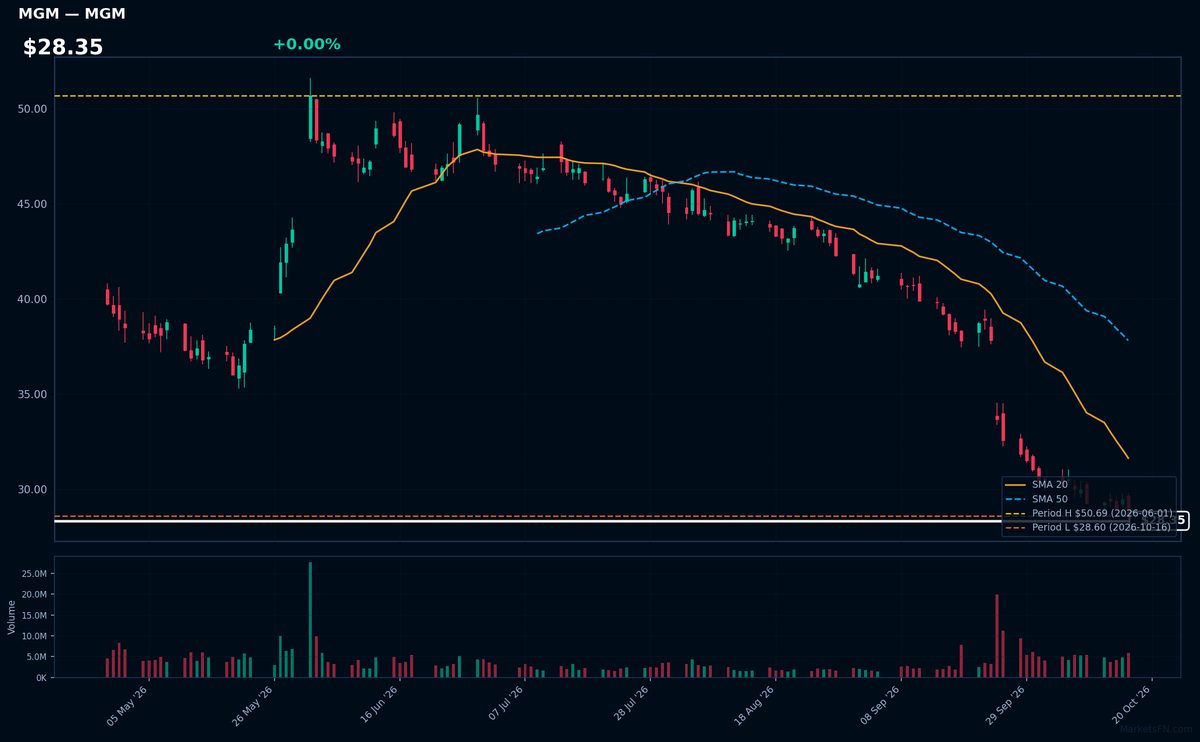
MGM | MGM Resorts International | Consumer Cyclical | Price Last: $28.60 | % Realized: -21.62% | RSI: 17.0 | % above MA200: -27.3% | Trend: Below MA20, MA50, MA200
MGM Resorts operates luxury casinos, hotels, and entertainment venues in Las Vegas and regional US markets. Investors watch its high-beta exposure to consumer discretionary spending and convention traffic, particularly in Vegas where it owns 50% of the Strip's hotel rooms.
MGM shows extreme technical weakness: RSI(14) at 17.0 (severely oversold) with bearish MA alignment (price $28.35 below all key MAs). The stock tests 2026 lows after a -21.6% YTD plunge, signaling breakdown risk.
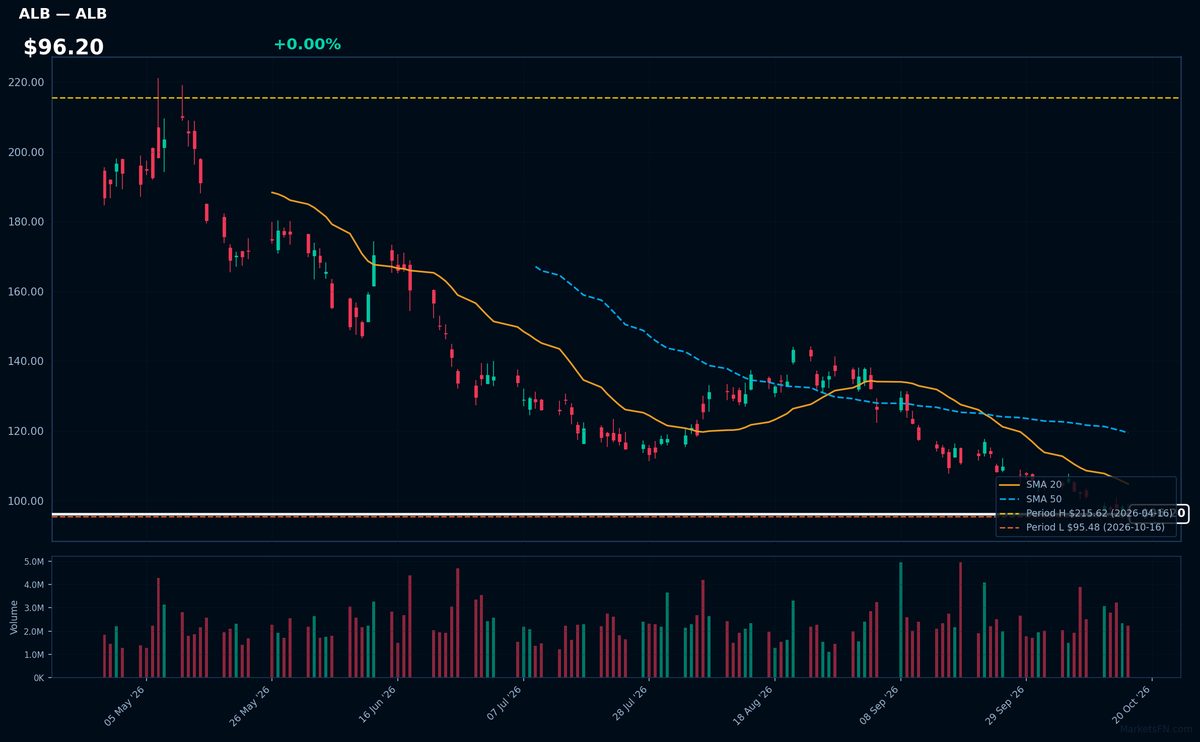
ALB | Albemarle Corp | Basic Materials | Price Last: $95.48 | % Realized: -33.66% | RSI: 28.4 | % above MA200: -37.6% | Trend: Below MA20, MA50, MA200
Albemarle Corp is a leading global producer of lithium, bromine, and catalysts critical for electric vehicle batteries, flame retardants, and refining. Investors watch ALB as a key EV supply chain play with volatile exposure to lithium price swings and energy transition demand.
ALB shows extreme technical weakness: RSI(14) at 28.4 (nearing oversold) with bearish MA alignment (price < MA20 < MA50 < MA200). The stock tests 2026 lows after a 33.7% YTD plunge, signaling severe downtrend pressure. This is a warning sign, not fundamental strength.
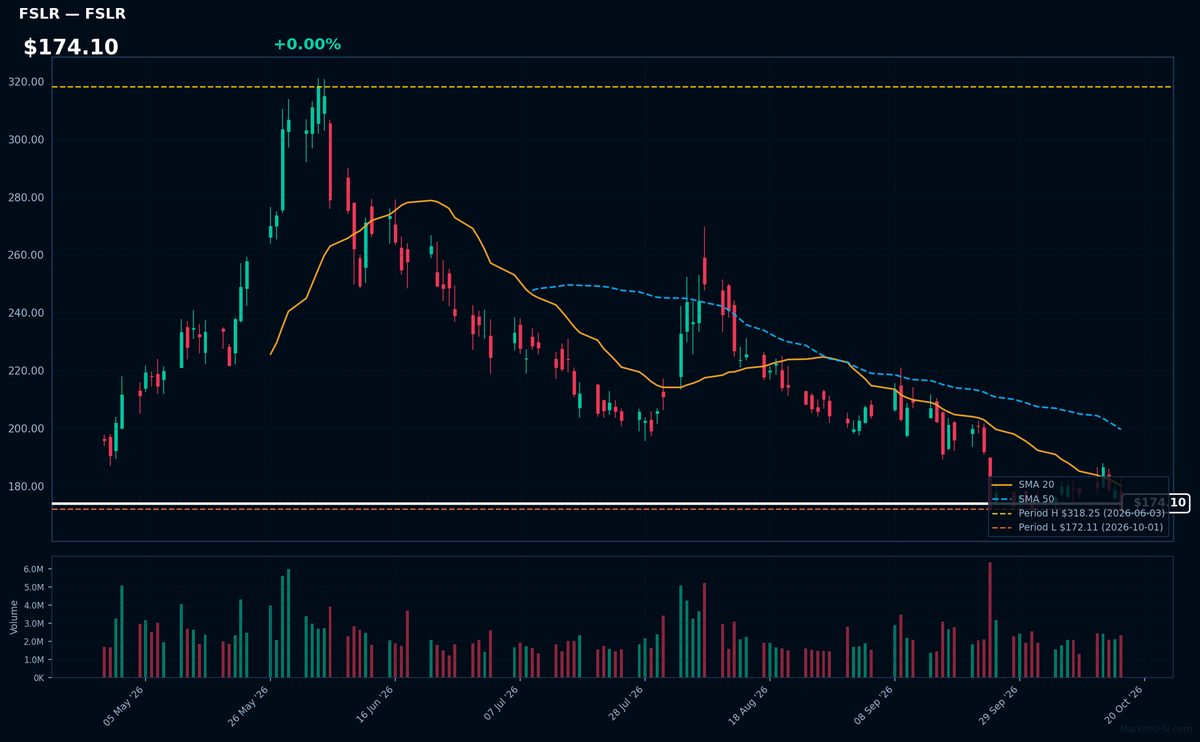
FSLR | First Solar Inc | Technology | Price Last: $172.64 | % Realized: -37.07% | RSI: 39.7 | % above MA200: -21.3% | Trend: Below MA20, MA50, MA200
First Solar manufactures thin-film solar panels using cadmium telluride technology, offering lower production costs than silicon-based rivals. Investors care because it's a pure-play on utility-scale solar projects, with 2026 seeing both policy tailwinds and brutal margin compression in renewable energy.
Technically dire: RSI(14) at 39.7 shows oversold conditions amid a sustained downtrend (price < MA20 < MA50 < MA200). Trading just 0.3% above YTD lows after -37.1% decline warns of breakdown risk unless fundamentals improve.
Market Commentary
The S&P 500 stocks trading near their 2026 highs—AAPL, BRK-B, V, MA, and XOM—reflect strong investor confidence in resilient sectors. Apple and Berkshire Hathaway represent stability in tech and diversified holdings, while Visa and Mastercard highlight sustained growth in digital payments. Exxon Mobil's presence suggests energy sector strength, likely driven by favorable commodity prices or disciplined capital allocation. Conversely, stocks near lows—PLD, PSKY, MGM, ALB, and FSLR—signal challenges in real estate (Prologis), media (Paramount Skydance), leisure (MGM), lithium (Albemarle), and solar (First Solar), possibly due to cyclical downturns or sector-specific headwinds.
Market conditions appear bifurcated, with defensives and cash-rich tech/payments outperforming, while interest-rate-sensitive and cyclical sectors lag. The dominance of payment networks (V, MA) and energy (XOM) at highs suggests inflation resilience, whereas real estate (PLD) and renewables (FSLR) may face financing or demand pressures. Media (PSKY) and gaming (MGM) could be weighed down by discretionary spending cuts or streaming profitability concerns.
Investors should monitor sector rotations, particularly in energy (XOM) for oil trends, payments (V, MA) for consumer spending data, and laggards (ALB, FSLR) for policy or commodity shifts. Earnings revisions and Fed policy will be critical for rate-sensitive names like PLD and MGM. Any mean reversion in extremes could signal broader market turns.
Methodology: All 503 S&P 500 constituents screened. Close prices downloaded from 2026-01-01. Period high = highest close since Jan 1 2026; period low = lowest close since Jan 1 2026. Distance = (current price / period extreme − 1) × 100. Technical indicators computed on up to 1 year of daily OHLCV data.
Disclaimer: For informational purposes only. Not investment advice. Past performance is not indicative of future results.