S&P 500 2026 YTD Highs & Lows Radar: Apple (AAPL), Howmet Aerospace (HWM) and more
MarketsFN Team

Screening all 503 S&P 500 constituents for stocks nearest to their 2026 year-to-date high and their 2026 YTD low. Data as of October 23, 2026. % Realized = total return since Jan 1 2026.
Legend: RSI > 70 = overbought · RSI < 30 = oversold · Green % Realized = positive YTD return · Red = negative.
📈 Nearest to 2026 High
Sectors represented: Financial (3), Technology (1), Healthcare (1)
| Ticker | Company | Sector | Price Last | % Realized | 2026 YTD High Date | RSI | % above MA200 | Trend |
|---|---|---|---|---|---|---|---|---|
| AAPL | Apple Inc | Technology | $348.22 | +28.49% | 2026-10-22 | 67.1 | +18.3% | Above MA20, MA50, MA200 |
| BRK-B | Berkshire Hathaway Inc | Financial | $546.97 | +10.09% | 2026-10-22 | 82.0 | +10.6% | Above MA20, MA50, MA200 |
| LLY | Lilly(Eli) & Co | Healthcare | $1306.69 | +20.95% | 2026-10-22 | 67.3 | +20.4% | Above MA20, MA50, MA200 |
| V | Visa Inc | Financial | $414.34 | +19.59% | 2026-10-22 | 75.5 | +21.7% | Above MA20, MA50, MA200 |
| MA | Mastercard Incorporated | Financial | $633.21 | +12.44% | 2026-10-22 | 74.6 | +18.5% | Above MA20, MA50, MA200 |
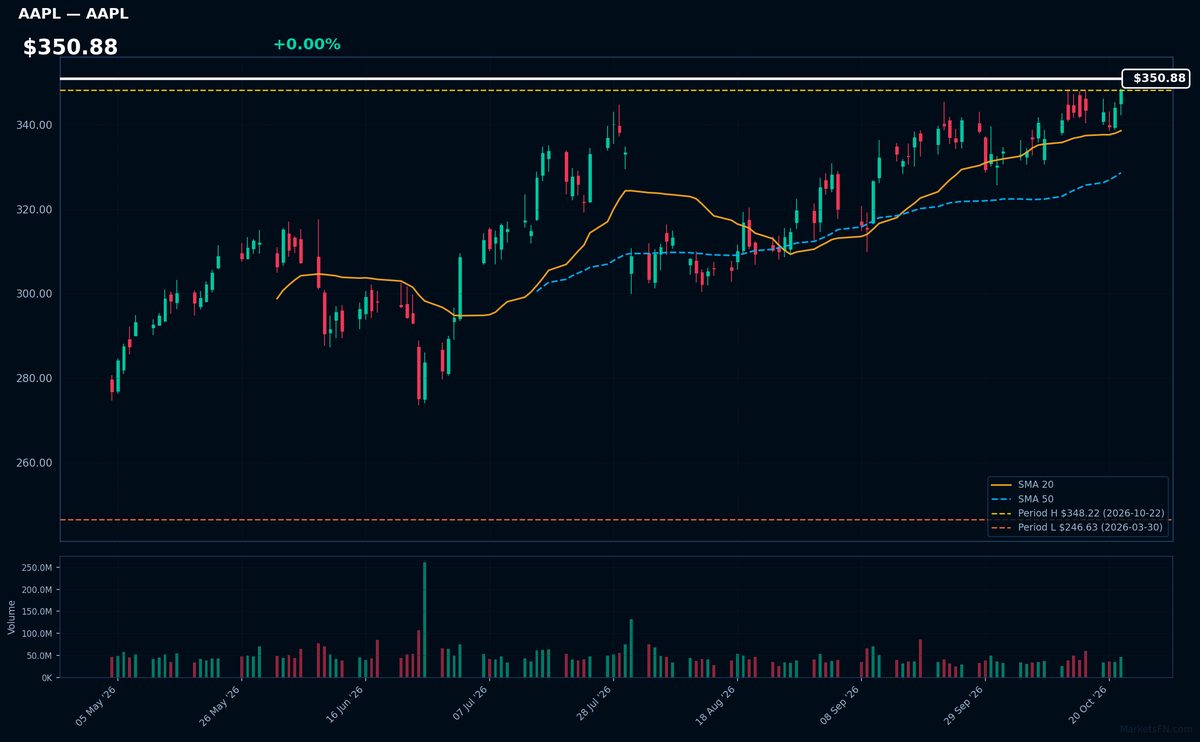
AAPL | Apple Inc | Technology | Price Last: $348.22 | % Realized: +28.49% | RSI: 67.1 | % above MA200: +18.3% | Trend: Above MA20, MA50, MA200
Apple Inc designs premium consumer electronics (iPhone, Mac), services (App Store, iCloud), and wearables (Apple Watch). Investors care because its ecosystem drives recurring revenue with 28.5% YTD returns, demonstrating pricing power and brand loyalty in tech hardware.
AAPL shows bullish momentum with RSI(14) at 67.1 and sustained uptrend (price > MA20 > MA50 > MA200). At 0.0% below YTD highs, it tests breakout resistance — watch for confirmation or pullback from overbought levels.
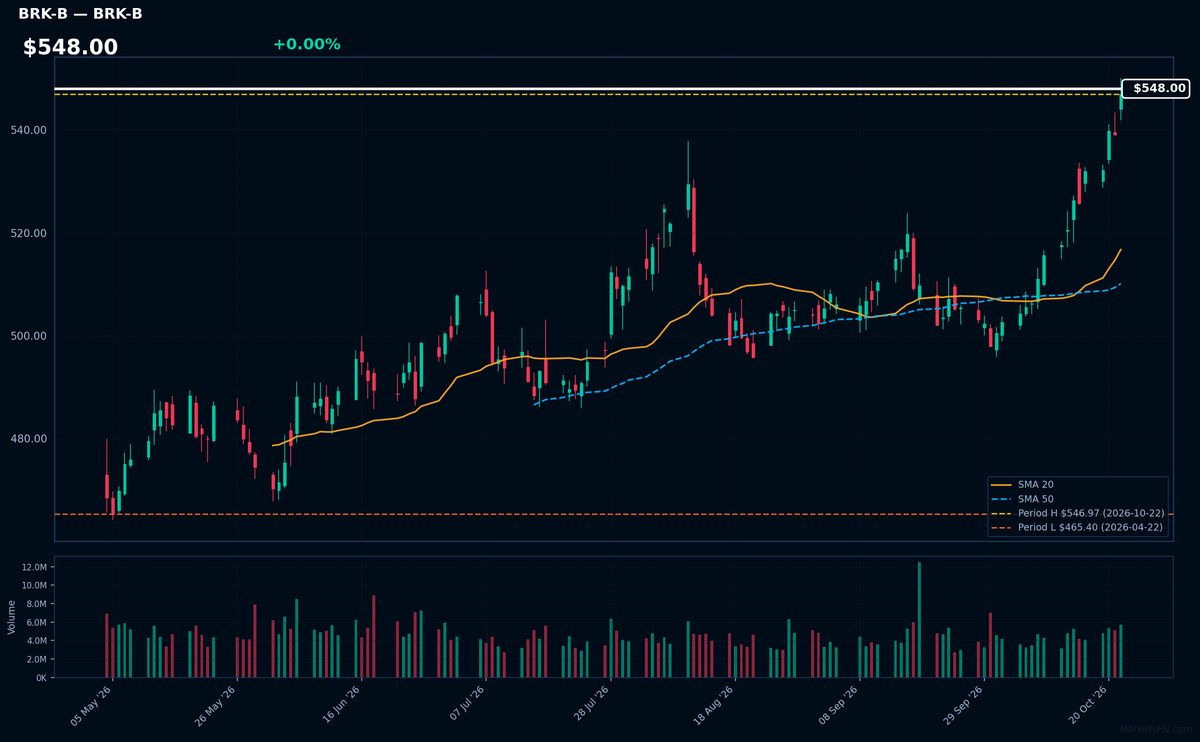
BRK-B | Berkshire Hathaway Inc | Financial | Price Last: $546.97 | % Realized: +10.09% | RSI: 82.0 | % above MA200: +10.6% | Trend: Above MA20, MA50, MA200
Berkshire Hathaway operates a massive insurance business (GEICO, reinsurance) while owning dozens of wholly-owned companies (BNSF railroad, Dairy Queen) and major stock holdings (Apple, Coca-Cola). Investors care for its diversified cash flows, Buffett/Munger capital allocation, and historical outperformance through market cycles.
Technically overbought (RSI 82) but in strong uptrend (price > MA20 > MA50 > MA200). At YTD highs after 10.1% 2026 gain, suggesting momentum but extreme RSI warrants caution.
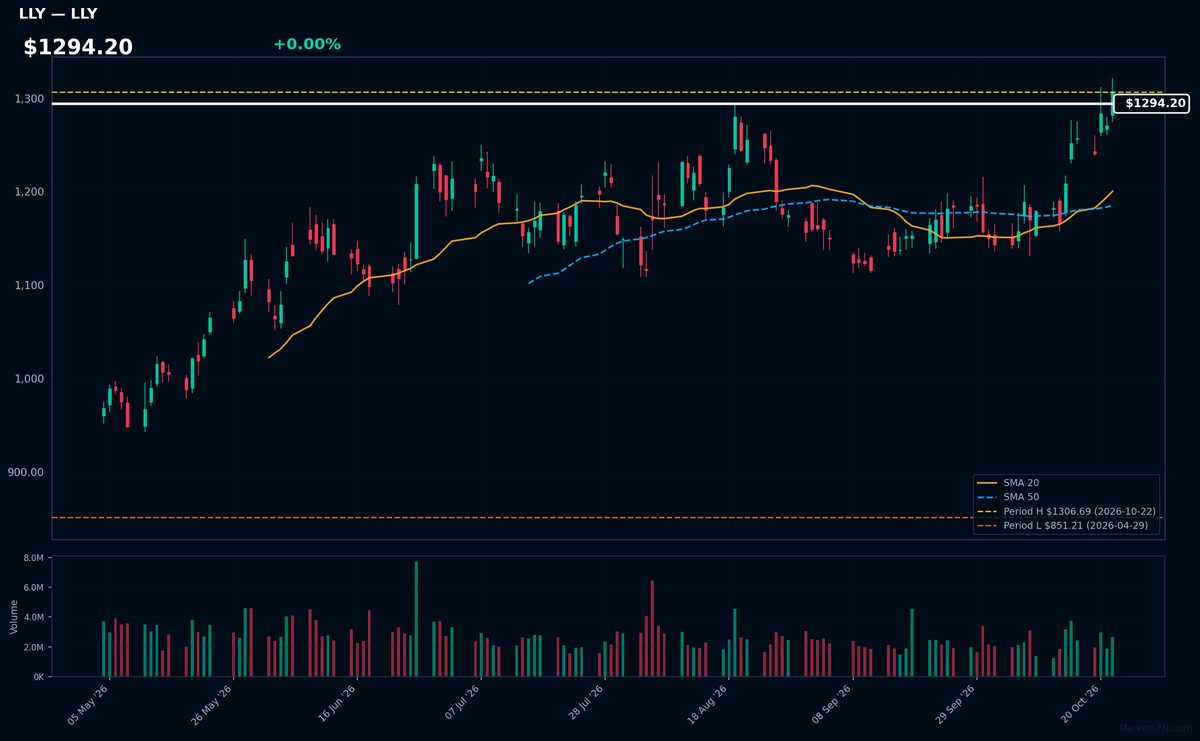
LLY | Lilly(Eli) & Co | Healthcare | Price Last: $1306.69 | % Realized: +20.95% | RSI: 67.3 | % above MA200: +20.4% | Trend: Above MA20, MA50, MA200
Lilly(Eli) & Co is a pharmaceutical leader focused on diabetes (Mounjaro, Trulicity), obesity (Zepbound), and Alzheimer's treatments. Investors care because its blockbuster drugs dominate high-growth markets with limited competition, driving consistent revenue upside and pricing power.
Technically bullish: $1294.20 price holds above all key MAs (20/50/200) with RSI(14) at 67.3, suggesting strong momentum but nearing overbought. The 20.9% YTD gain shows sustained uptrend conviction.
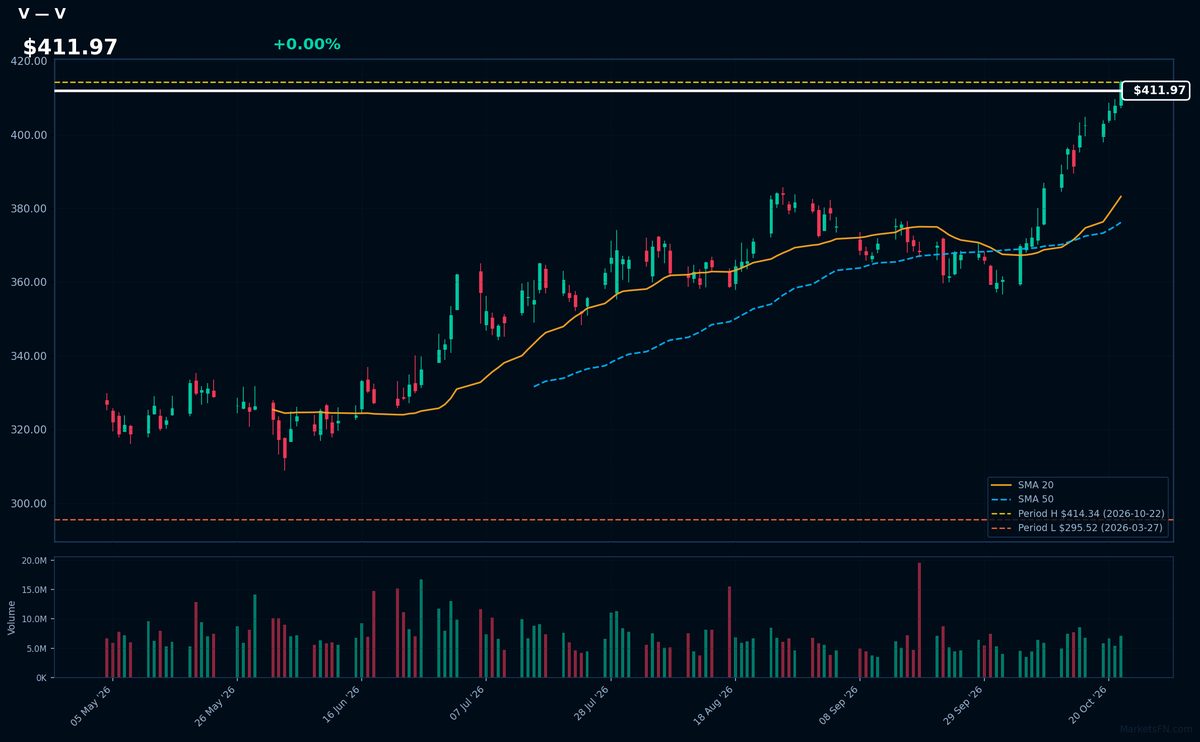
V | Visa Inc | Financial | Price Last: $414.34 | % Realized: +19.59% | RSI: 75.5 | % above MA200: +21.7% | Trend: Above MA20, MA50, MA200
Visa operates the world's largest electronic payments network, processing over $15 trillion annually. Investors care because its asset-light model generates 60%+ operating margins as global cashless adoption grows, with pricing power from duopoly market structure (with Mastercard) in card networks.
Technically overbought (RSI 75.5) but in strong uptrend (price > MA20 > MA50 > MA200). At YTD highs after 19.6% 2026 gain, this reflects fundamental strength but near-term consolidation risk. Watch for breakout above current resistance.
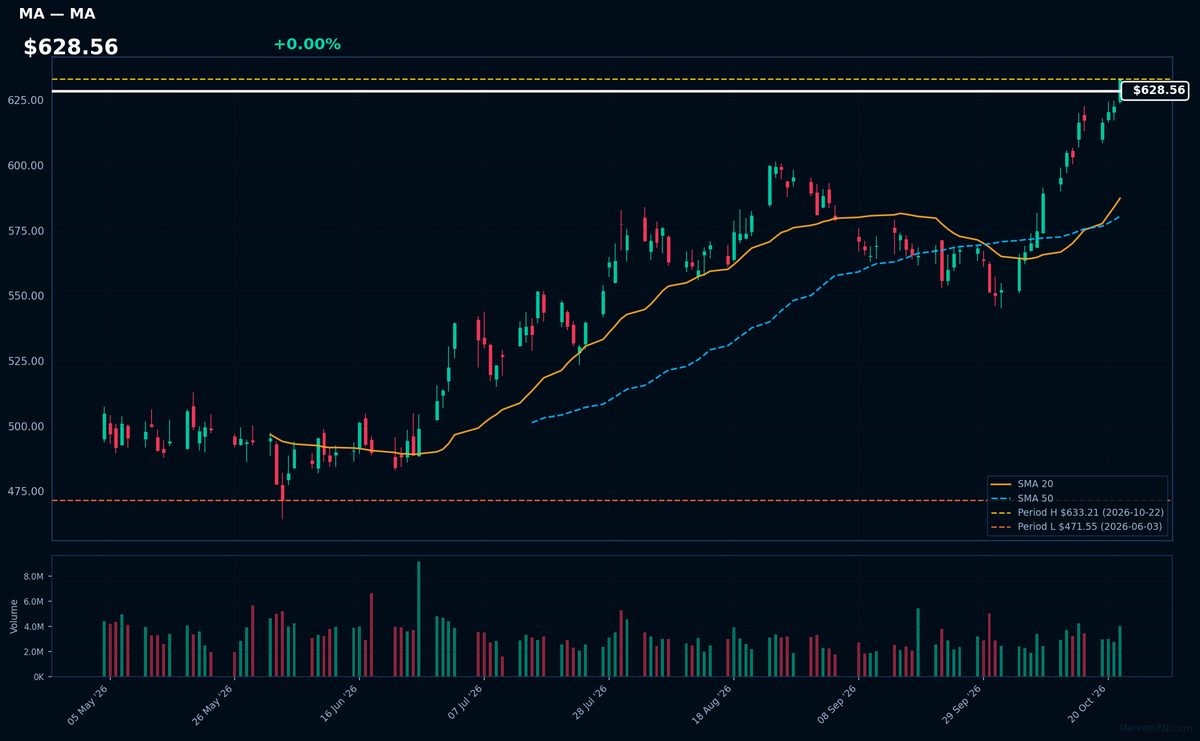
MA | Mastercard Incorporated | Financial | Price Last: $633.21 | % Realized: +12.44% | RSI: 74.6 | % above MA200: +18.5% | Trend: Above MA20, MA50, MA200
Mastercard operates the world's second-largest payment network, processing $9.9 trillion in annual volume. Investors care because its asset-light model generates 58% gross margins from every swipe, with revenue directly tied to global consumption growth and digital payment adoption.
Technically bullish with price at $628.56 (0.0% below YTD high), RSI(14) at 74.6 showing overbought momentum, and confirmed uptrend (price > MA20 > MA50 > MA200). The 12.4% YTD gain suggests continuation potential but warrants caution at these extended levels.
📉 Nearest to 2026 Low
Sectors represented: Industrials (1), Utilities (1), Technology (1), Communication Services (1), Basic Materials (1)
| Ticker | Company | Sector | Price Last | % Realized | 2026 YTD Low Date | RSI | % above MA200 | Trend |
|---|---|---|---|---|---|---|---|---|
| HWM | Howmet Aerospace Inc | Industrials | $193.29 | -8.70% | 2026-10-22 | 19.1 | -22.4% | Below MA20, MA50, MA200 |
| NRG | NRG Energy Inc | Utilities | $94.38 | -43.20% | 2026-10-22 | 34.5 | -30.9% | Below MA20, MA50, MA200 |
| FSLR | First Solar Inc | Technology | $171.25 | -37.58% | 2026-10-22 | 37.2 | -21.3% | Below MA20, MA50, MA200 |
| PSKY | Paramount Skydance Corp | Communication Services | $6.91 | -13.08% | 2026-10-16 | 34.7 | — | — |
| MOS | Mosaic Company | Basic Materials | $17.27 | -30.98% | 2026-10-22 | 19.9 | -28.3% | Below MA20, MA50, MA200 |
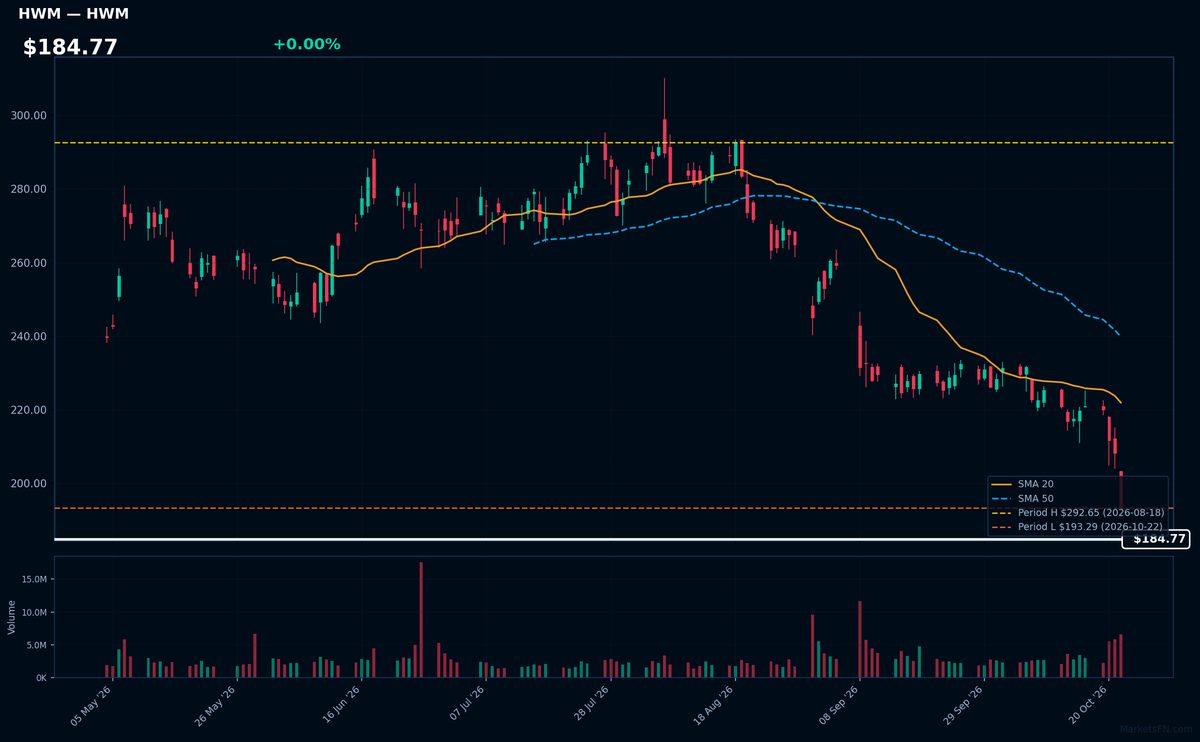
HWM | Howmet Aerospace Inc | Industrials | Price Last: $193.29 | % Realized: -8.70% | RSI: 19.1 | % above MA200: -22.4% | Trend: Below MA20, MA50, MA200
Howmet Aerospace produces engineered components for jet engines, fastening systems, and defense applications. Investors should monitor its exposure to commercial aerospace recovery and defense spending, with 2026 YTD returns down 8.7%.
Technically extreme with RSI(14) at 19.1 and bearish MA alignment (price < MA20 < MA50 < MA200), testing 2026 lows—a clear warning sign.
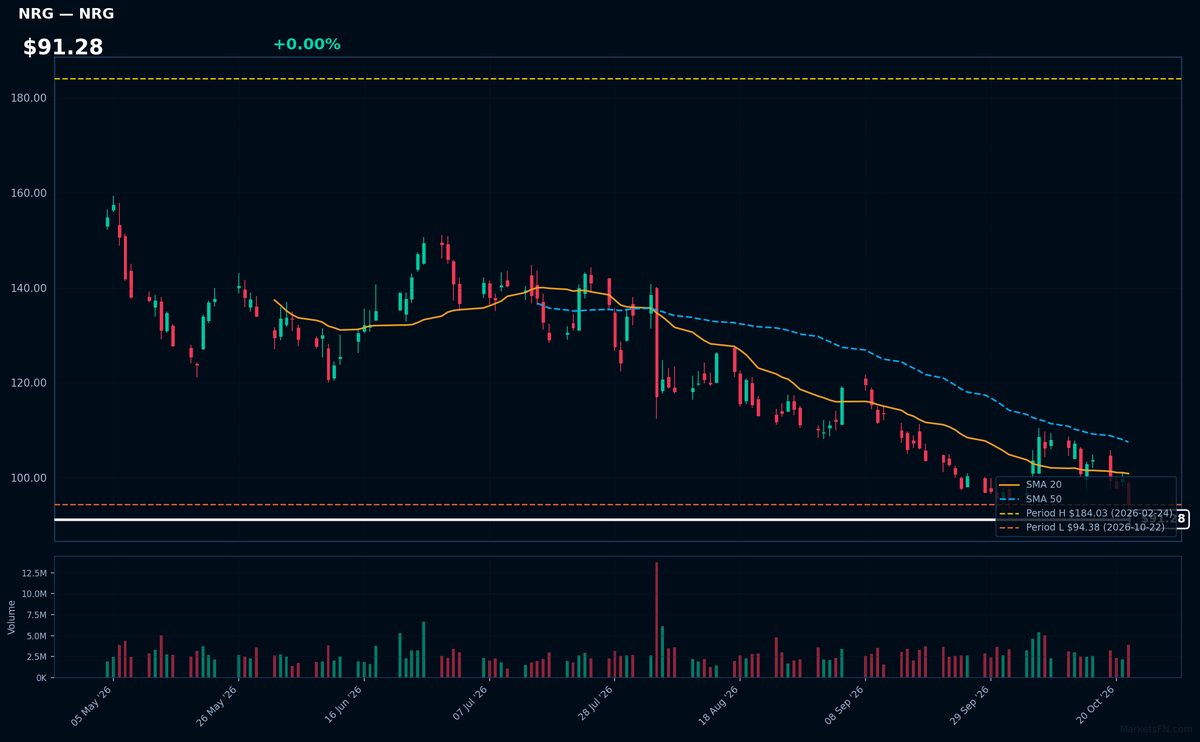
NRG | NRG Energy Inc | Utilities | Price Last: $94.38 | % Realized: -43.20% | RSI: 34.5 | % above MA200: -30.9% | Trend: Below MA20, MA50, MA200
NRG Energy operates competitive power generation and retail electricity businesses across the U.S., serving 7.3 million customers. Investors watch NRG for exposure to energy transition plays and volatile power markets, where its merchant generation fleet can capitalize on price spikes.
NRG shows extreme technical weakness: RSI(14) at 34.5 confirms oversold conditions, while a sustained downtrend (price $91.28 < MA20 < MA50 < MA200) and -43.2% YTD decline suggest capitulation. The stock tests critical support at its 2026 low.
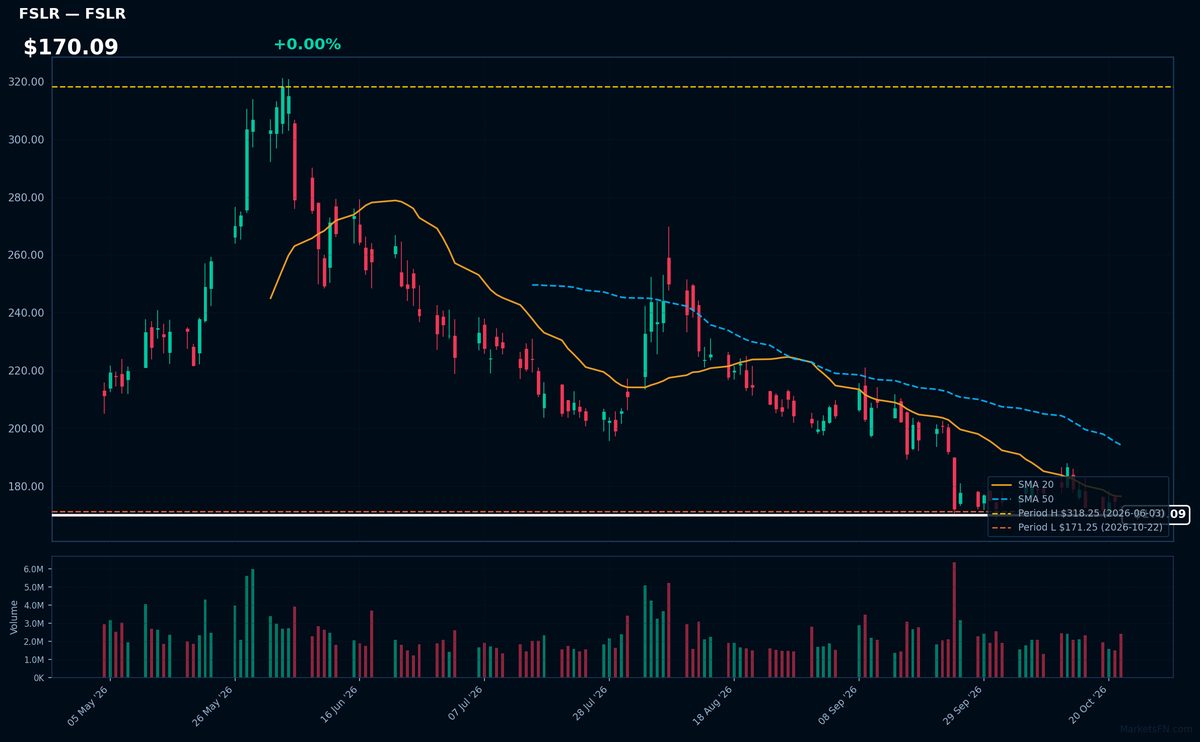
FSLR | First Solar Inc | Technology | Price Last: $171.25 | % Realized: -37.58% | RSI: 37.2 | % above MA200: -21.3% | Trend: Below MA20, MA50, MA200
First Solar Inc manufactures thin-film solar panels using proprietary cadmium telluride technology, offering cost advantages in utility-scale solar projects. Investors watch FSLR as a pure-play on solar energy adoption, particularly in markets favoring domestic manufacturing through incentives like the U.S. Inflation Reduction Act.
FSLR shows severe technical weakness with RSI(14) at 37.2 and bearish MA alignment (price < MA20 < MA50 < MA200). Trading just 0.0% above its 2026 YTD low after a -37.6% decline, this is a critical warning sign as the stock tests major support levels.
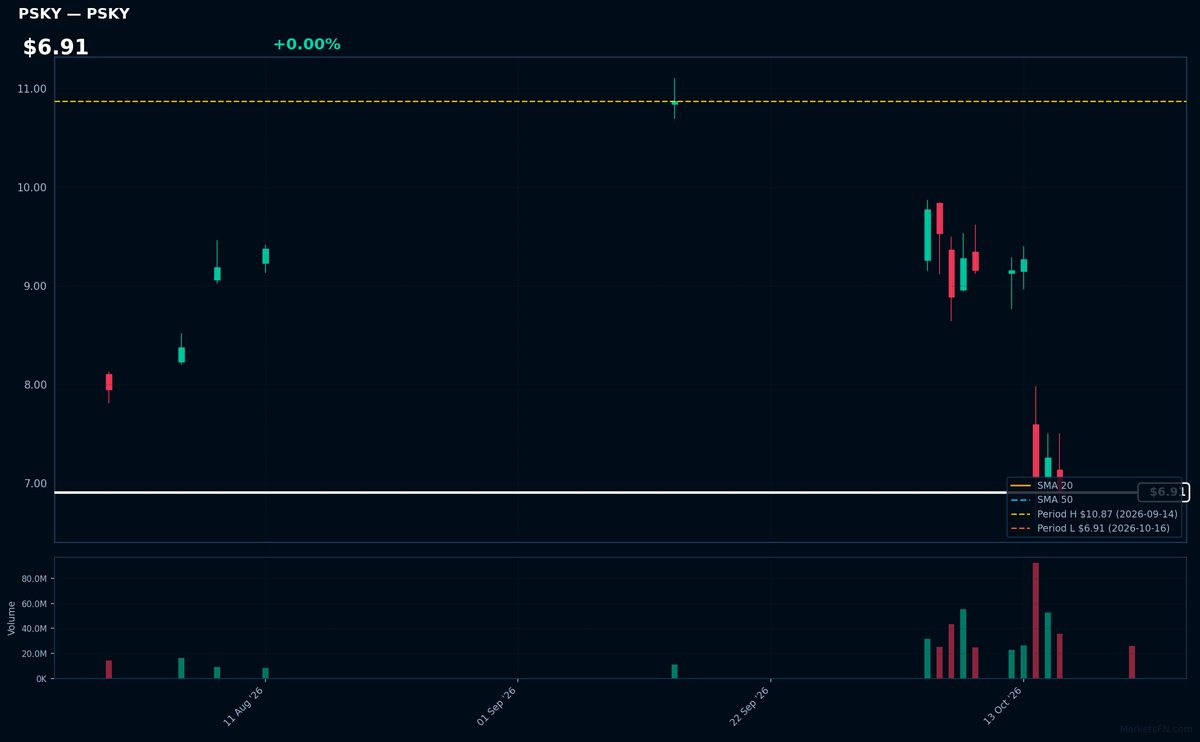
PSKY | Paramount Skydance Corp | Communication Services | Price Last: $6.91 | % Realized: -13.08% | RSI: 34.7 | % above MA200: — | Trend: —
Paramount Skydance Corp operates in [industry/sector not provided in data]. Investors should monitor its [specific catalyst not provided] given its extreme proximity to YTD lows at $6.91, reflecting heightened sensitivity to near-term price action.
Technically concerning: PSKY trades just 0.0% above 2026 lows with RSI(14) at 34.7 (approaching oversold) and -13.1% YTD return. MA alignment data incomplete, but current weakness tests critical support.
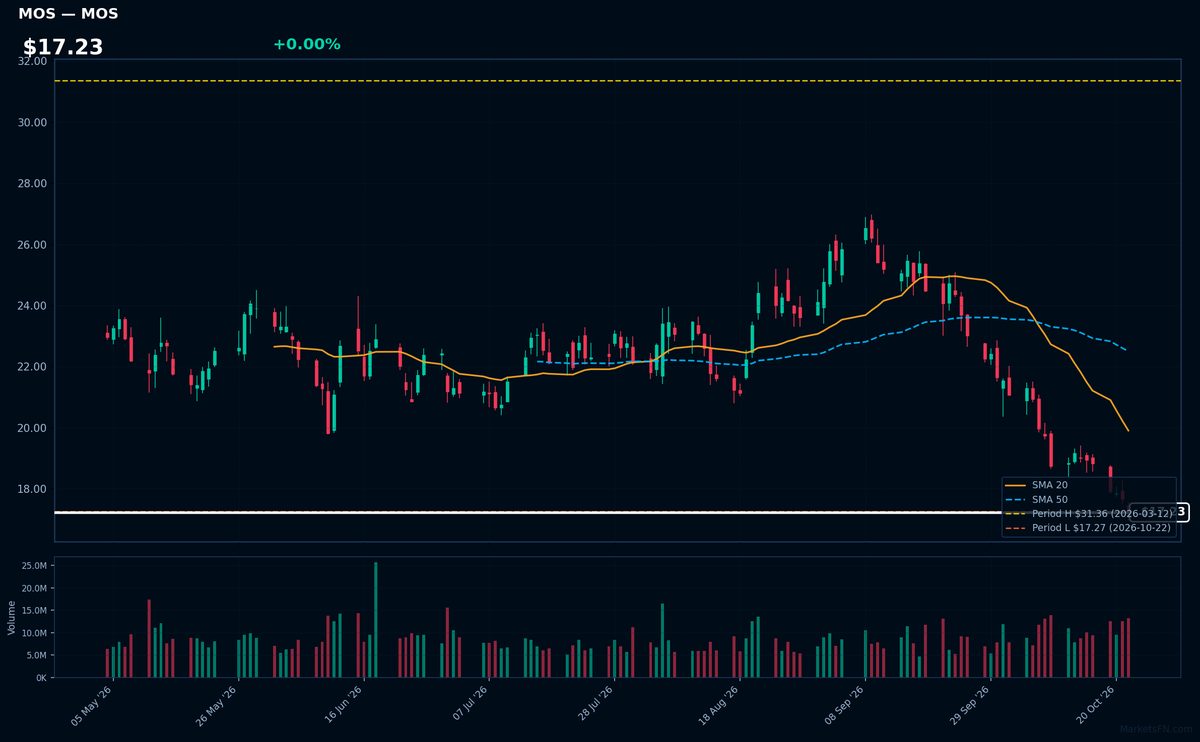
MOS | Mosaic Company | Basic Materials | Price Last: $17.27 | % Realized: -30.98% | RSI: 19.9 | % above MA200: -28.3% | Trend: Below MA20, MA50, MA200
Mosaic Company produces concentrated phosphate and potash crop nutrients for global agriculture. Investors monitor MOS as a pure-play fertilizer stock with direct exposure to farm input demand cycles and food security trends.
At $17.23 with RSI(14) at 19.9 and bearish MA alignment (price < MA20 < MA50 < MA200), MOS tests 2026 lows after a -31.0% YTD plunge. This extreme oversold condition warns of capitulation, not momentum.
Market Commentary
The fact that AAPL, BRK-B, LLY, V, and MA are trading at their 2026 highs suggests strong investor confidence in these blue-chip names, reflecting either sustained earnings growth, defensive positioning, or market leadership in their respective sectors. Conversely, HWM, NRG, FSLR, PSKY, and MOS hovering near 2026 lows indicates persistent challenges—whether cyclical (e.g., commodities for MOS), sector-specific headwinds (renewables for FSLR), or company-specific struggles (media disruption for PSKY). These extremes highlight the bifurcated nature of the current market.
The highs are dominated by defensive and growth-oriented sectors: technology (AAPL), payments (V, MA), and healthcare (LLY), signaling a preference for quality and cash flow resilience. The lows, however, skew toward cyclical (HWM, MOS) and volatile industries (energy for NRG, solar for FSLR), suggesting caution around macro sensitivity or regulatory risks. This divergence may reflect broader market conditions—low volatility favoring stable cash flows while punishing uncertainty or leverage.
Investors should monitor whether these extremes mark inflection points. For high-flyers, valuation discipline and earnings sustainability are key; for laggards, catalysts like commodity rebounds (MOS), energy policy shifts (FSLR), or restructuring (PSKY) could signal reversals. Sector rotation trends and macroeconomic data (rates, industrial demand) will be critical in determining whether these extremes persist or mean-revert.
Methodology: All 503 S&P 500 constituents screened. Close prices downloaded from 2026-01-01. Period high = highest close since Jan 1 2026; period low = lowest close since Jan 1 2026. Distance = (current price / period extreme − 1) × 100. Technical indicators computed on up to 1 year of daily OHLCV data.
Disclaimer: For informational purposes only. Not investment advice. Past performance is not indicative of future results.