Ripple Dips Below $1.47 as Bearish Momentum Builds
QuoteReporter
•2 min read
Ripple Dips Below $1.47 as Bearish Momentum Builds
Ripple (XRP/USD) | October 07, 2026 $1.4612 -2.41%
🔍 Technical Analysis
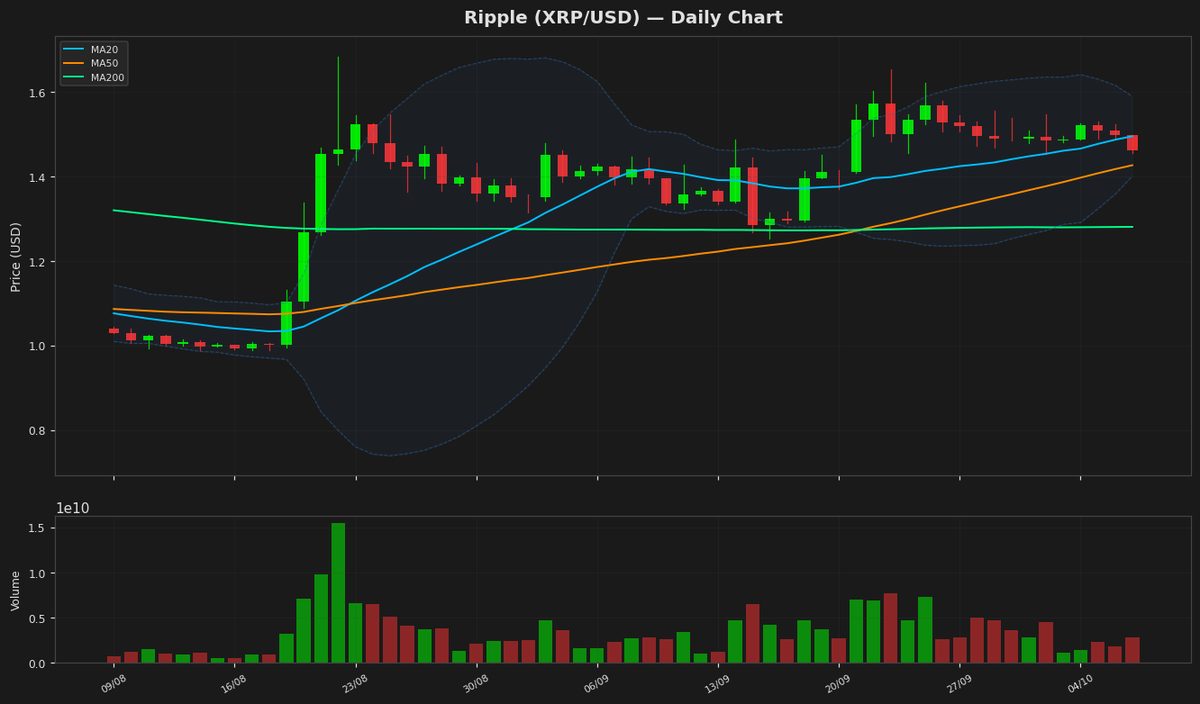
Ripple (XRP) is currently trading at $1.4612, down 2.41% on the day, showing mild bearish momentum. The price is hovering between the 20-day moving average (MA20) at $1.4948 and the 50-day moving average (MA50) at $1.4262, indicating a consolidation phase. The MA200 at $1.2804 remains a key long-term support level. Bollinger Bands reveal a narrowing range, with the upper band at $1.5890 and the lower band at $1.4005, suggesting reduced volatility and potential for a breakout. The RSI(14) at 42.33 reflects neutral-to-weak momentum, neither oversold nor overbought. The MACD histogram shows a slight bearish crossover, with the MACD line at 0.0279 below the signal line at 0.0373, indicating weakening bullish momentum. Key support levels are $1.4005 (Bollinger Lower Band) and $1.4262 (MA50), while resistance lies at $1.4948 (MA20) and $1.5890 (Bollinger Upper Band). The 52-week high of $1.9090 and YTD high of $2.4102 remain distant targets, while the 52-week low of $0.9884 serves as a critical long-term floor. ATR(14) at 0.0565 confirms subdued price volatility. A break above MA20 could reignite bullish sentiment, while a drop below MA50 may signal further downside.
Technical Metrics
| Metric | Value |
|---|---|
| Current Price | $1.4612 |
| Daily Change | -2.41% |
| MA 20 | $1.4948 |
| % from MA20 | -2.25% |
| MA 50 | $1.4262 |
| % from MA50 | +2.45% |
| MA 200 | $1.2804 |
| % from MA200 | +14.12% |
| BB Upper | $1.5891 |
| % from BB Upper | -8.05% |
| BB Lower | $1.4005 |
| % from BB Lower | +4.33% |
| RSI (14) | 42.34 |
| MACD | 0.027993 |
| MACD Signal | 0.037344 |
| ATR (14) | 0.056543 |
| 3-Day High | $1.5285 |
| 3-Day Low | $1.4557 |
| 52-Week High | $1.9091 |
| % from 52W High | -23.46% |
| 52-Week Low | $0.9884 |
| % from 52W Low | +47.83% |
| YTD High | $2.4103 |
| % from YTD High | -39.38% |
| YTD Low | $0.9884 |
| % from YTD Low | +47.83% |
📊 Market Commentary
Ripple (XRP) is currently trading at $1.4612, down 2.41% today, reflecting a cautious market sentiment amid broader cryptocurrency volatility. The Relative Strength Index (RSI) at 42.3 suggests XRP is neither oversold nor overbought, hovering near neutral territory. Over the past 52 weeks, XRP has fluctuated between $0.9884 and $1.9091, indicating significant price swings, with the current level sitting closer to the mid-range.
Market sentiment appears mixed, as traders weigh regulatory developments and broader macroeconomic factors affecting crypto assets. XRP's recent performance has been influenced by fluctuating Bitcoin trends and lingering uncertainty around ongoing legal proceedings involving Ripple Labs. Key support levels to watch include the psychological $1.40 mark, followed by the yearly low near $0.9884. On the upside, resistance is seen around $1.60, with a break above potentially testing higher levels toward the yearly high.
Traders are monitoring trading volume trends and institutional interest, as liquidity remains a critical factor for XRP’s price stability. Additionally, any updates on Ripple’s legal battles or adoption news could trigger sharp movements. For now, the lack of strong momentum in either direction suggests a wait-and-see approach among investors, with technical indicators like the RSI and moving averages being closely watched for signs of a breakout or further consolidation.
Market sentiment appears mixed, as traders weigh regulatory developments and broader macroeconomic factors affecting crypto assets. XRP's recent performance has been influenced by fluctuating Bitcoin trends and lingering uncertainty around ongoing legal proceedings involving Ripple Labs. Key support levels to watch include the psychological $1.40 mark, followed by the yearly low near $0.9884. On the upside, resistance is seen around $1.60, with a break above potentially testing higher levels toward the yearly high.
Traders are monitoring trading volume trends and institutional interest, as liquidity remains a critical factor for XRP’s price stability. Additionally, any updates on Ripple’s legal battles or adoption news could trigger sharp movements. For now, the lack of strong momentum in either direction suggests a wait-and-see approach among investors, with technical indicators like the RSI and moving averages being closely watched for signs of a breakout or further consolidation.
Disclaimer
The content on MarketsFN.com is provided for educational and informational purposes only. It does not constitute financial advice or investment recommendations. All investments involve risk. Cryptocurrency markets are highly volatile. Past performance does not guarantee future results.