Polkadot Surges 12.81% – Market Pulse
QuoteReporter

Polkadot Surges 12.81% – Market Pulse
Market Overview
| Coin | Price | Change | MA50 | MA200 | RSI |
|---|---|---|---|---|---|
| Bitcoin | $101620.09 | +0.03% | $113090.95 | $110032.77 | 32.4 |
| Ethereum | $3341.04 | +1.47% | $4097.91 | $3379.66 | 31.7 |
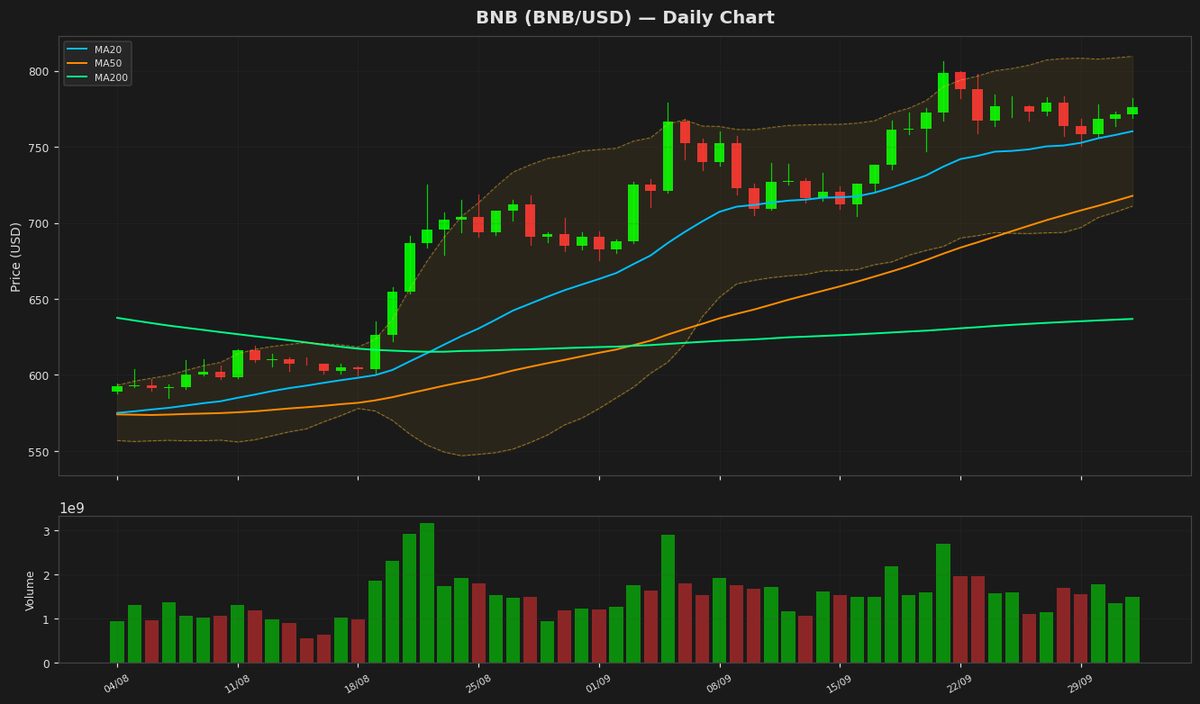
| Binance Coin | $966.81 | +3.08% | $1093.08 | $815.66 | 37.0 |
| XRP | $2.22 | +0.56% | $2.67 | $2.62 | 34.8 |
| Solana | $157.48 | +1.34% | $203.89 | $179.94 | 30.9 |
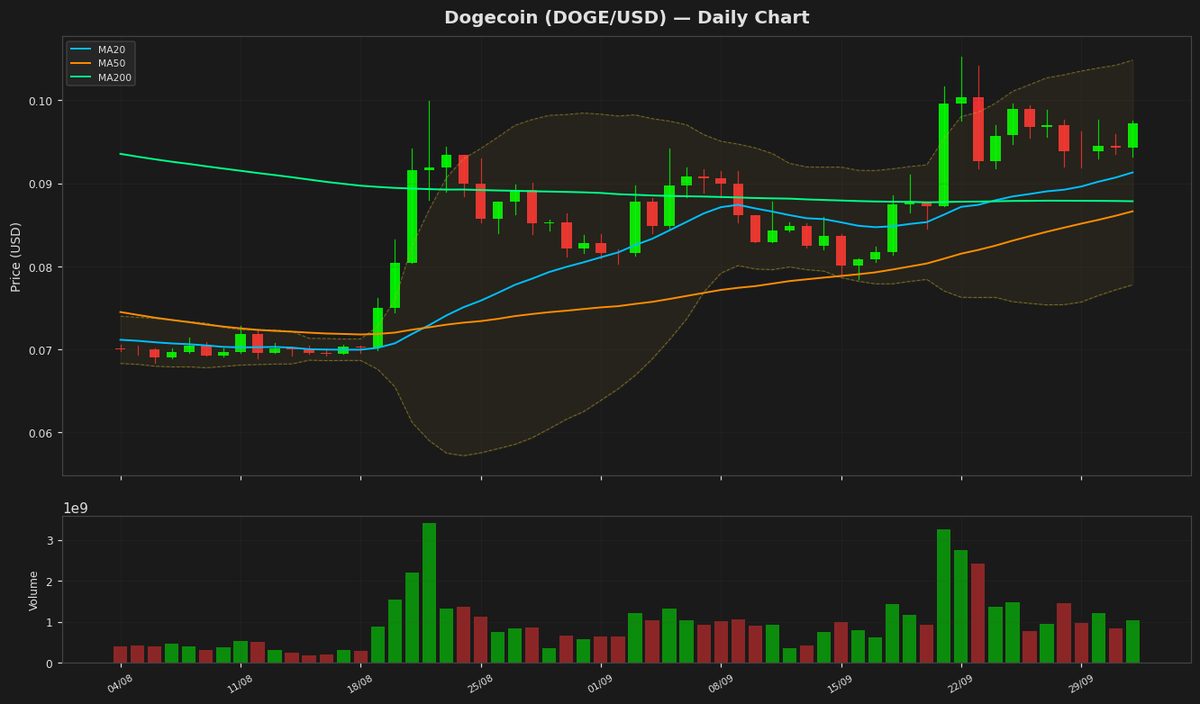
| Dogecoin | $0.17 | +2.30% | $0.22 | $0.21 | 33.7 |
| Cardano | $0.55 | +4.77% | $0.73 | $0.74 | 32.9 |
| Avalanche | $16.86 | +5.20% | $24.98 | $23.03 | 33.1 |
| Polkadot | $2.84 | +12.81% | $3.53 | $3.90 | 42.2 |
| Chainlink | $15.04 | +2.18% | $19.68 | $17.98 | 34.9 |
Top Gainer: Polkadot (+12.81%)
Technical Outlook
Polkadot (DOT) currently trades at $2.84, reflecting a notable daily increase of 12.81%. The technical indicators suggest mixed signals; with a 50-day moving average (MA50) at $3.53 and a 200-day moving average (MA200) at $3.90, the asset appears to be below both key resistance levels. The Relative Strength Index (RSI) at 42.2 indicates neutral momentum, while the MACD of -0.206 suggests bearish sentiment. Investors should monitor for potential reversal patterns or further price consolidation.
Top Loser: Bitcoin (0.03%)
Technical Outlook
Bitcoin is currently trading at $101,620.09, reflecting a modest daily increase of 0.03%. The price is below both the 50-day moving average (MA50) of $113,090.95 and the 200-day moving average (MA200) of $110,032.77, indicating bearish sentiment in the short to medium term. The Relative Strength Index (RSI) stands at 32.4, approaching oversold territory, while the MACD shows a negative value of -2288.740, suggesting continued downward momentum. Caution is advised for potential
Warning Disclaimer
The content on MarketsFN.com is provided for educational and informational purposes only. It does not constitute financial advice. Cryptocurrency markets are highly volatile. Past performance does not guarantee future results. You are solely responsible for your investment decisions.