Palladium: Up 1.0% to $1369.50 — Above MA50 ($1309.15) — Constructive
QuoteReporter
•2 min read
Palladium: Up 1.0% to $1369.50 — Above MA50 ($1309.15) — Constructive
Analysis Date: September 09, 2026
📊 Current Market Data
CURRENT PRICE
$1369.50
DAILY CHANGE
+1.03%
WEEKLY CHANGE
+3.97%
52W HIGH
$2169.90
52W LOW
$1124.70
💡 Key Market Factors
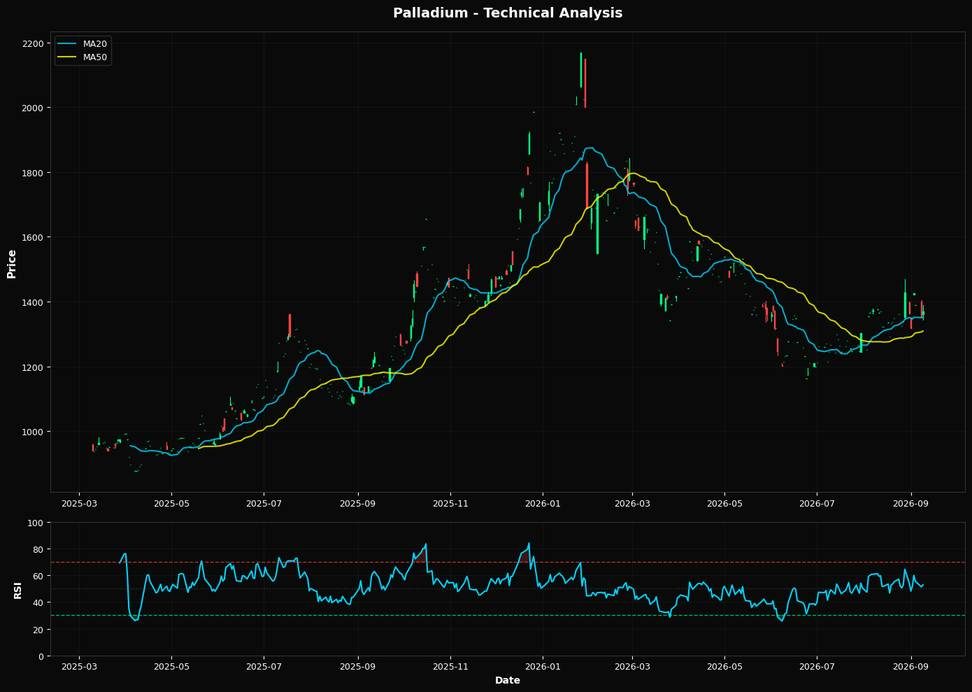
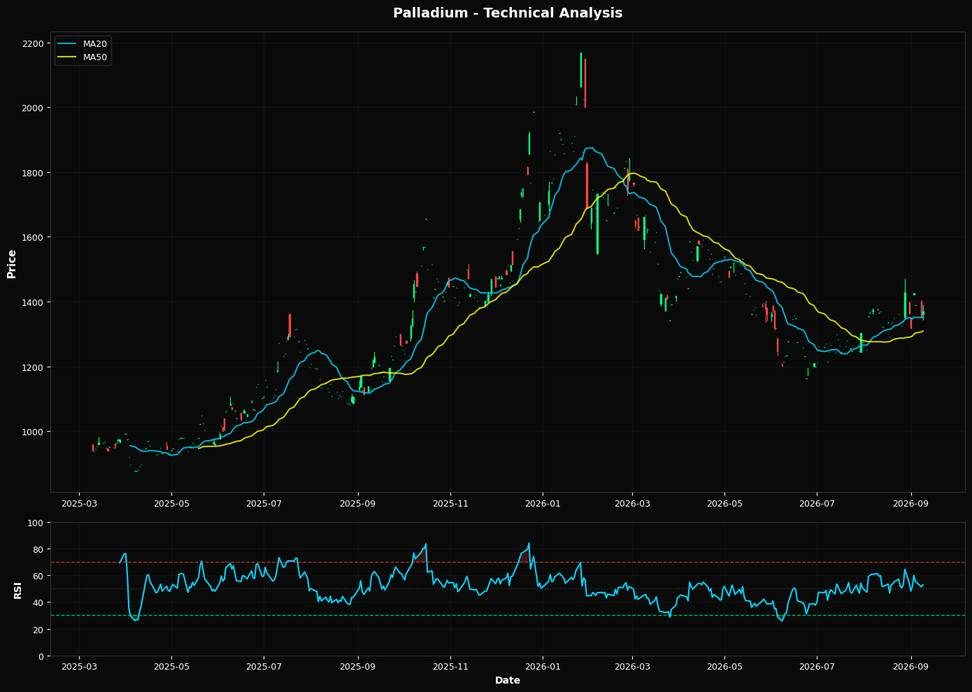
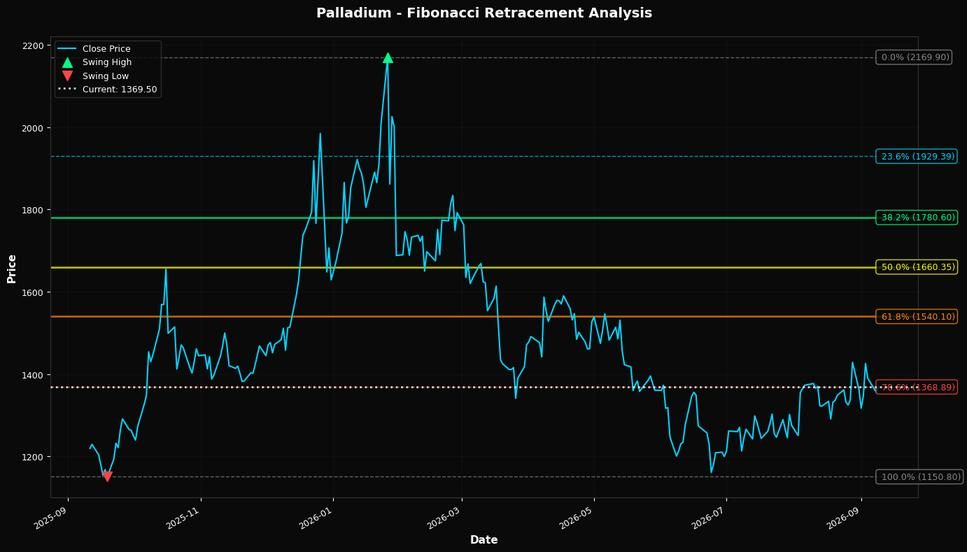
Palladium's recent price action suggests a cautiously bullish outlook, driven by a combination of technical resilience and macroeconomic influences. The most critical factor currently impacting palladium is the Federal Reserve's interest rate policy. As the Fed maintains a hawkish stance to combat inflation, the U.S. dollar has strengthened, typically a headwind for commodities priced in dollars. However, palladium's +3.97% weekly gain indicates that the market may be underestimating the resilience of industrial demand, particularly from the automotive sector, which relies heavily on palladium for catalytic converters. This demand could counterbalance the negative effects of a strong dollar, suggesting that the market might be mispricing the commodity's potential upside. From a technical perspective, palladium is showing signs of strength. The current price of $1369.50 is above both the 20-day moving average of $1350.50 and the 50-day moving average of $1309.15, indicating a short-term bullish trend. The RSI(14) at 52.8 suggests that the commodity is neither overbought nor oversold, providing room for further upward movement. However, the price remains below the 200-day moving average of $1500.61, which could act as a long-term resistance. The nearest Fibonacci support level at 61.8% is $1540.10, which, if breached, could signal a more sustained rally. This technical setup implies a cautiously optimistic bias, with potential for further gains if key resistance levels are overcome. A significant risk to this outlook is the potential for a shift in Fed policy. Should upcoming economic data, particularly inflation figures, suggest that the Fed might pause or reverse its rate hikes, the dollar could weaken, providing a tailwind for palladium prices. Conversely, stronger-than-expected inflation data could lead to further rate hikes, strengthening the dollar and pressuring palladium. The market may be underpricing the impact of such a policy shift, which could dramatically alter the demand dynamics for palladium. Looking ahead, the upcoming U.S. inflation report will be pivotal. A lower-than-expected inflation reading could validate the bullish case for palladium by easing the Fed's hawkish stance, potentially weakening the dollar and boosting commodity prices. Conversely, a higher reading could reinforce the Fed's current trajectory, posing a downside risk. This report will be crucial in confirming or invalidating the current cautiously bullish outlook for palladium.📈 Technical Indicators Summary
RSI (14)
52.8
50-Day MA
$1309.15
200-Day MA
$1500.61
Fib Level
61.8%
📊 Technical Analysis Chart (18-Month View)
📐 Fibonacci Retracement Analysis
🎯 Key Trading Levels
Key Fibonacci Levels:
- 38.2%: $1780.60
- 50.0%: $1660.35
- 61.8%: $1540.10
Support: $1150.80 (Swing Low), $1309.15 (50-Day MA)
Resistance: $2169.90 (Swing High)
Disclaimer
The content on MarketsFN.com is provided for educational and informational purposes only. It does not constitute financial advice, investment recommendations, or trading guidance. All investments involve risks, and past performance does not guarantee future results. You are solely responsible for your investment decisions and should conduct independent research and consult a qualified financial advisor before acting. MarketsFN.com and its authors are not liable for any losses or damages arising from your use of this information.