Palladium Rallies 11.8%
MarketsFN Team
•1 min read
Palladium Rallies 11.8%
Analysis Date: April 08, 2026
📊 Current Market Data
CURRENT PRICE
$1612.50
DAILY CHANGE
+11.82%
WEEKLY CHANGE
+9.60%
52W HIGH
$2169.90
52W LOW
$876.60
💡 Key Market Factors
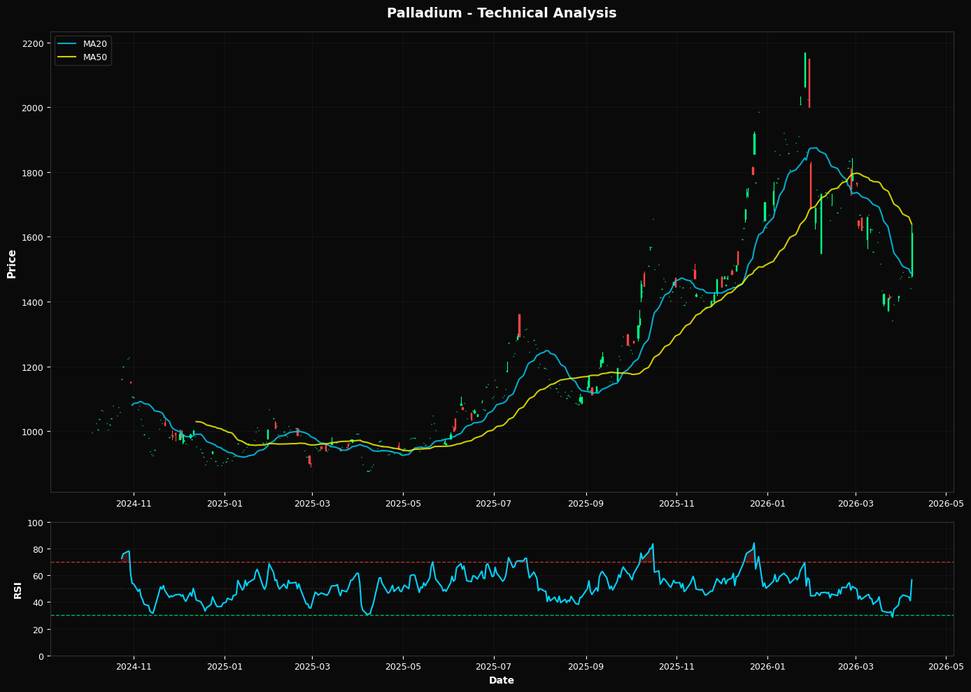
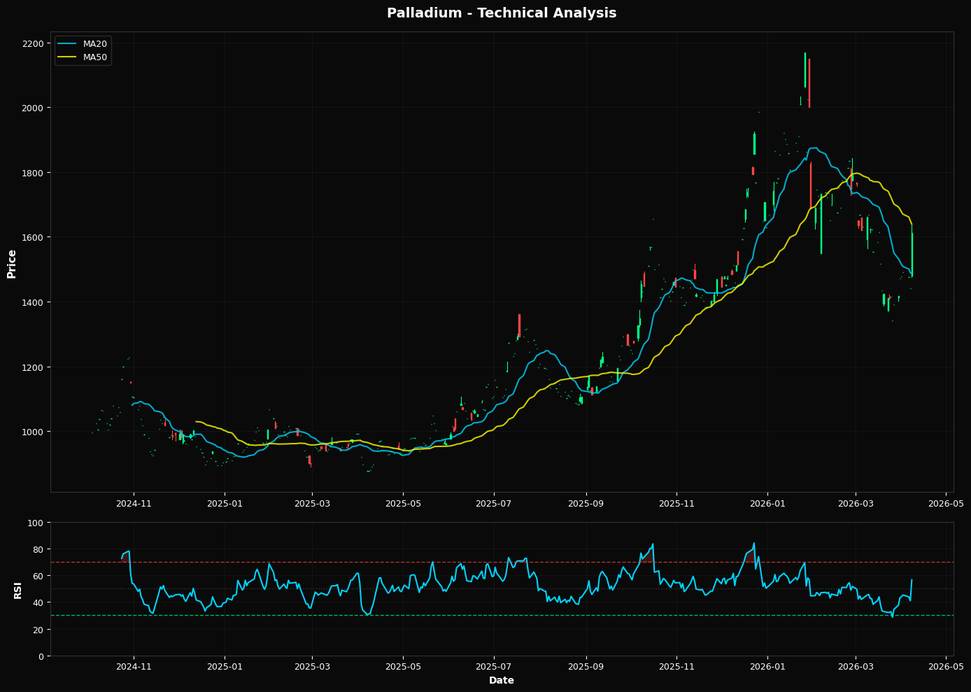
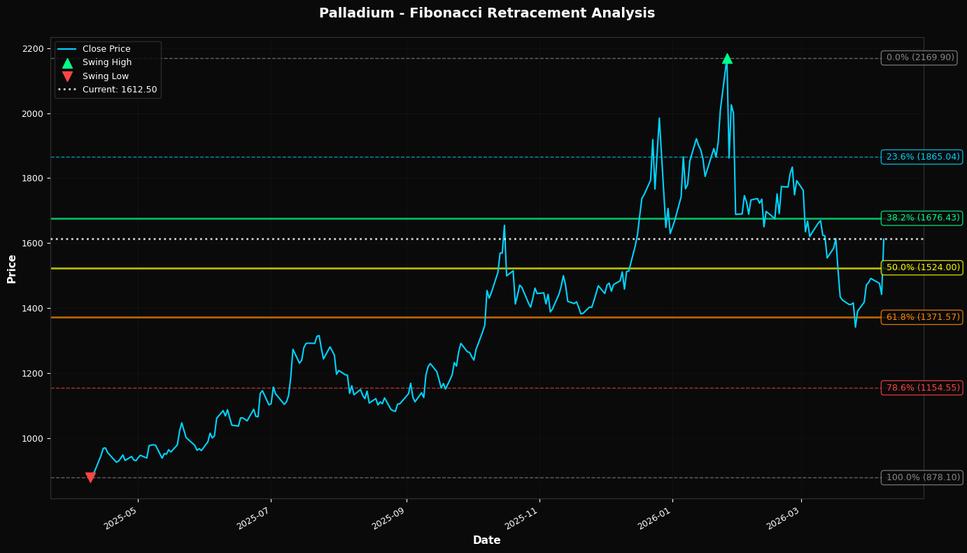
Palladium's recent price surge to $1612.50, marking an 11.82% daily increase, can be partially attributed to shifting inflation expectations. As inflationary pressures persist, driven by energy costs and supply chain disruptions, industrial metals like palladium are seeing increased demand as a hedge against currency devaluation. This dynamic is particularly relevant given palladium's critical role in automotive catalytic converters, where demand remains robust. Interest rates are a crucial factor as the Federal Reserve's recent signals suggest a potential pause in rate hikes, fostering a more favorable environment for commodities. Lower borrowing costs can stimulate industrial activity, thereby increasing palladium demand. However, any unexpected hawkish pivot could quickly dampen this momentum, making it essential to monitor upcoming Fed communications closely. From a technical perspective, palladium's price has surpassed the 20-day moving average of $1486.79, indicating short-term bullish momentum, yet remains below the 50-day moving average of $1638.77, suggesting potential resistance ahead. The RSI at 56.6 reflects a neutral stance, providing room for further upward movement without entering overbought territory. Key resistance is identified at the Fibonacci 38.2% retracement level of $1676.43, which could act as a significant barrier if the current rally continues.📈 Technical Indicators Summary
RSI (14)
56.6
50-Day MA
$1638.77
200-Day MA
$1449.56
Fib Level
38.2%
📊 Technical Analysis Chart (18-Month View)
📐 Fibonacci Retracement Analysis
🎯 Key Trading Levels
Key Fibonacci Levels:
- 38.2% Level: $1676.43
- 50.0% Level: $1524.00
- 61.8% Level: $1371.57
Support: $878.10 (Swing Low), $1638.77 (50-day MA)
Resistance: $2169.90 (Swing High)
Disclaimer
The content on MarketsFN.com is provided for educational and informational purposes only. It does not constitute financial advice, investment recommendations, or trading guidance. All investments involve risks, and past performance does not guarantee future results. You are solely responsible for your investment decisions and should conduct independent research and consult a qualified financial advisor before acting. MarketsFN.com and its authors are not liable for any losses or damages arising from your use of this information.