NZD/USD: Down 0.15% to 0.5602 — RSI Signals Oversold
MarketsFN Team
NZD/USD: Down 0.15% to 0.5602 — RSI Signals Oversold
Published: October 12, 2026 · MarketsFN Team
| Pair | Rate | Change | RSI(14) | SMA-20 | SMA-50 | 52W High | 52W Low | Pivot | R1 | S1 |
|---|---|---|---|---|---|---|---|---|---|---|
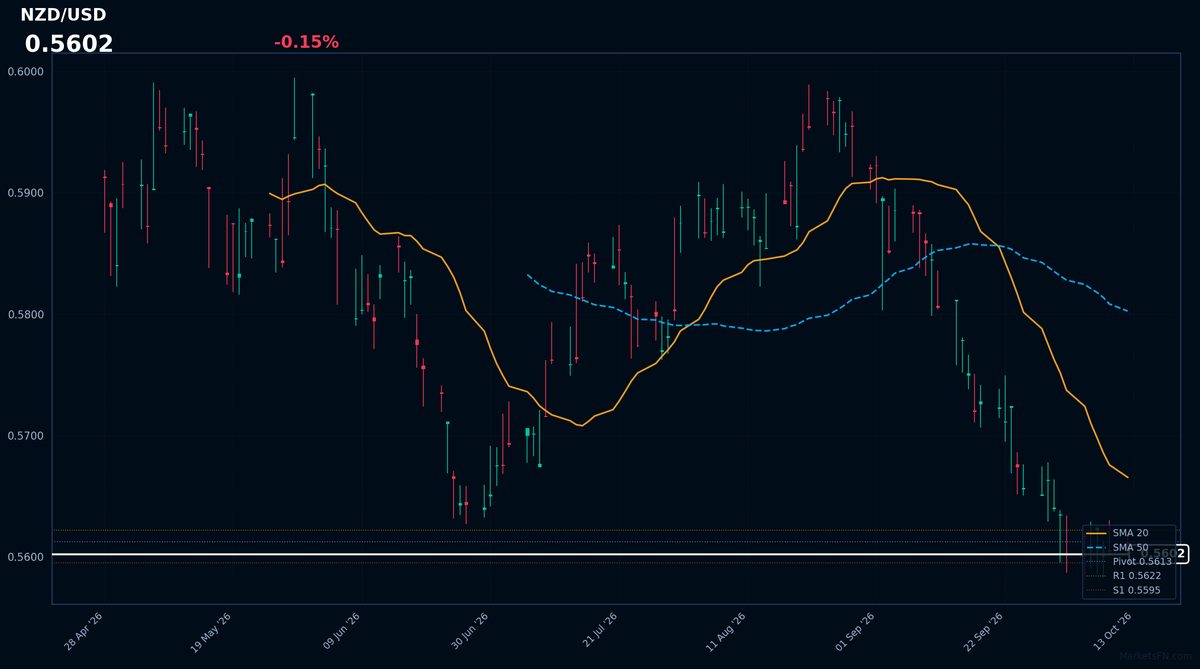
| NZD/USD | 0.5602 | -0.15% | 28.5 | 0.5666 | 0.5803 | 0.5982 | 0.5599 | 0.5613 | 0.5622 | 0.5595 |
NZD/USD is trading at 0.5602 (-0.15%), and the pair is currently trapped in a severe bearish spiral that the market is mispricing as a mere dip rather than a structural breakdown. The price action is aggressively bearish, with the current rate of 0.5602 sitting dangerously close to the 52-week low of 0.5599. This is not a healthy correction; it is a collapse. The technicals confirm a dominant downtrend, as the rate is trading well below both the SMA-20 of 0.5666 and the SMA-50 of 0.5803. While the RSI(14) of 28.5 places the pair in oversold territory, this is likely a value trap given the momentum. With an ATR(14) of 0.0039, volatility remains tight, suggesting a slow bleed rather than a volatile reversal. The immediate battleground is the pivot at 0.5613; failing to reclaim this level keeps the path open toward S1 support at 0.5595. Any attempt to rally will face stiff resistance at R1 of 0.5622. The market is underpricing the risk of a total breach of the 52-week floor. I expect the path of least resistance to remain lower until a decisive close above the SMA-20 of 0.5666 occurs. The critical catalyst to invalidate this bearish view would be a break and hold above the pivot of 0.5613 during the next North American session.
Disclaimer
The content on MarketsFN.com is provided for educational and informational purposes only. It does not constitute financial advice or investment recommendations. All investments involve risks and past performance does not guarantee future results. You are solely responsible for your investment decisions.