Nikkei 225 Market Update – May 11, 2026
MarketsFN Team
Nikkei 225 Market Update – May 11, 2026
Published: May 11, 2026 · MarketsFN Team
| Index | Price | Change | RSI(14) | SMA-20 | 52W High | 52W Low |
|---|---|---|---|---|---|---|
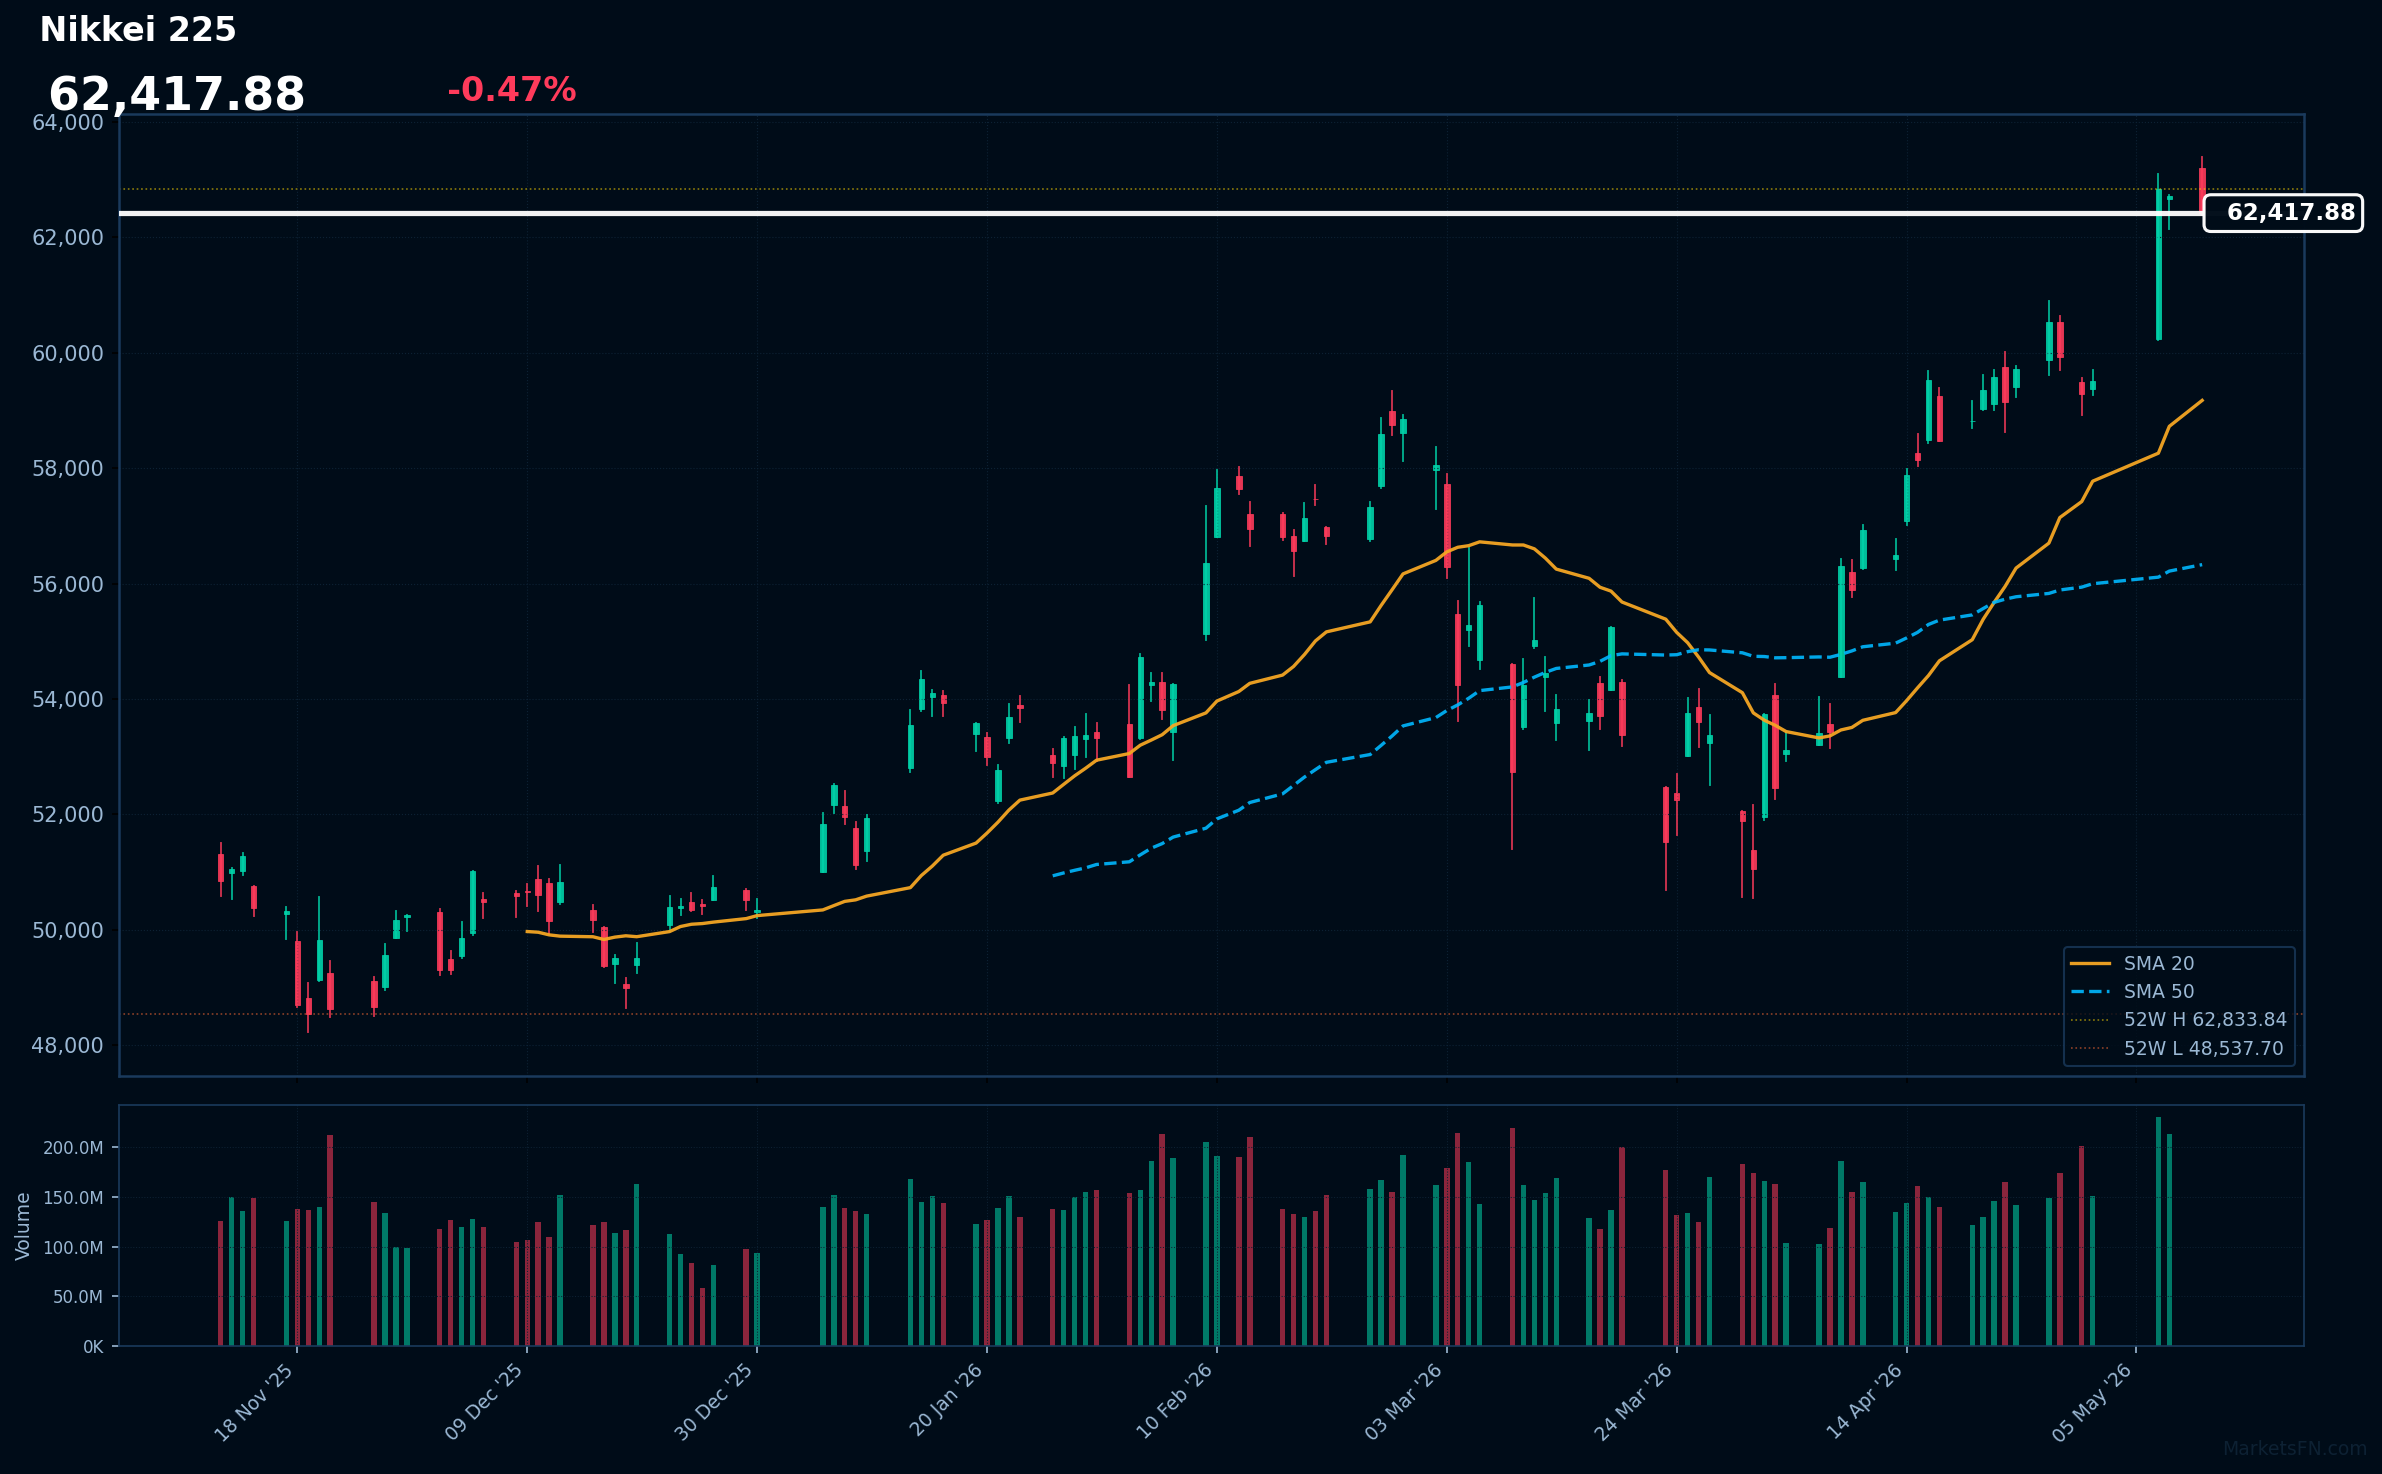
| Nikkei 225 | 62,418 | -0.47% | 70.2 | 59,174 | 62,834 | 48,538 |
The Nikkei 225 closed at 62,418 (-0.47%) on the day, reflecting a slight pullback amid a session that saw prices fluctuate between 62,381 and 63,385. This decline comes after a recent rally, suggesting a potential consolidation phase as market participants reassess the index’s valuation following its ascent to near-record highs.
From a technical standpoint, the index remains well above both the 20-day and 50-day simple moving averages (SMA) of 59,174 and 56,328, respectively, indicating a strong bullish trend. However, the Relative Strength Index (RSI) at 70.2 signals that the market is in overbought territory, which could lead to increased volatility or profit-taking in the near term. The index's 52-week range of 48,538 to 62,834 underscores the substantial gains made over the past year, but it also highlights the potential for corrective moves.
Looking ahead, key levels to watch include the psychological barrier at 63,000 and support around the recent low of 62,381. A sustained move below the latter could indicate a shift in momentum, while a rebound above 63,000 may reinvigorate bullish sentiment.
Disclaimer
The content on MarketsFN.com is provided for educational and informational purposes only. It does not constitute financial advice or investment recommendations. All investments involve risks and past performance does not guarantee future results. You are solely responsible for your investment decisions.