Nikkei 225 Market Update – May 07, 2026
MarketsFN Team
Nikkei 225 Market Update – May 07, 2026
Published: May 07, 2026 · MarketsFN Team
| Index | Price | Change | RSI(14) | SMA-20 | 52W High | 52W Low |
|---|---|---|---|---|---|---|
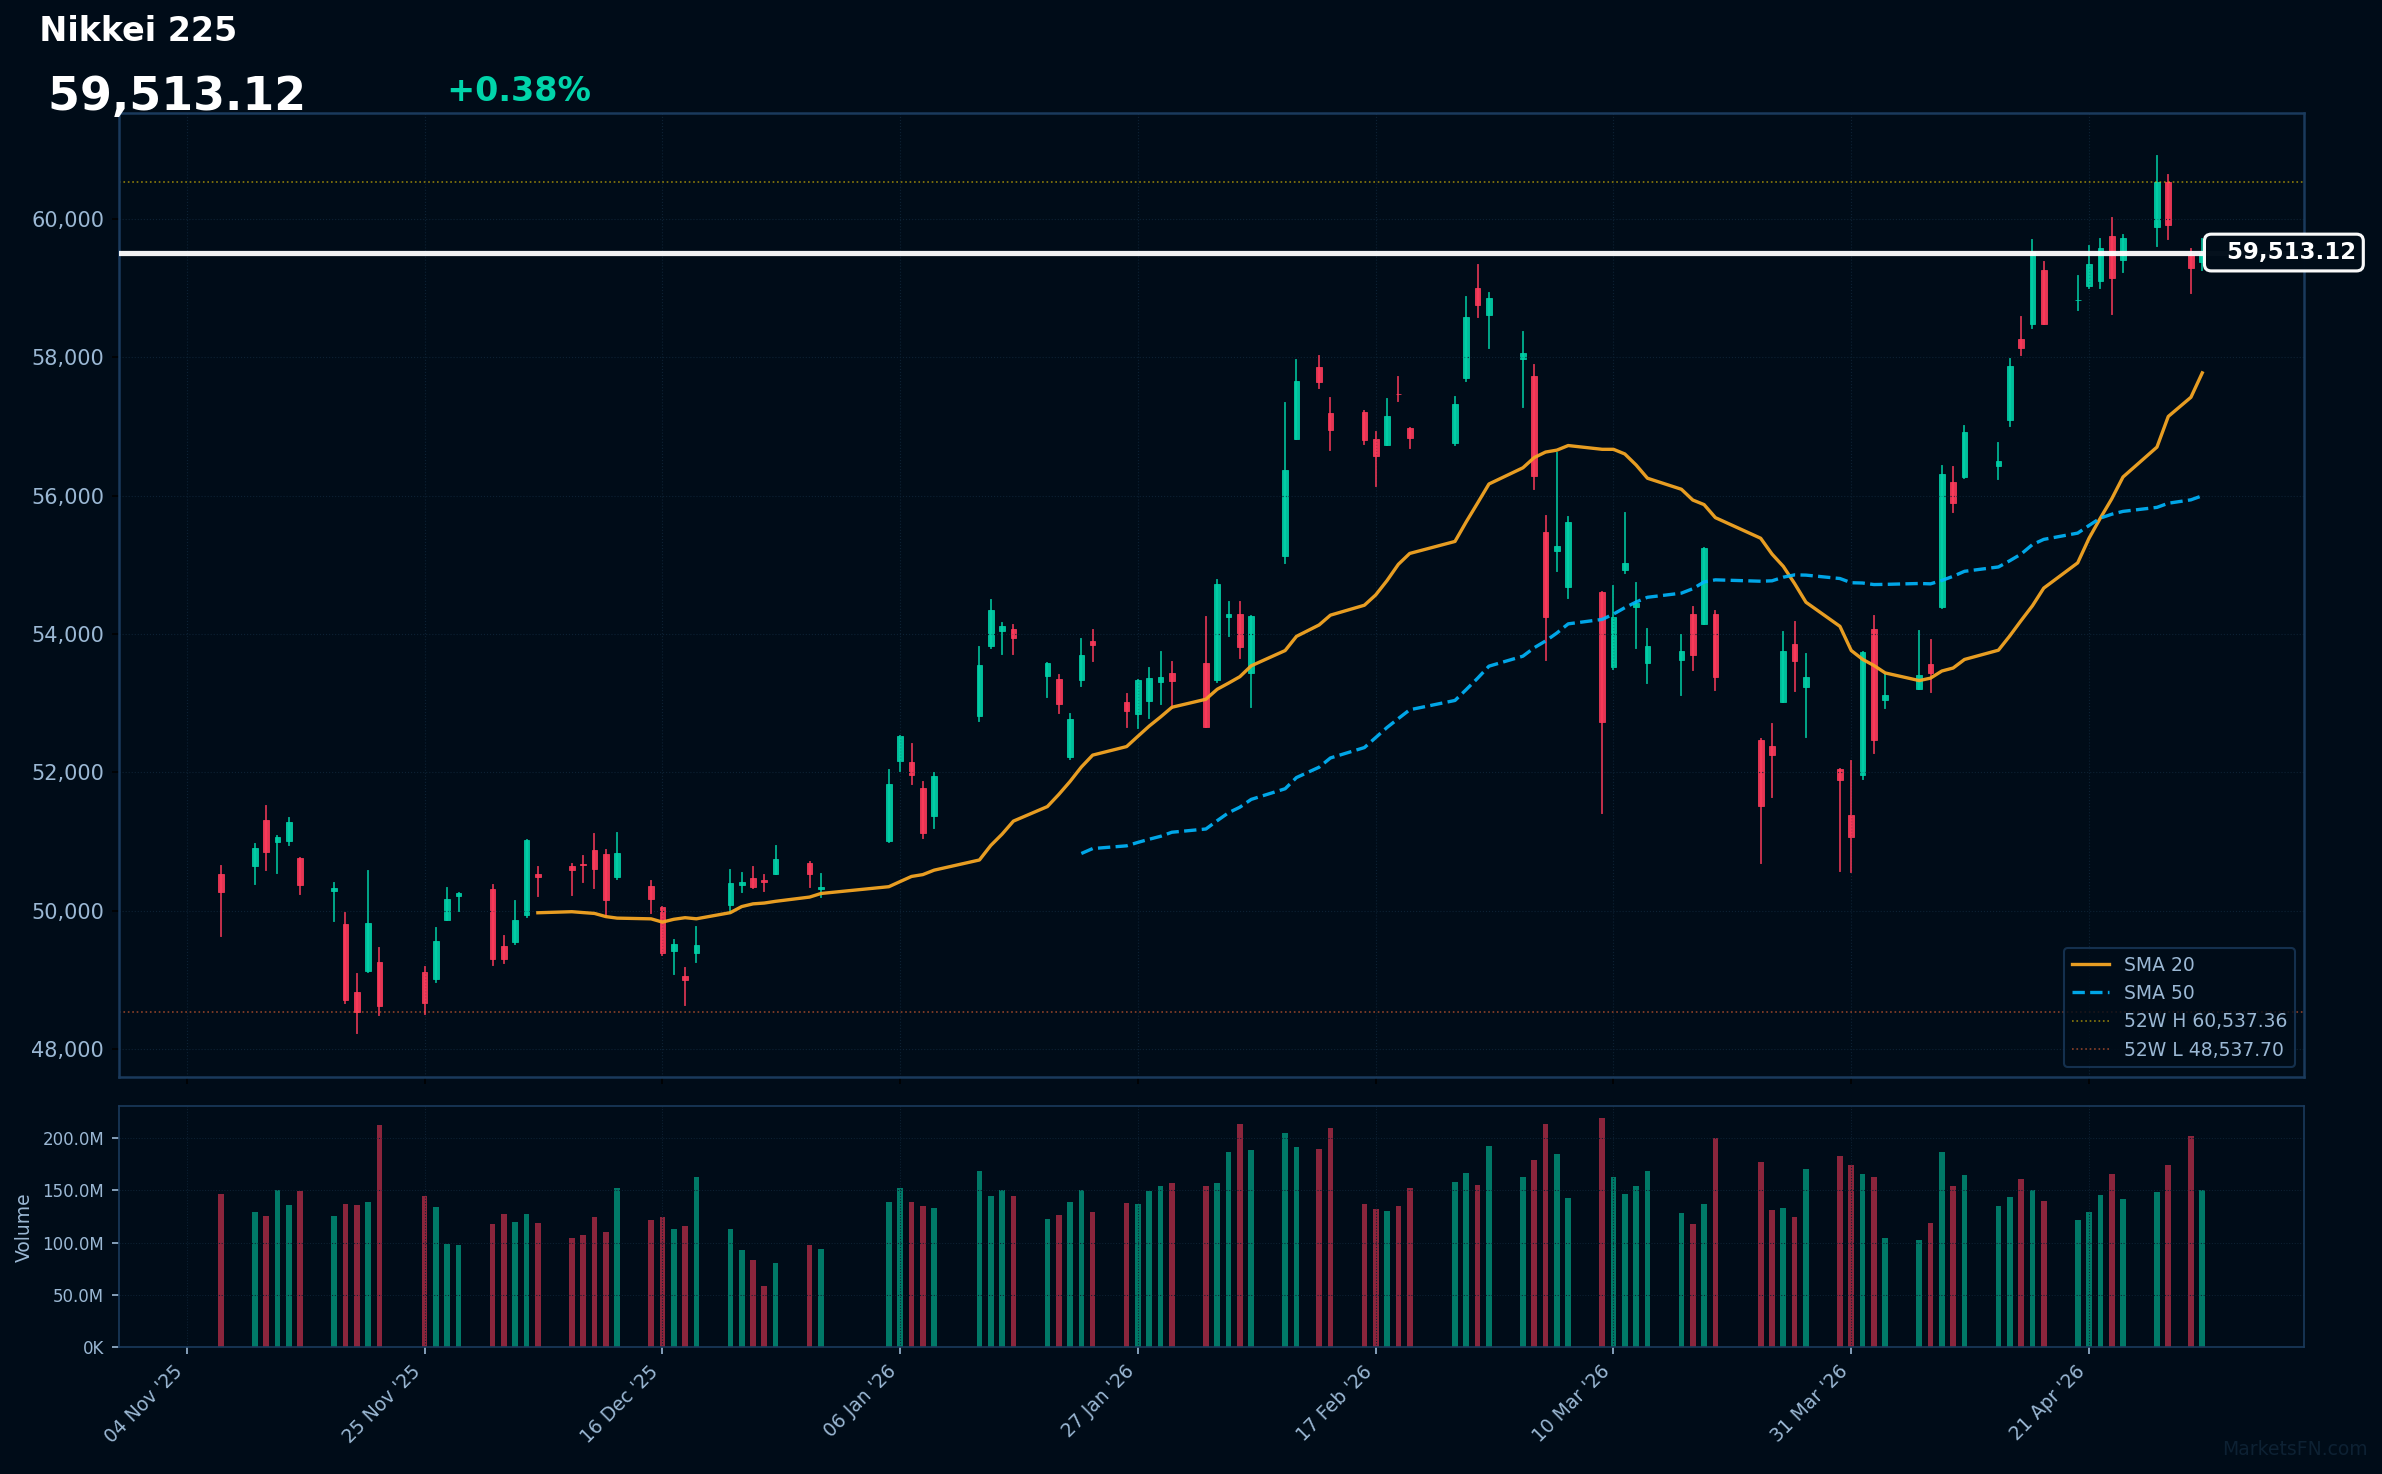
| Nikkei 225 | 59,513 | +0.38% | 64.5 | 57,774 | 60,537 | 48,538 |
The Nikkei 225 closed at 59,513 (+0.38%) on the day, continuing its upward momentum as it approaches key resistance levels. The index traded within a day range of 59,264 to 59,707, indicating a stable performance despite global market fluctuations, and suggesting underlying strength in the Japanese equities amid a generally risk-on sentiment.
From a technical perspective, the Nikkei remains well above both its 20-day simple moving average (SMA) of 57,774 and its 50-day SMA of 55,998, reinforcing a bullish trend. The relative strength index (RSI) at 64.5 signals that the index is in neutral territory, allowing for potential upside without immediate overbought conditions. The current 52-week range of 48,538 to 60,537 indicates that the index is nearing the upper boundary, which could act as a significant resistance level.
Looking ahead, key levels to watch include the psychological barrier at 60,000 and the recent high of 60,537. A sustained breach above these levels could open the door for further gains, while a retreat below the 58,000 mark may signal a correction.
Disclaimer
The content on MarketsFN.com is provided for educational and informational purposes only. It does not constitute financial advice or investment recommendations. All investments involve risks and past performance does not guarantee future results. You are solely responsible for your investment decisions.