Nikkei 225 Market Update – April 24, 2026
MarketsFN Team
Nikkei 225 Market Update – April 24, 2026
Published: April 24, 2026 · MarketsFN Team
| Index | Price | Change | RSI(14) | SMA-20 | 52W High | 52W Low |
|---|---|---|---|---|---|---|
| Nikkei 225 | 59,140 | -0.75% | 78.2 | 55,951 | 59,586 | 48,538 |
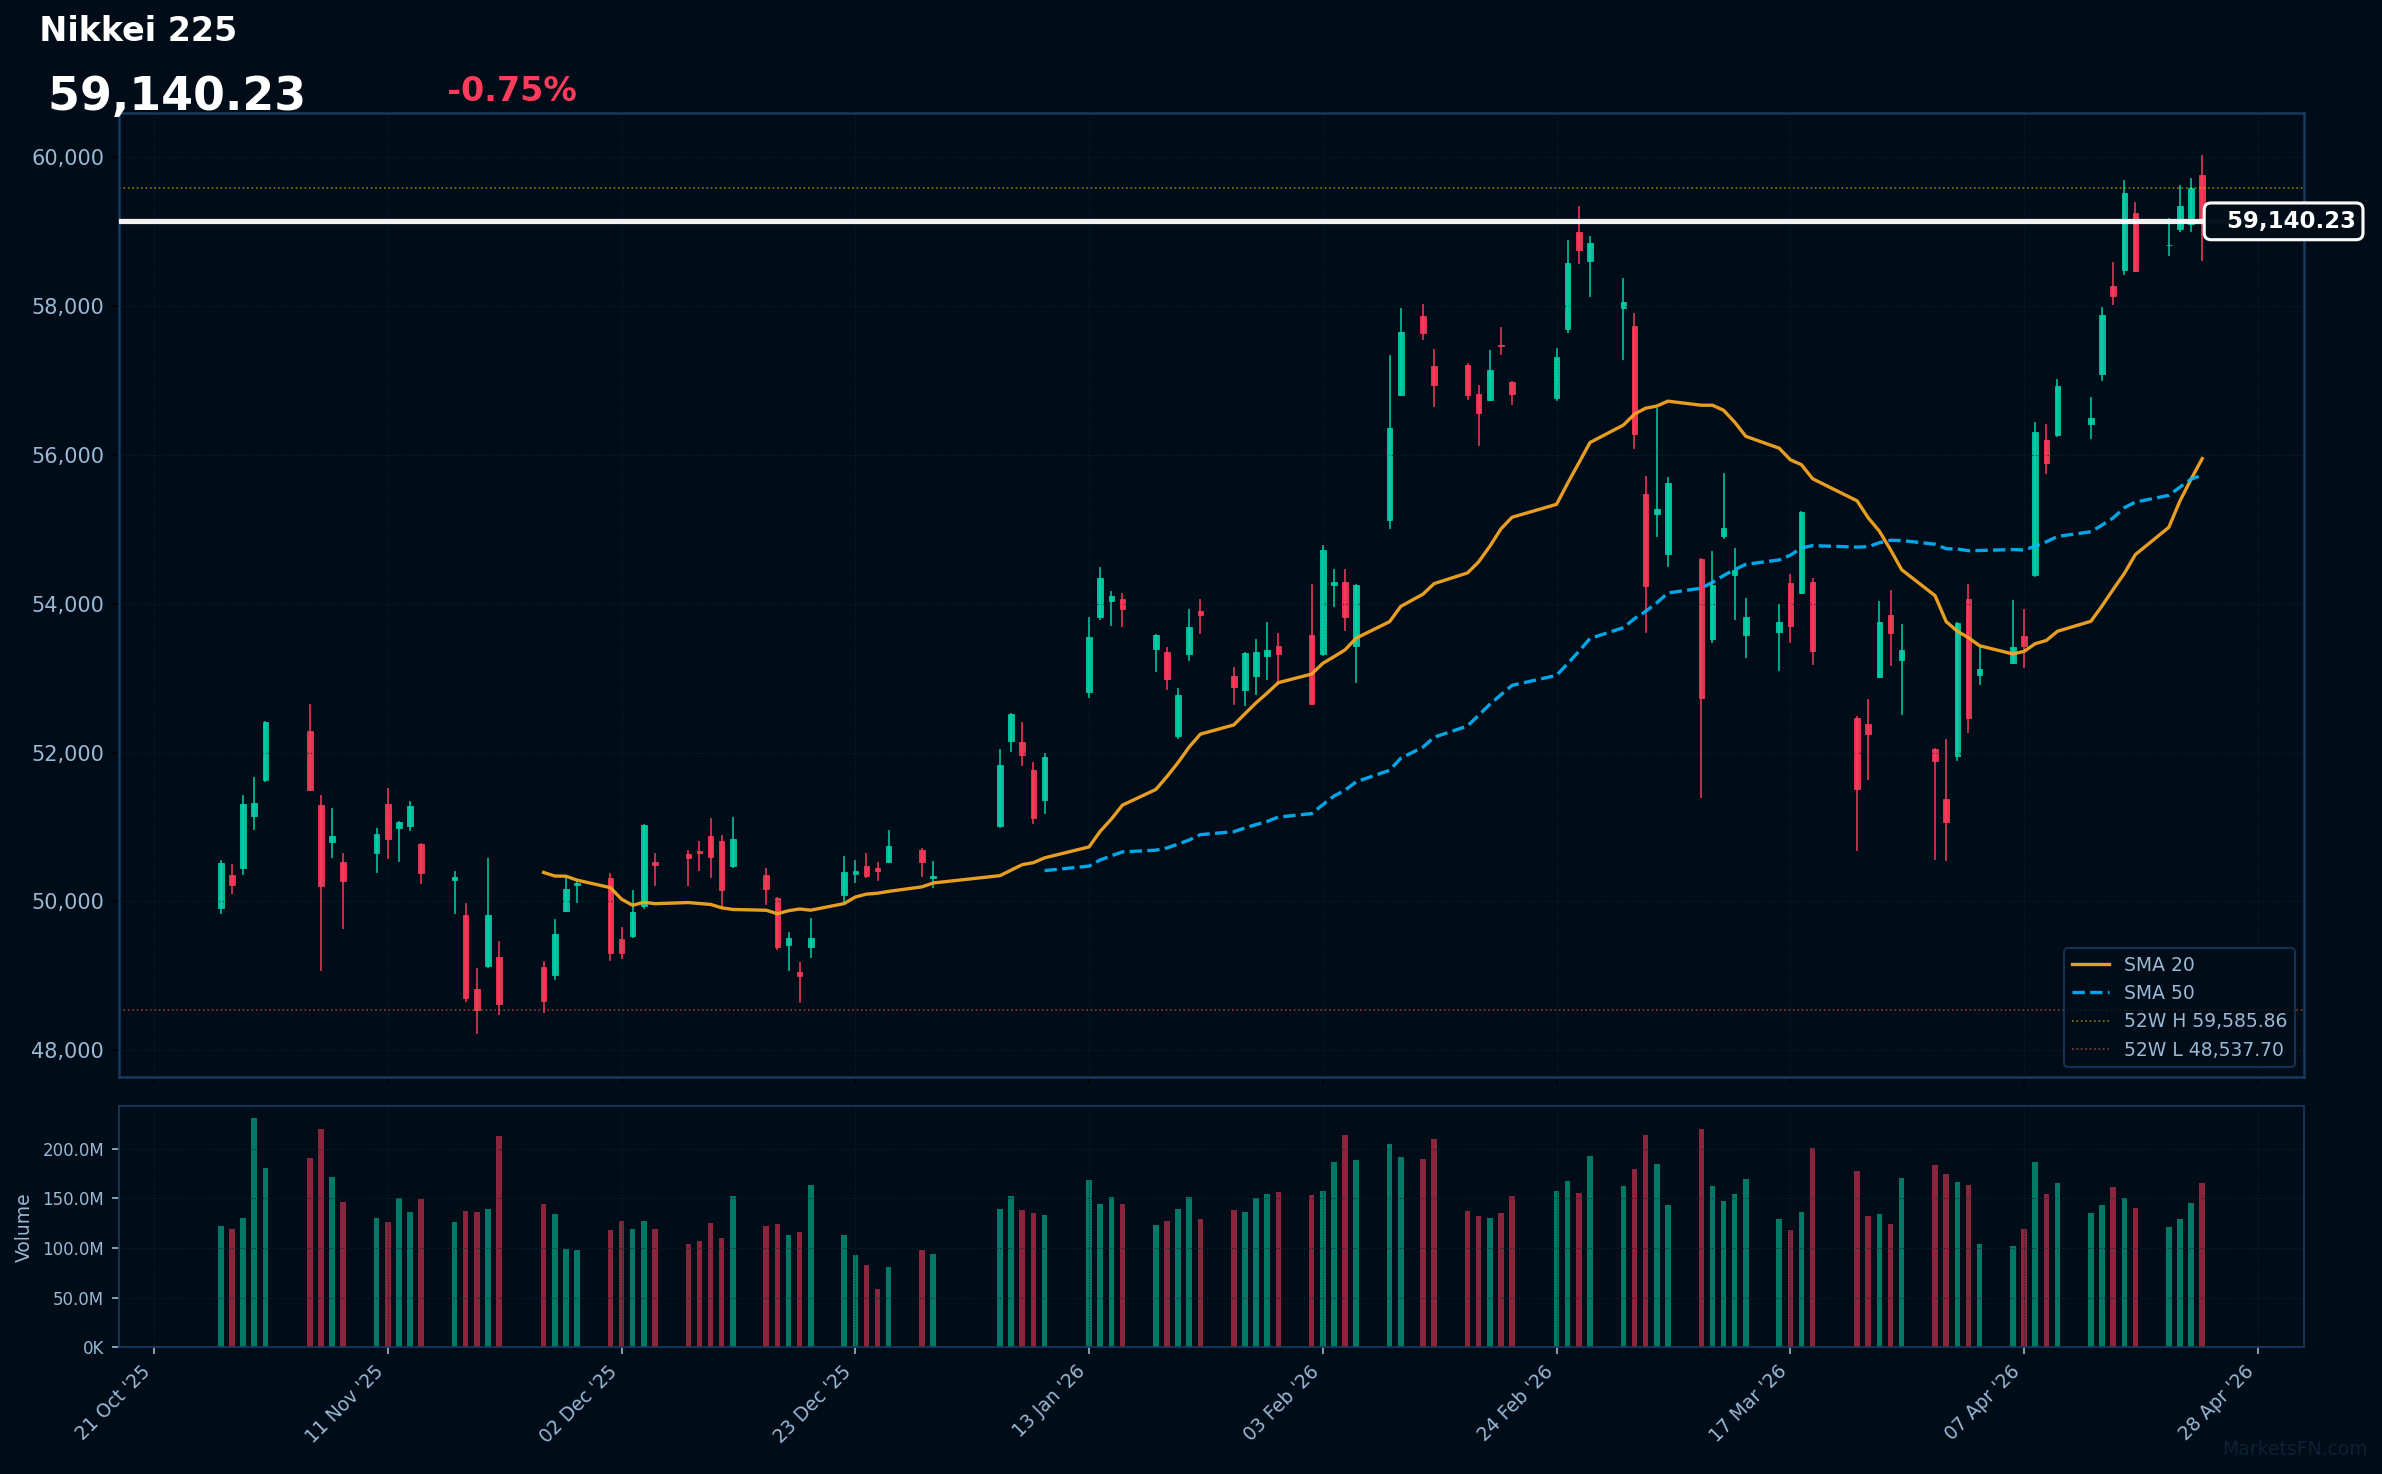
The Nikkei 225 closed at 59,140 (-0.75%) amid a volatile trading session that saw the index oscillate between a low of 58,621 and a high of 60,014. The day's decline reflects a slight pullback after recent gains, highlighting a cautious sentiment among investors as the index approaches its 52-week high of 59,586.
From a technical perspective, the Nikkei remains in a robust position, trading above both the 20-day simple moving average (SMA) of 55,951 and the 50-day SMA of 55,730, indicating a bullish trend. However, the 14-day Relative Strength Index (RSI) at 78.2 signals that the index is entering overbought territory, suggesting that a correction could be on the horizon.
Looking ahead, key levels to watch include the psychological resistance at 60,000 and the support level around 58,500. A sustained move above 60,000 may open the door for further gains, while a breach below 58,500 would warrant closer scrutiny of market momentum.
Disclaimer
The content on MarketsFN.com is provided for educational and informational purposes only. It does not constitute financial advice or investment recommendations. All investments involve risks and past performance does not guarantee future results. You are solely responsible for your investment decisions.