NIFTY 50 Surges 1.42% Amid Mixed Asian Market Sentiment
MarketsFN Team
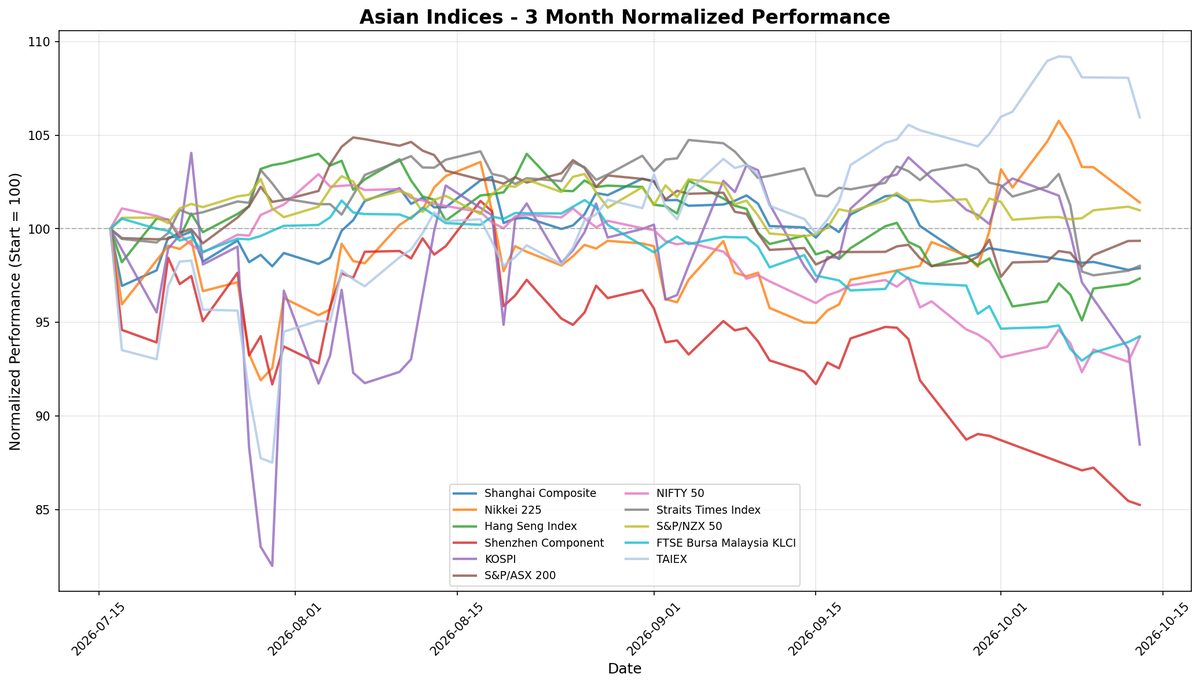
NIFTY 50 Surges 1.42% Amid Mixed Asian Market Sentiment
Note: This analysis covers the Asian trading session close for October 13, 2026. All times are in US Eastern Time (ET).
📊 Asian Indices Performance
| Index | Price | Daily Change (%) |
|---|---|---|
| Shanghai Composite | 3,800.86 | +0.10% |
| Nikkei 225 | 67,777.52 | -1.82% |
| Hang Seng Index | 24,345.22 | +0.30% |
| Shenzhen Component | 12,353.70 | -0.25% |
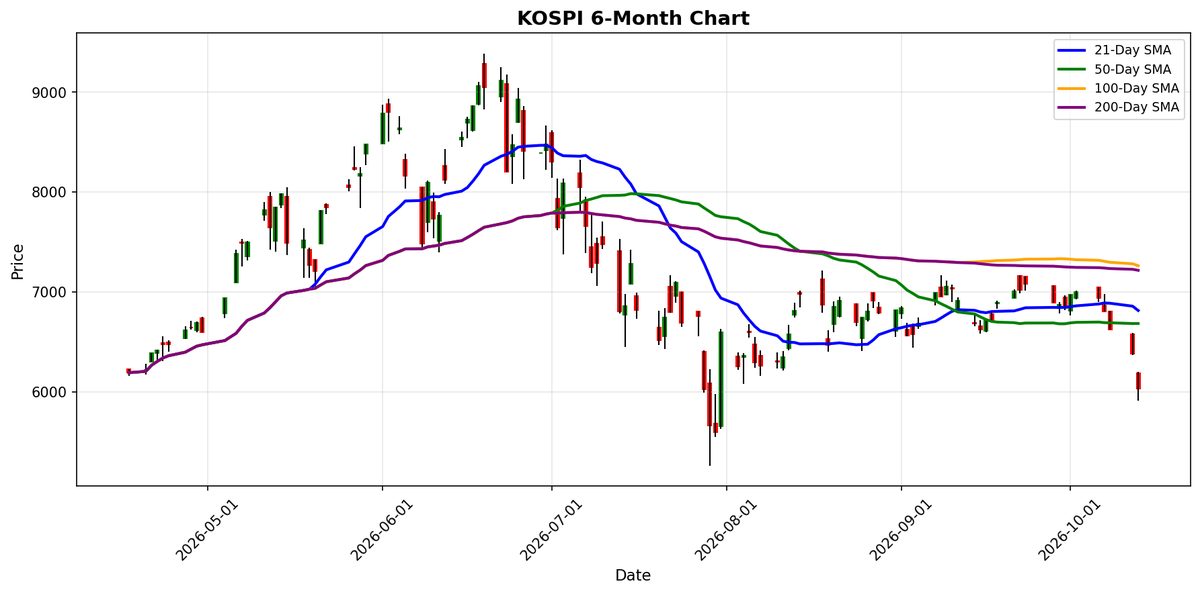
| KOSPI | 6,035.35 | -5.46% |
| S&P/ASX 200 | 8,783.90 | +0.01% |
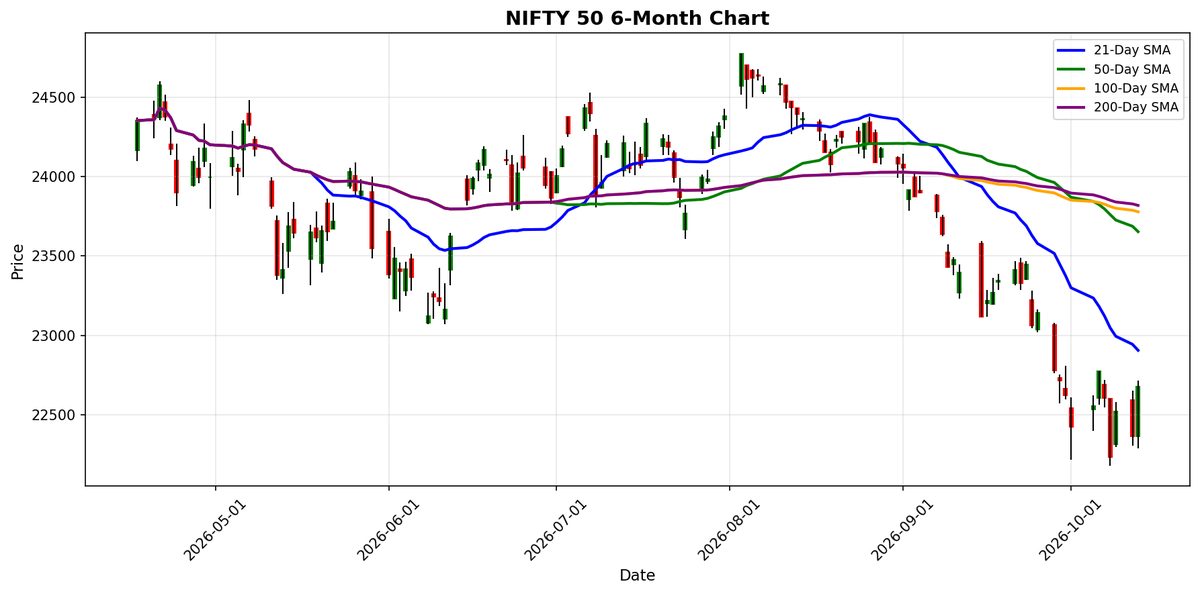
| NIFTY 50 | 22,680.45 | +1.42% |
| Straits Times Index | 5,429.75 | +0.26% |
| S&P/NZX 50 | 13,749.60 | -0.19% |
| FTSE Bursa Malaysia KLCI | 1,623.35 | +0.33% |
| TAIEX | 48,341.31 | -1.95% |
📰 Market Commentary
As of October 13, 2026, Asian markets exhibited mixed performance influenced by a combination of regional economic developments and global market sentiments, particularly in the technology sector. **Key Events Impacting Asian Indices:** 1. **Tokyo Stock Exchange:** The Nikkei 225 index fell by 1.82%, primarily due to a decline in heavyweight technology stocks. In contrast, bank stocks showed resilience, contributing to a mixed close for the market. 2. **Technology Sector:** A broader sell-off in U.S. semiconductor shares negatively impacted Asian technology stocks, with notable declines in companies like Micron, SoftBank, and ASML. This trend was reflected in the KOSPI, which dropped significantly by 5.46%. 3. **Chinese Indices:** The Shanghai Composite saw a slight increase of 0.10%, while the Shenzhen Component dipped by 0.25%. The mixed performance indicates a cautious sentiment amid ongoing economic challenges. **Market Sentiment and Price Movements:** - **General Sentiment:** Market sentiment was cautious, particularly in the tech sector, as investors reacted to the downturn in U.S. markets. This led to significant declines in technology-heavy indices like the KOSPI and TAIEX, which fell by 5.46% and 1.95%, respectively. - **Regional Indices:** The Hang Seng Index and Straits Times Index showed modest gains of 0.30% and 0.26%, respectively, suggesting a degree of resilience in these markets despite external pressures. The NIFTY 50 in India also performed well, increasing by 1.42%, reflecting stronger domestic economic fundamentals. **Regional Economic Developments:** 1. **China-Russia Cooperation:** China and Russia announced plans to deepen maritime and logistical cooperation to secure energy supplies, which may impact regional trade dynamics and investor confidence. 2. **Hong Kong's Postal Service:** The Hong Kong government is addressing financial strains within its postal service by offering priority for civil service roles to postmen denied permanent contracts, highlighting ongoing economic challenges in the region. 3. **Singapore's Currency Policy:** Prime Minister Lawrence Wong emphasized that Singapore would not resort to weakening its currency as a means to enhance competitiveness, indicating a commitment to maintaining economic stability. Overall, the Asian markets on October 13, 2026, reflected a complex interplay of local economic conditions and external market influences, particularly from the technology sector, leading to varied performances across different indices.
📅 Economic Calendar - Asian Session
All times are in US Eastern Time (ET)
| Date | Time | Cur | Imp | Event | Actual | Forecast |
|---|---|---|---|---|---|---|
| 2026-10-13 | 21:30 | 🇨🇳 | Medium | CPI (YoY) (Sep) | 1.0% | |
| 2026-10-13 | 21:30 | 🇨🇳 | Medium | CPI (MoM) (Sep) | ||
| 2026-10-13 | 21:30 | 🇨🇳 | Medium | PPI (YoY) (Sep) | 4.5% |
On October 13, 2026, several key economic indicators were released from China, which are crucial for traders to monitor due to their potential impact on market sentiment and Asian indices. 1. **Consumer Price Index (CPI) (YoY)** for September: - **Actual**: Not provided - **Forecast**: 1.0% - **Market Implications**: The CPI is a critical measure of inflation. If the actual figure is below the forecast of 1.0%, it could signal weaker consumer demand and prompt concerns about economic growth, potentially leading to bearish sentiment in the markets. Conversely, a higher-than-expected CPI could indicate rising inflationary pressures, which might lead to tighter monetary policy, impacting market performance. 2. **CPI (MoM)** for September: - **Actual**: Not provided - **Forecast**: Not provided - **Market Implications**: Although the monthly figure is not available, the month-over-month CPI is important for assessing short-term inflation trends. Traders should remain cautious as this data can influence expectations regarding the central bank's monetary policy. 3. **Producer Price Index (PPI) (YoY)** for September: - **Actual**: Not provided - **Forecast**: 4.5% - **Market Implications**: The PPI reflects the average change over time in the selling prices received by domestic producers for their output. An actual PPI figure below 4.5% could indicate weakening producer prices, which may lead to concerns about profit margins and economic activity, likely negatively affecting Asian indices. A higher-than-expected PPI could suggest inflationary pressures at the production level, potentially leading to increased costs for consumers down the line. In summary, the lack of actual data for the CPI and PPI releases on October 13, 2026, leaves uncertainty in the market. Traders should closely monitor these indicators as they are
📈 Index Performance Charts
Best Performer: NIFTY 50
Worst Performer: KOSPI
💱 FX, Commodities & Crypto
### Summary of Market Performance **Commodities:** - **Gold:** Priced at $4,208.70, gold experienced a daily increase of 0.43%. The rise can be attributed to ongoing geopolitical tensions and inflation concerns, which typically drive investors towards safe-haven assets. - **Silver:** With a price of $60.71, silver saw a daily increase of 0.95%. Similar to gold, silver's performance is influenced by its dual role as both an industrial metal and a store of value amid economic uncertainty. - **Crude Oil (WTI):** Crude oil is currently priced at $91.95, reflecting a daily decline of 1.91%. This drop may be linked to fluctuating demand forecasts and concerns over potential economic slowdowns, which can impact consumption levels. **Cryptocurrencies:** - **Bitcoin:** Bitcoin's price stands at $83,351, marking a daily increase of 1.94%. The positive movement is driven by renewed institutional interest and favorable regulatory developments, enhancing market confidence. - **Ethereum:** Priced at $2,505, Ethereum saw a daily rise of 2.48%. The growth is largely fueled by advancements in decentralized finance (DeFi) and ongoing upgrades to its network, which are expected to improve scalability and efficiency. ### Market Drivers: - **Geopolitical Tensions:** Ongoing global uncertainties continue to bolster safe-haven assets like gold and silver. - **Economic Indicators:** Fluctuations in crude oil prices are influenced by demand forecasts and potential economic slowdowns. - **Institutional Interest in Crypto:** Increased participation from institutional investors is driving the upward momentum in Bitcoin and Ethereum prices, alongside technological advancements in the blockchain
Commodities
| Commodity | Price | Daily Change (%) |
|---|---|---|
| Gold | $4208.70 | +0.43% |
| Silver | $60.71 | +0.95% |
| Crude Oil (WTI) | $91.95 | -1.91% |
Cryptocurrencies
| Asset | Price | Daily Change (%) |
|---|---|---|
| Bitcoin | $83,351 | +1.94% |
| Ethereum | $2,505 | +2.48% |
Disclaimer
The content on MarketsFN.com is provided for educational and informational purposes only. It does not constitute financial advice, investment recommendations, or trading guidance. All investments involve risks, and past performance does not guarantee future results. You are solely responsible for your investment decisions and should conduct independent research and consult a qualified financial advisor before acting. MarketsFN.com and its authors are not liable for any losses or damages arising from your use of this information.