Natural Gas: Down 2.1% to $2.91 — Above MA50 ($2.88) — Constructive
QuoteReporter
•2 min read
Natural Gas: Down 2.1% to $2.91 — Above MA50 ($2.88) — Constructive
Analysis Date: September 08, 2026
📊 Current Market Data
CURRENT PRICE
$2.91
DAILY CHANGE
-2.05%
WEEKLY CHANGE
-0.72%
52W HIGH
$7.83
52W LOW
$2.48
💡 Key Market Factors
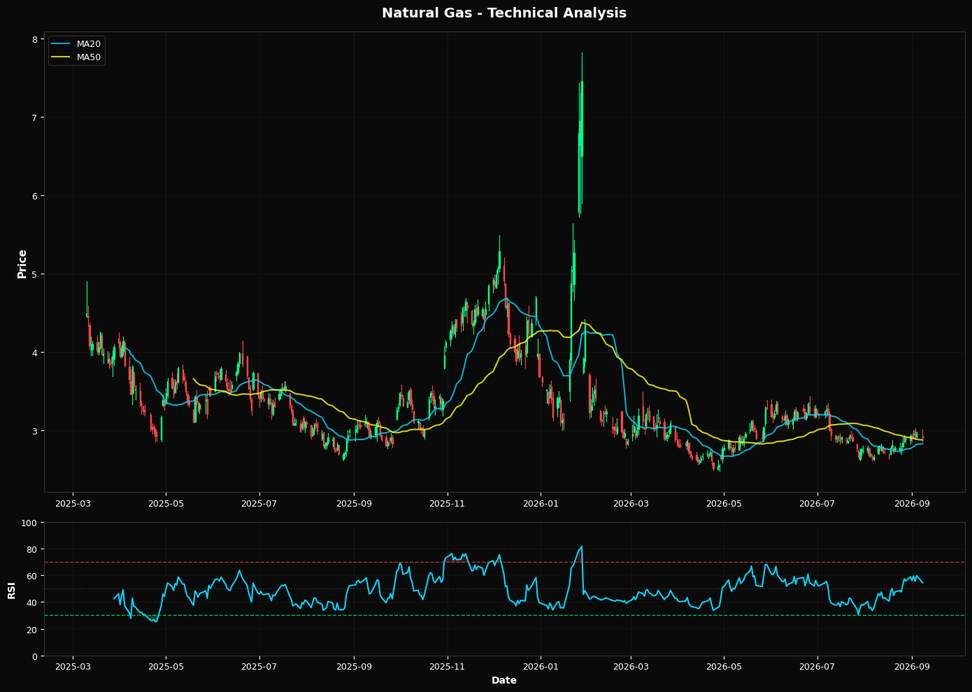
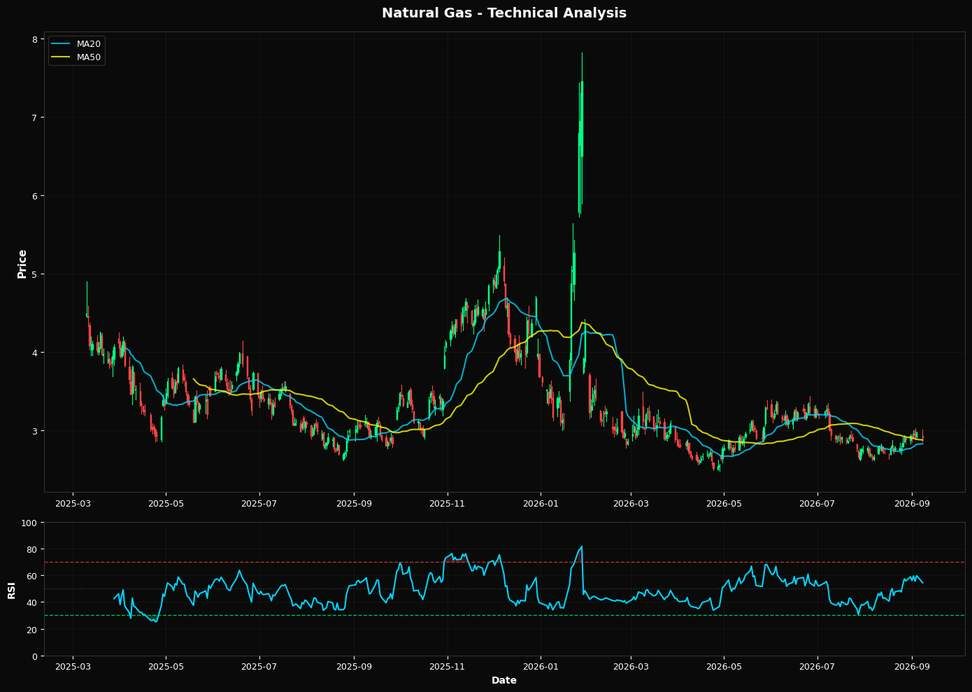
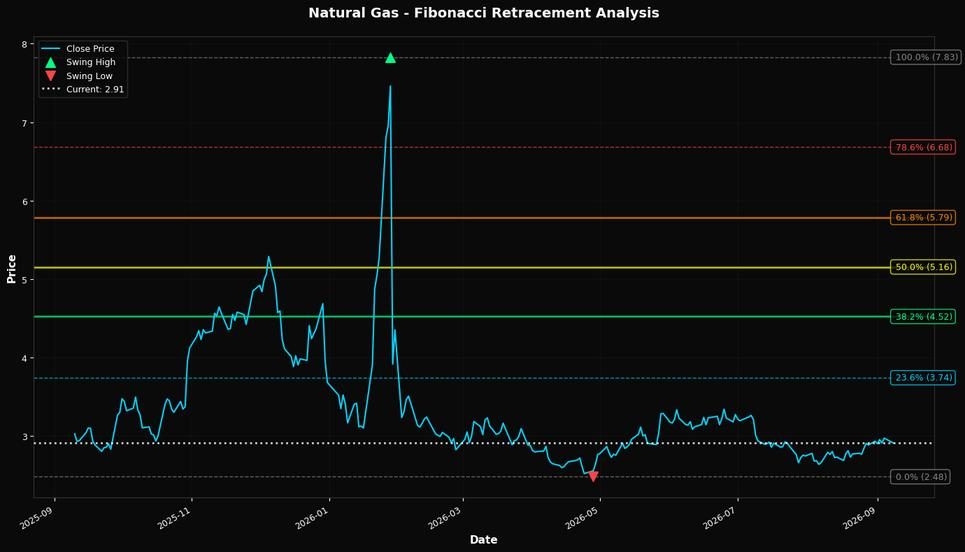
Natural gas prices are currently undervalued given the macroeconomic backdrop, with the U.S. dollar's strength being the most significant driver. At $2.91, natural gas is down 2.05% daily and 0.72% weekly, reflecting a market that may be overly focused on short-term technicals rather than the broader macro picture. The U.S. dollar's recent appreciation, driven by expectations of continued Federal Reserve hawkishness, is exerting downward pressure on dollar-denominated commodities like natural gas. However, this dynamic could reverse if inflation data suggests a cooling economy, potentially leading to a softer dollar and providing a tailwind for natural gas prices. From a technical perspective, natural gas is positioned interestingly between its moving averages. The current price of $2.91 is above the 20-day moving average of $2.83 and the 50-day moving average of $2.88, suggesting short-term bullish momentum. However, it remains below the 200-day moving average of $3.30, indicating that longer-term bearish trends are still in play. The RSI of 54.4 suggests neutral momentum, neither overbought nor oversold. The nearest Fibonacci resistance at $4.52 is a significant distance away, implying that any upward move could face substantial resistance before reaching this level. Given these factors, the technical setup leans slightly bullish in the short term, but with caution due to the overarching bearish long-term trend. A key risk that could alter the current landscape is a significant shift in U.S. natural gas inventory levels. Should upcoming inventory reports indicate a larger-than-expected drawdown, it could signal stronger demand or supply constraints, potentially catalyzing a price rally. Conversely, a build-up in inventories could exacerbate the current bearish sentiment. The market may be underpricing the potential for geopolitical disruptions, particularly in Europe, which could impact U.S. LNG exports and, by extension, domestic natural gas prices. Looking ahead, the next U.S. inflation report will be crucial. If inflation shows signs of easing, it could prompt a reassessment of the Fed's rate trajectory, weakening the dollar and providing support for natural gas prices. Conversely, persistently high inflation could reinforce the current bearish sentiment by strengthening the dollar further. This report will be pivotal in confirming or invalidating the current market bias, making it a critical event for traders and analysts alike.📈 Technical Indicators Summary
RSI (14)
54.4
50-Day MA
$2.88
200-Day MA
$3.30
Fib Level
38.2%
📊 Technical Analysis Chart (18-Month View)
📐 Fibonacci Retracement Analysis
🎯 Key Trading Levels
Key Fibonacci Levels:
- 38.2%: $4.52
- 50.0%: $5.16
- 61.8%: $5.79
Support: $2.48 (Swing Low), $2.88 (50-Day MA)
Resistance: $7.83 (Swing High)
Disclaimer
The content on MarketsFN.com is provided for educational and informational purposes only. It does not constitute financial advice, investment recommendations, or trading guidance. All investments involve risks, and past performance does not guarantee future results. You are solely responsible for your investment decisions and should conduct independent research and consult a qualified financial advisor before acting. MarketsFN.com and its authors are not liable for any losses or damages arising from your use of this information.