Nasdaq Jumps 1.2% as AI Trade Rebounds; Oil Slides on Demand Fears
MarketsFN Team
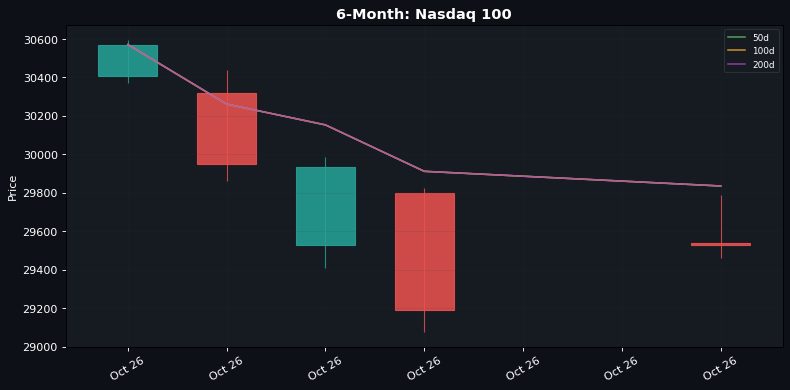
The Nasdaq 100 surged 1.17% to 29,529.34 on renewed AI sector enthusiasm, while WTI crude tumbled 2.99% to $98.38 amid global demand concerns. Mixed Chinese economic data and a stable dollar kept broader markets in check.
🇺🇸 US Session Overview
The S&P 500 edged up 0.41% to 7,690.73, supported by tech gains, while the Dow Jones dipped 0.07% to 51,966.03 as energy stocks weighed. Small caps showed resilience with the Russell 2000 adding 0.25%. Market sentiment improved as headlines about Anthropic's potential IPO and Apple's upcoming product event reignited the AI and tech trade. The outperformance of growth stocks came despite geopolitical tensions and a 3% drop in oil prices.
📅 Economic Calendar Highlights
China's Q3 GDP beat expectations at 4.5% YoY (vs. 4.4% forecast), though fixed asset investment remained weak at -7.2%. Canada's inflation cooled with core CPI at 2.2% YoY (vs. 2.4% prior), supporting rate pause bets. The unemployment rate in China improved slightly to 5.2%, suggesting modest economic stabilization.
💱 FX & Commodities
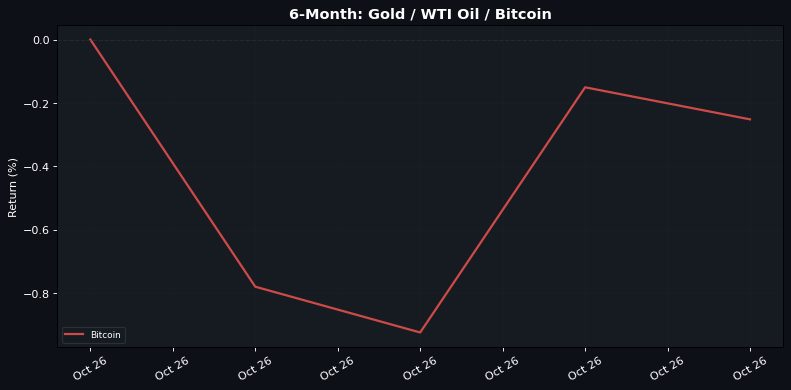
The dollar was mixed, with USD/JPY rising 0.25% to 158.54 while USD/CHF fell 0.13%. Commodity currencies rallied, with the AUD jumping 0.91% on China data. Gold slipped 0.52% to $4,159.50 as risk appetite improved, while silver gained 0.37%. Energy markets were hit hard, with WTI crude plunging nearly 3% on demand worries and natural gas dropping 2.31%.
Asian markets will digest today's China data amid lingering property sector concerns, while traders await Eurozone PMIs and US existing home sales tomorrow. The tech rally's sustainability will be tested as Treasury yields hover near multi-year highs.
🇺🇸 US Indices — Session Close
| Index | Price | Change | Change % |
|---|---|---|---|
| S&P 500 | 7,690.73 | ▲ +31.29 | ▲ +0.41% |
| Nasdaq 100 | 29,529.34 | ▲ +341.79 | ▲ +1.17% |
| Dow Jones | 51,966.03 | ▼ -36.38 | ▼ -0.07% |
| Russell 2000 | 2,728.30 | ▲ +6.93 | ▲ +0.25% |
💱 FX Majors
| Pair | Rate | Change % |
|---|---|---|
| EUR/USD | 1.1213 | ▲ +0.00% |
| GBP/USD | 1.3304 | ▲ +0.23% |
| USD/JPY | 158.54 | ▲ +0.25% |
| AUD/USD | 0.6982 | ▲ +0.91% |
| USD/CHF | 0.8267 | ▼ -0.13% |
🛢️ Commodities & Crypto
| Asset | Price (USD) | Change % |
|---|---|---|
| Gold (XAU/USD) | 4,159.50 | ▼ -0.52% |
| Silver (XAG/USD) | 57.21 | ▲ +0.37% |
| Crude Oil (WTI) | 98.38 | ▼ -2.99% |
| Brent Oil | 109.35 | ▼ -0.46% |
| Natural Gas | 3.04 | ▼ -2.31% |
| Bitcoin | 81,934.51 | ▼ -0.10% |
| Ethereum | 2,399.24 | ▼ -0.39% |
📅 Economic Calendar
All times in UTC — Actual highlighted where available
| Time | Currency | Event | Imp. | Actual | Forecast | Previous |
|---|---|---|---|---|---|---|
| 02:00 | CNY | GDP (YoY) (Q3) | 🔴🔴🔴 | 4.5% | 4.4% | 4.3% |
| 02:00 | CNY | Fixed Asset Investment (YoY) (Sep) | 🟡🟡 | -7.2% | -7.3% | -7.2% |
| 02:00 | CNY | GDP (QoQ) (Q3) | 🟡🟡 | 1.2% | 1.1% | 0.9% |
| 02:00 | CNY | Chinese GDP YTD (YoY) (Q3) | 🟡🟡 | 4.6% | 4.7% | |
| 02:00 | CNY | Industrial Production (YoY) (Sep) | 🟡🟡 | 5.5% | 5.4% | 5.2% |
| 02:00 | CNY | Chinese Industrial Production YTD (YoY) (Sep) | 🟡🟡 | 5.3% | 5.3% | |
| 02:00 | CNY | Chinese Unemployment Rate (Sep) | 🟡🟡 | 5.2% | 5.3% | 5.3% |
| 04:00 | MYR | CPI (YoY) (Sep) | 🟡🟡 | 1.8% | 1.9% | |
| 12:30 | CAD | Core CPI (MoM) (Sep) | 🟡🟡 | 0.0% | 0.1% | |
| 12:30 | CAD | Core CPI (YoY) (Sep) | 🟡🟡 | 2.2% | 2.4% | |
| 12:30 | CAD | CPI (MoM) (Sep) | 🟡🟡 | 0.1% | 0.2% | -0.1% |
| 01:30 | EUR | ECB's Lane Speaks | 🟡🟡 | — | ||
| 02:00 | CNY | NBS Press Conference | 🟡🟡 | — | ||
| 06:00 | EUR | ECB's Elderson Speaks | 🟡🟡 | — | ||
| 15:30 | CAD | BoC Business Outlook Survey | 🟡🟡 | — |
Report published: October 19, 2026 — 22:20 CET
Disclaimer
The content on MarketsFN.com is provided for educational and informational purposes only. It does not constitute financial advice, investment recommendations, or trading guidance. All investments involve risks, and past performance does not guarantee future results. You are solely responsible for your investment decisions and should consult a qualified financial adviser before acting. MarketsFN.com and its authors are not liable for any losses arising from your use of this information.