Nasdaq 100 52-Week Highs & Lows Radar: NVIDIA (NVDA), Comcast (CMCSA) and more
MarketsFN Team

Nasdaq 100 52-Week Highs & Lows Radar: NVIDIA (NVDA), Comcast (CMCSA) and more
Screening all 101 Nasdaq 100 constituents for stocks nearest to their 52-week high and their 52-week low. Data as of October 06, 2026. % Realized = 52-week total return.
Legend: RSI > 70 = overbought · RSI < 30 = oversold · Green % Realized = positive 52W return · Red = negative.
📈 Nearest to 52-Week High
Sectors represented: Technology (5)
| Ticker | Company | Sector | Price Last | % Realized | 52-Week High Date | RSI | % above MA200 | Trend |
|---|---|---|---|---|---|---|---|---|
| NVDA | NVIDIA Corp | Technology | $242.07 | +30.47% | 2026-10-06 | 69.2 | +20.2% | Above MA20, MA50, MA200 |
| AMD | Advanced Micro Devices Inc | Technology | $644.60 | +216.43% | 2026-10-06 | 71.4 | +70.0% | Above MA20, MA50, MA200 |
| PANW | Palo Alto Networks Inc | Technology | $424.45 | +99.66% | 2026-10-06 | 68.6 | +68.0% | Above MA20, MA50, MA200 |
| CRWD | Crowdstrike Holdings Inc | Technology | $281.30 | +126.88% | 2026-10-06 | 72.8 | +81.4% | Above MA20, MA50, MA200 |
| FTNT | Fortinet Inc | Technology | $188.45 | +118.16% | 2026-10-06 | 70.3 | +57.5% | Above MA20, MA50, MA200 |
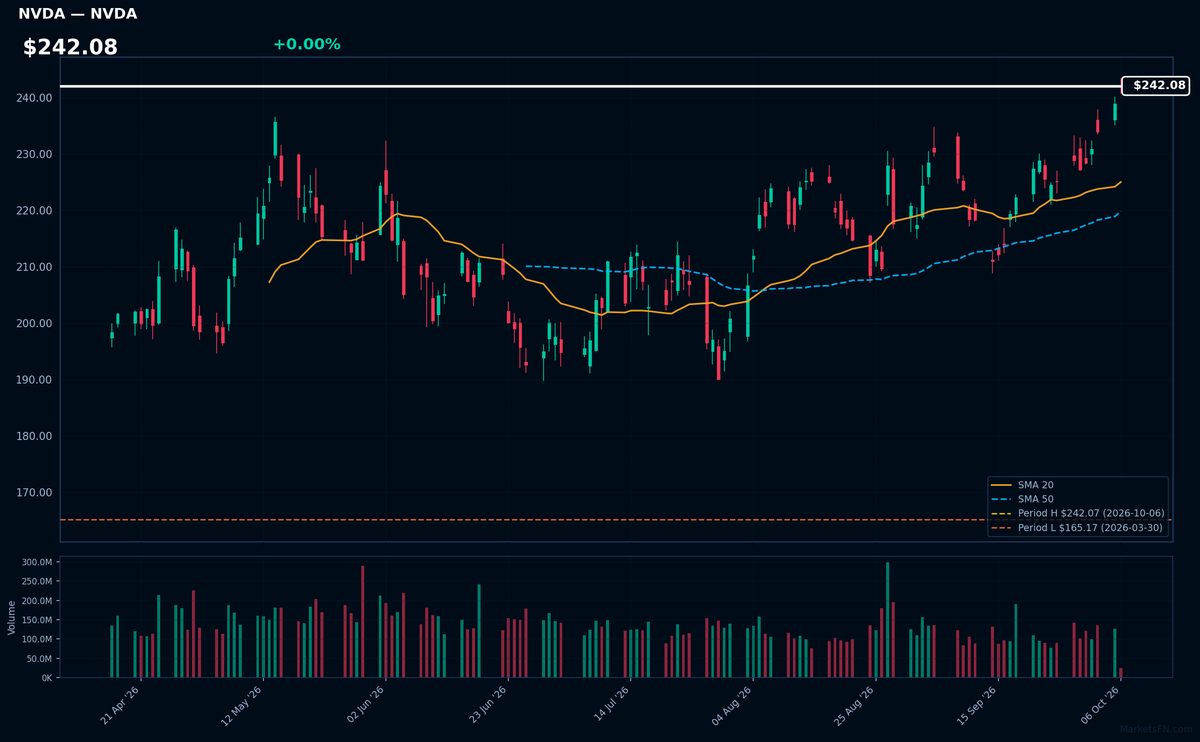
NVDA | NVIDIA Corp | Technology | Price Last: $242.07 | % Realized: +30.47% | RSI: 69.2 | % above MA200: +20.2% | Trend: Above MA20, MA50, MA200
NVIDIA designs GPUs for gaming, AI, and data centers, dominating accelerated computing. Investors care because its chips power generative AI, autonomous vehicles, and high-performance computing - markets with explosive growth potential.
Technically bullish: $242.08 price shows sustained uptrend (MA20>MA50>MA200), RSI at 69.2 suggests strong momentum but nears overbought. Stock sits at 52-week high (+30.5% YTD), signaling breakout potential.
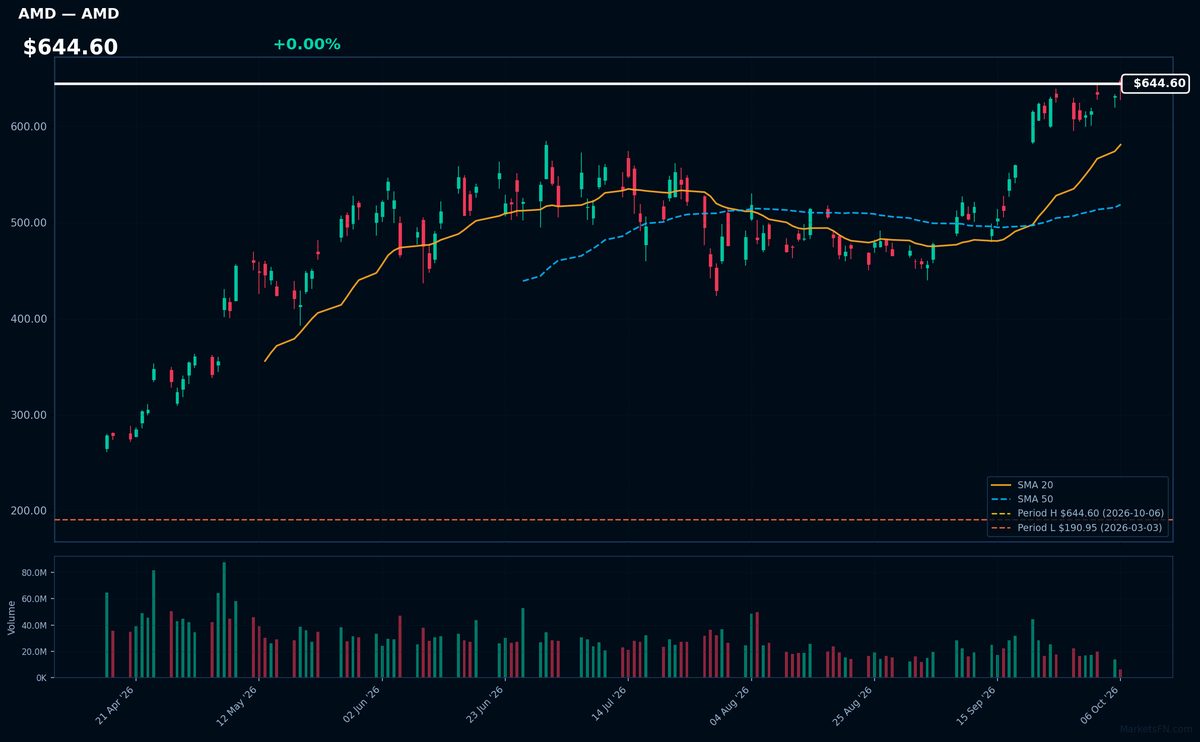
AMD | Advanced Micro Devices Inc | Technology | Price Last: $644.60 | % Realized: +216.43% | RSI: 71.4 | % above MA200: +70.0% | Trend: Above MA20, MA50, MA200
AMD designs high-performance computing processors and graphics chips critical for AI workloads, data centers, and gaming. Investors care because it's gaining market share from Intel in CPUs while competing with Nvidia in GPUs, directly benefiting from AI infrastructure spending.
Technically extreme with RSI(14) at 71.4 and bullish MA alignment (price > MA20 > MA50 > MA200). The 216.4% 52-week return and 0.0% distance from 52-week high suggest overheated momentum, not fundamental safety. Watch for RSI reversal.
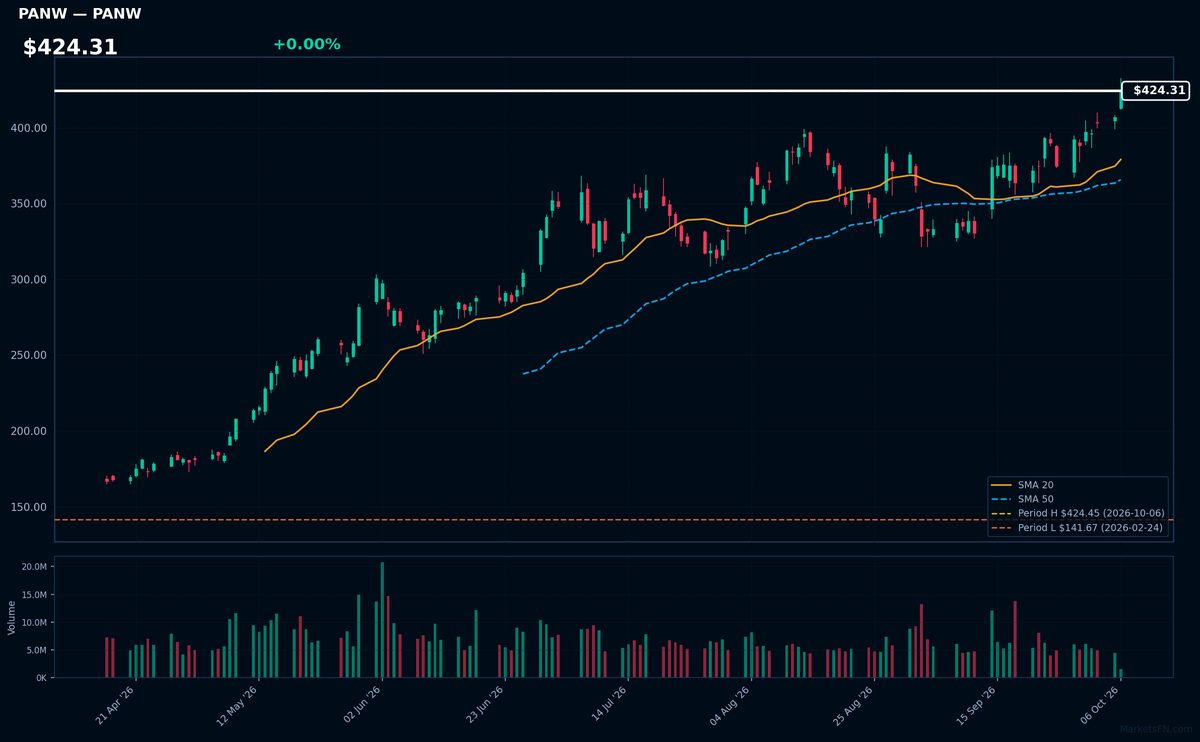
PANW | Palo Alto Networks Inc | Technology | Price Last: $424.45 | % Realized: +99.66% | RSI: 68.6 | % above MA200: +68.0% | Trend: Above MA20, MA50, MA200
Palo Alto Networks provides cybersecurity platforms for enterprises, specializing in cloud security and threat intelligence. Investors should care as digital transformation and rising cyber threats drive sustained demand for its next-gen firewall and AI-powered security solutions.
PANW shows bullish momentum (RSI 68.6, price > MA20 > MA50 > MA200) at 52-week highs (+99.7% YoY), but RSI nears overbought territory. Extreme proximity to all-time highs suggests potential breakout or consolidation.
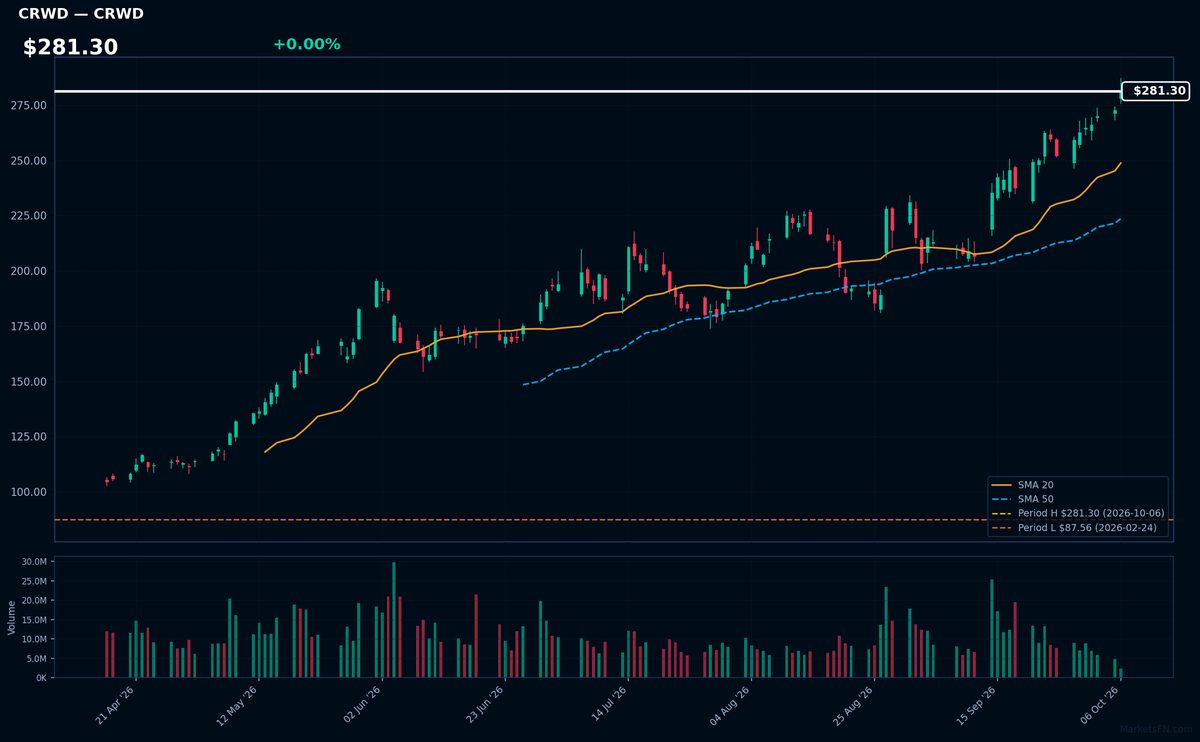
CRWD | Crowdstrike Holdings Inc | Technology | Price Last: $281.30 | % Realized: +126.88% | RSI: 72.8 | % above MA200: +81.4% | Trend: Above MA20, MA50, MA200
Crowdstrike provides cloud-native endpoint security software using AI to detect and prevent cyberattacks in real time. Investors care because enterprises globally are prioritizing next-gen cybersecurity solutions as threats escalate, driving Crowdstrike's recurring revenue growth.
Technically bullish with RSI(14) at 72.8 (overbought) and price > MA20 > MA50 > MA200 in sustained uptrend. Extreme proximity to 52-week high (+126.9% YoY) suggests strong momentum but elevated risk.
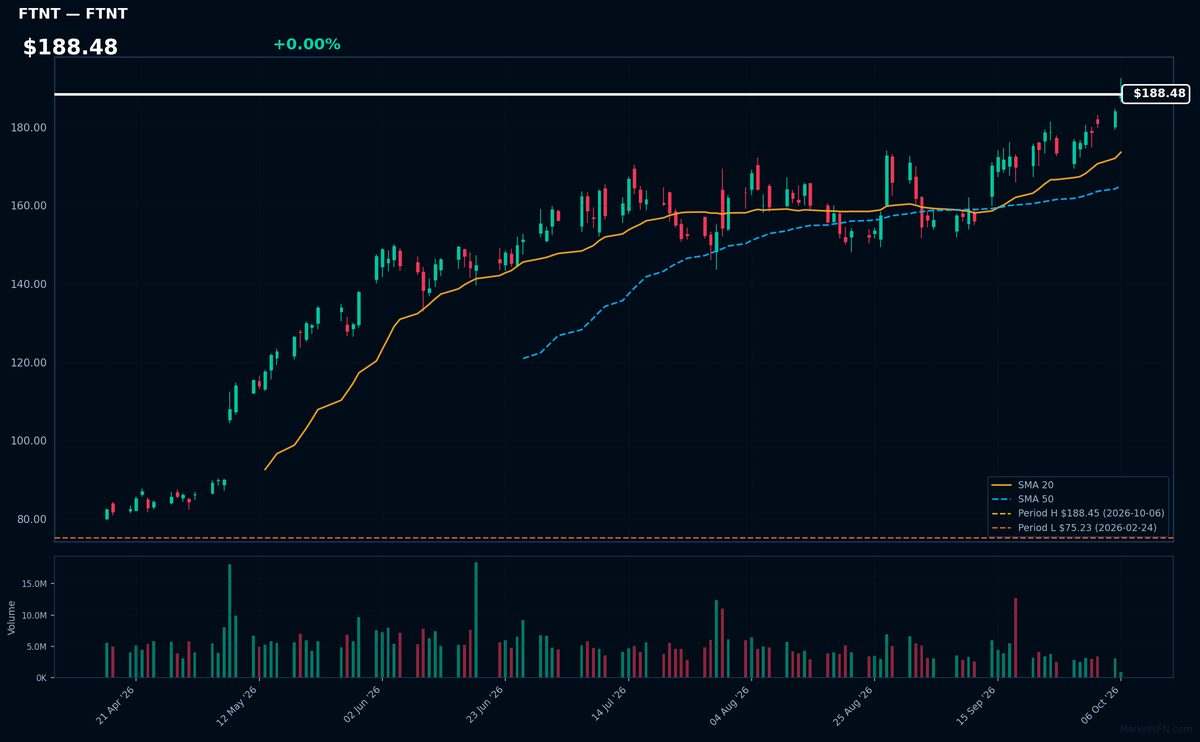
FTNT | Fortinet Inc | Technology | Price Last: $188.45 | % Realized: +118.16% | RSI: 70.3 | % above MA200: +57.5% | Trend: Above MA20, MA50, MA200
Fortinet provides cybersecurity solutions, specializing in firewalls and threat protection for enterprises. Investors care because digital transformation and remote work are accelerating demand for network security, making FTNT a key player in a high-growth sector.
FTNT shows strong bullish momentum with price at $188.48 (0.0% below 52-week high), RSI(14) at 70.3 (near overbought), and sustained uptrend (price > MA20 > MA50 > MA200). The 118.2% 52-week return suggests continued strength but warrants caution at these levels.
📉 Nearest to 52-Week Low
Sectors represented: Communication Services (2), Consumer Cyclical (1), Industrials (1), Consumer Defensive (1)
| Ticker | Company | Sector | Price Last | % Realized | 52-Week Low Date | RSI | % above MA200 | Trend |
|---|---|---|---|---|---|---|---|---|
| CMCSA | Comcast Corp | Communication Services | $21.55 | -26.06% | 2026-10-06 | 26.9 | -19.1% | Below MA20, MA50, MA200 |
| LULU | Lululemon Athletica inc | Consumer Cyclical | $92.82 | -46.69% | 2026-10-06 | 32.1 | -35.5% | Below MA20, MA50, MA200 |
| CPRT | Copart, Inc | Industrials | $27.19 | -38.82% | 2026-09-29 | 33.2 | -18.5% | Below MA20, MA50, MA200 |
| PEP | PepsiCo Inc | Consumer Defensive | $126.20 | -9.66% | 2026-10-01 | 28.1 | -14.2% | Below MA20, MA50, MA200 |
| NFLX | Netflix Inc | Communication Services | $67.57 | -41.92% | 2026-10-02 | 33.1 | -19.4% | Below MA20, MA50, MA200 |
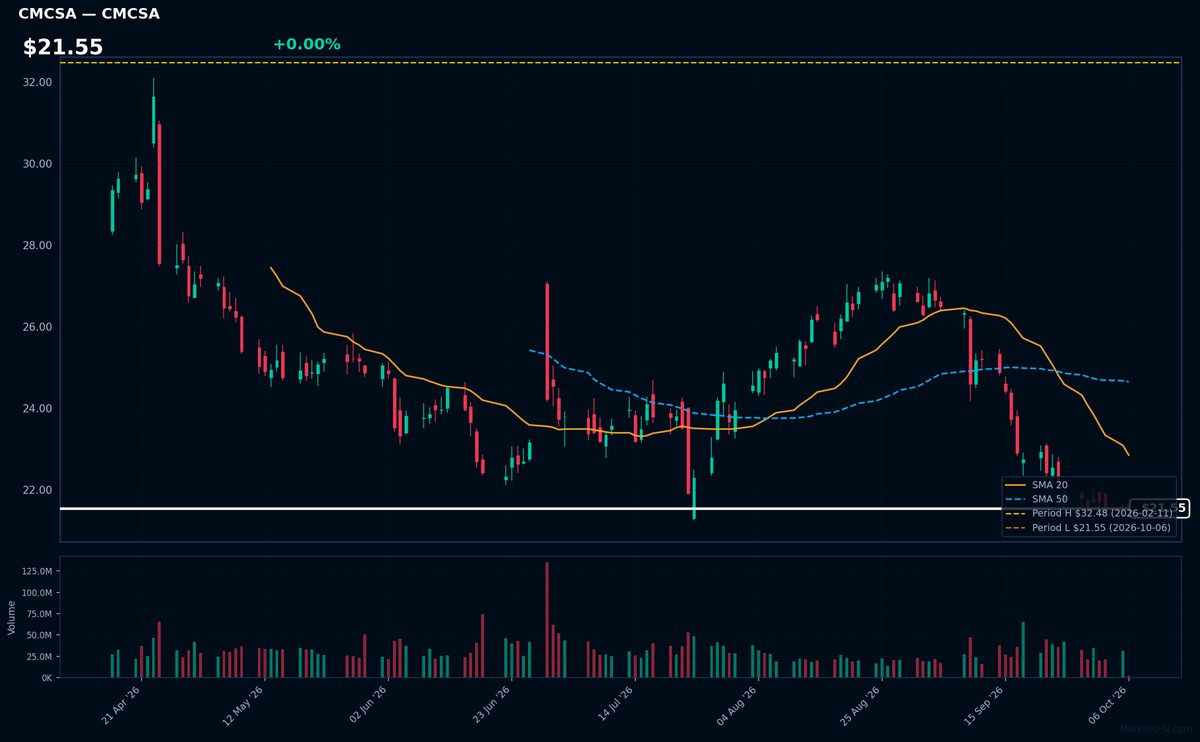
CMCSA | Comcast Corp | Communication Services | Price Last: $21.55 | % Realized: -26.06% | RSI: 26.9 | % above MA200: -19.1% | Trend: Below MA20, MA50, MA200
Comcast Corp operates as a media and technology conglomerate, providing cable/internet services through Xfinity, owning NBCUniversal, and streaming via Peacock. Investors watch its broadband dominance and content assets amid cord-cutting pressures.
CMCSA shows extreme technical weakness: RSI(14) at 26.9 (oversold), with bearish MA alignment (price < MA20 < MA50 < MA200) and -26.1% YTD return. Testing 52-week lows signals severe downside momentum.
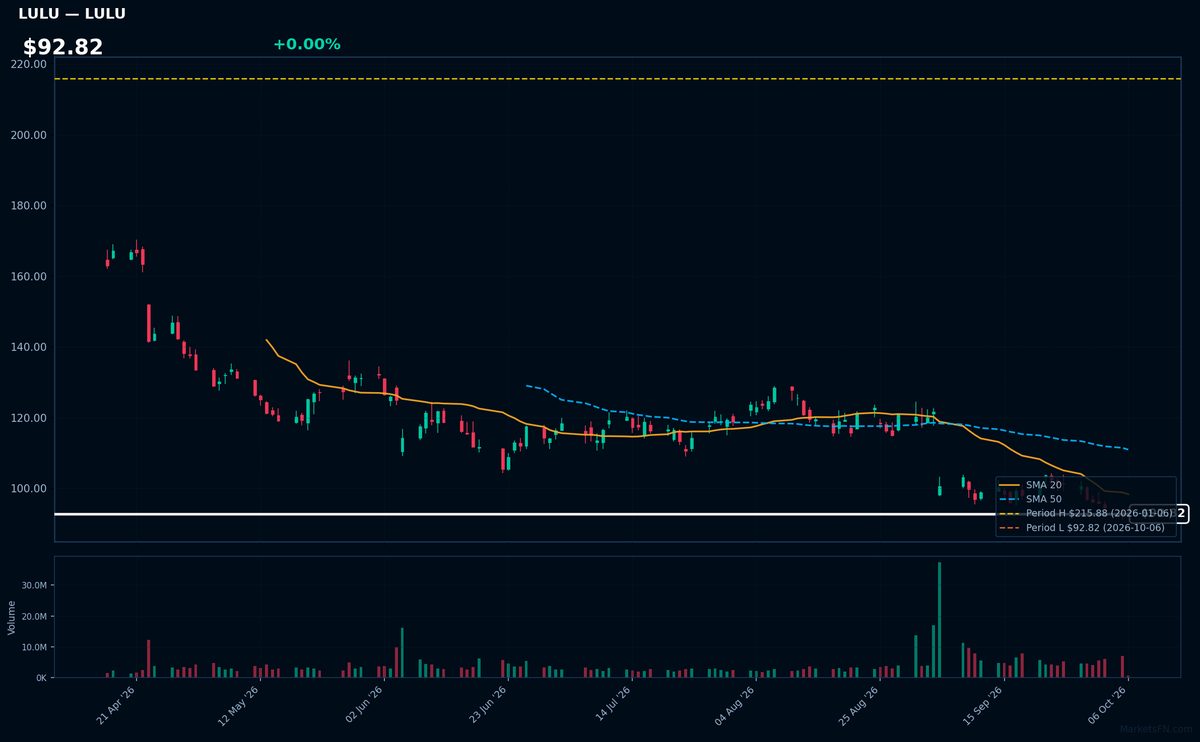
LULU | Lululemon Athletica inc | Consumer Cyclical | Price Last: $92.82 | % Realized: -46.69% | RSI: 32.1 | % above MA200: -35.5% | Trend: Below MA20, MA50, MA200
Lululemon Athletica designs and sells premium athletic apparel and accessories, with a cult following in yoga and lifestyle wear. Investors care due to its strong brand loyalty, premium pricing power, and expansion into menswear and international markets.
LULU shows extreme technical weakness: RSI(14) at 32.1 (nearing oversold), with a sustained downtrend (price < MA20 < MA50 < MA200). Trading just 0.0% above 52-week lows after a -46.7% plunge, this tests critical support — a clear warning sign.
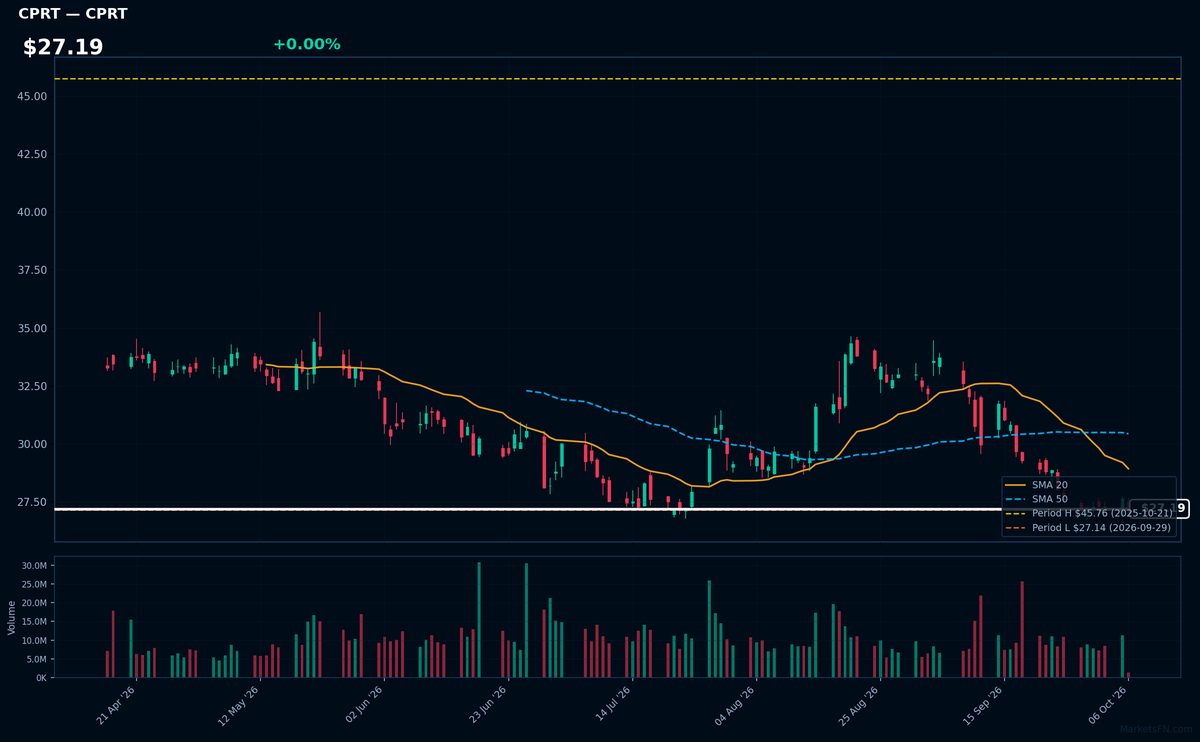
CPRT | Copart, Inc | Industrials | Price Last: $27.19 | % Realized: -38.82% | RSI: 33.2 | % above MA200: -18.5% | Trend: Below MA20, MA50, MA200
Copart operates an online vehicle auction platform, specializing in salvage and insurance cars. Investors watch it as a cyclical play on used vehicle supply and insurance claims volume, with recurring revenue from its auction fee model.
Technically dire: RSI 33.2 shows oversold conditions, but bearish MA alignment (price < MA20 < MA50 < MA200) confirms sustained downtrend. Stock tests 52-week low support after -38.8% plunge.
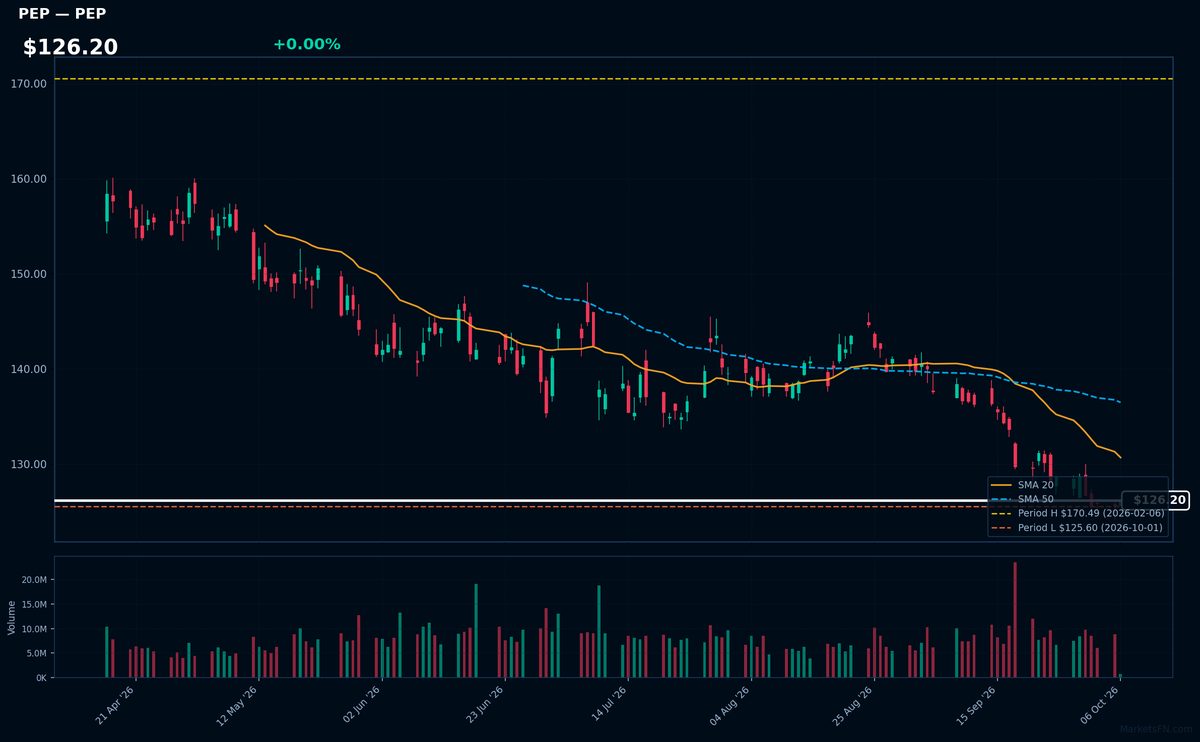
PEP | PepsiCo Inc | Consumer Defensive | Price Last: $126.20 | % Realized: -9.66% | RSI: 28.1 | % above MA200: -14.2% | Trend: Below MA20, MA50, MA200
PepsiCo operates a global food and beverage portfolio including Pepsi, Frito-Lay, Gatorade, and Quaker Oats. Investors care for its stable cash flows from snack dominance (60% of revenue) and pricing power in inflationary environments, though recent volume declines raise questions.
Technically distressed: RSI(14) at 28.1 (oversold) with bearish MA alignment (price < MA20 < MA50 < MA200). Testing 52-week low support (-9.7% YoY) — warning sign unless fundamentals reverse.
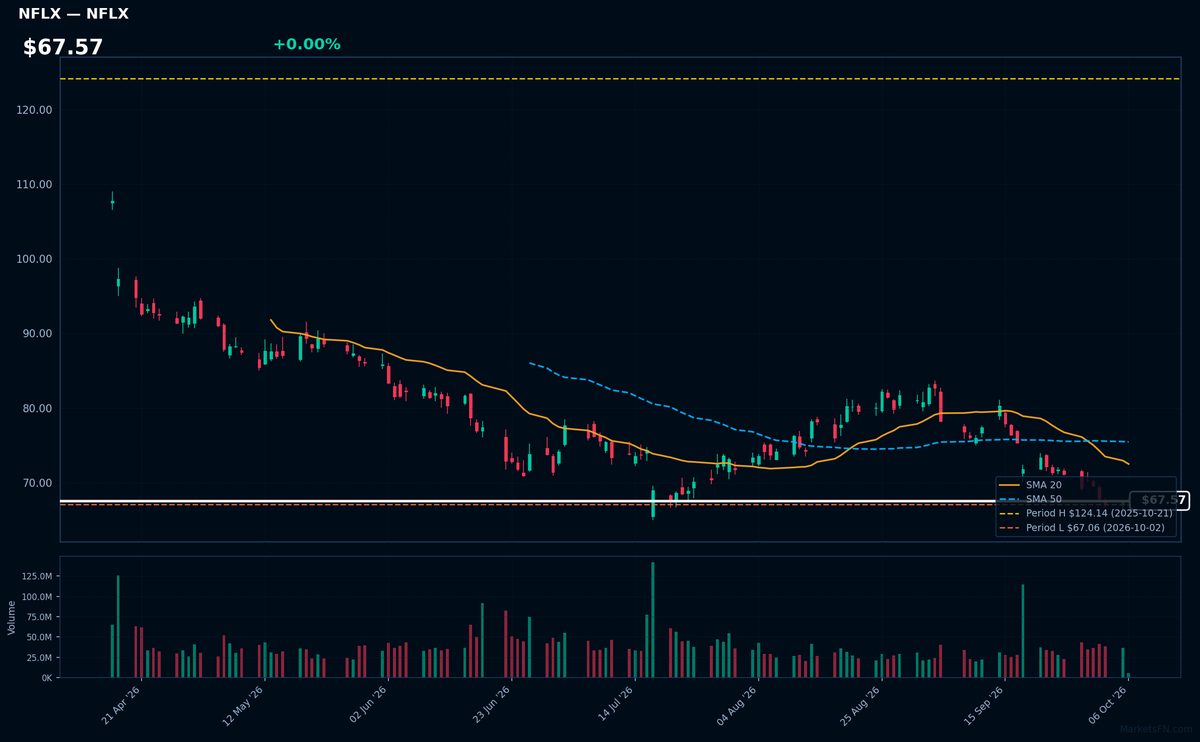
NFLX | Netflix Inc | Communication Services | Price Last: $67.57 | % Realized: -41.92% | RSI: 33.1 | % above MA200: -19.4% | Trend: Below MA20, MA50, MA200
Netflix Inc dominates global streaming with 220M+ subscribers, pioneering original content and international expansion. Investors watch its pricing power amid competition and ability to monetize password sharing, as profitability now outweighs subscriber growth.
Netflix shows severe technical weakness: RSI(14) at 33.1 signals near-oversold conditions, while the bearish MA alignment (price < MA20 < MA50 < MA200) confirms a sustained downtrend. Trading just 0.8% above 52-week lows after a -41.9% annual drop, this tests critical support.
Market Commentary
The concentration of tech stocks like NVDA, AMD, PANW, CRWD, and FTNT at 52-week highs signals persistent investor confidence in AI, cybersecurity, and semiconductor demand. Conversely, stocks like CMCSA, LULU, and NFLX near 52-week lows reflect sector-specific pressures—streaming competition, consumer discretionary weakness, and cable cord-cutting—rather than broad market distress. This divergence underscores the Nasdaq 100's tech-heavy skew, where megacap tech strength masks underperformance elsewhere.
AI infrastructure spending and resilient enterprise security budgets (evidenced by PANW, CRWD, FTNT) continue driving outperformance, while higher rates weigh on discretionary spending (LULU) and legacy media (CMCSA). PEP’s defensive status limits its downside, but NFLX’s proximity to lows suggests streaming saturation concerns. Macro themes—Fed policy, chip export controls, and corporate IT budgets—remain pivotal for these extremes.
For highs, watch NVDA/AMD for AI demand confirmation or semiconductor inventory warnings. Breakdown risks for lows include NFLX missing subscriber guidance or CMCSA’s broadband losses accelerating. Upside catalysts for laggards could be rate cuts (benefiting LULU) or NFLX’s ad-tier traction. Strictly monitor the 52-week boundaries cited—any decisive breach may signal trend continuation.
Methodology: All 101 Nasdaq 100 constituents screened. 52-week high = highest daily close over the past 252 trading days (approx. 1 year). 52-week low = lowest daily close over the same period. Distance = (current price / extreme − 1) × 100. Technical indicators computed on up to 1 year of daily OHLCV data.
Disclaimer: For informational purposes only. Not investment advice. Past performance is not indicative of future results.