Nasdaq 100 52-Week Highs & Lows Radar: Fortinet (FTNT), PepsiCo (PEP) and more
MarketsFN Team

Nasdaq 100 52-Week Highs & Lows Radar: Fortinet (FTNT), PepsiCo (PEP) and more
Screening all 101 Nasdaq 100 constituents for stocks nearest to their 52-week high and their 52-week low. Data as of September 16, 2026. % Realized = 52-week total return.
Legend: RSI > 70 = overbought · RSI < 30 = oversold · Green % Realized = positive 52W return · Red = negative.
📈 Nearest to 52-Week High
Sectors represented: Technology (4), Healthcare (1)
| Ticker | Company | Sector | Price Last | % Realized | 52-Week High Date | RSI | % above MA200 | Trend |
|---|---|---|---|---|---|---|---|---|
| FTNT | Fortinet Inc | Technology | $173.19 | +117.08% | 2026-09-16 | 62.0 | +53.3% | Above MA20, MA50, MA200 |
| CRWD | Crowdstrike Holdings Inc | Technology | $241.54 | +117.13% | 2026-09-15 | 64.0 | +65.6% | Above MA20, MA50, MA200 |
| AAPL | Apple Inc | Technology | $333.59 | +40.08% | 2026-07-28 | 62.9 | +16.7% | Above MA20, MA50, MA200 |
| TEAM | Atlassian Corporation | Technology | $189.02 | +9.87% | 2026-09-03 | 64.2 | +71.0% | Above MA20, MA50, MA200 |
| BIIB | Biogen Inc | Healthcare | $216.19 | +50.47% | 2026-09-03 | 51.9 | +12.3% | Above MA50, MA200 · Below MA20 |
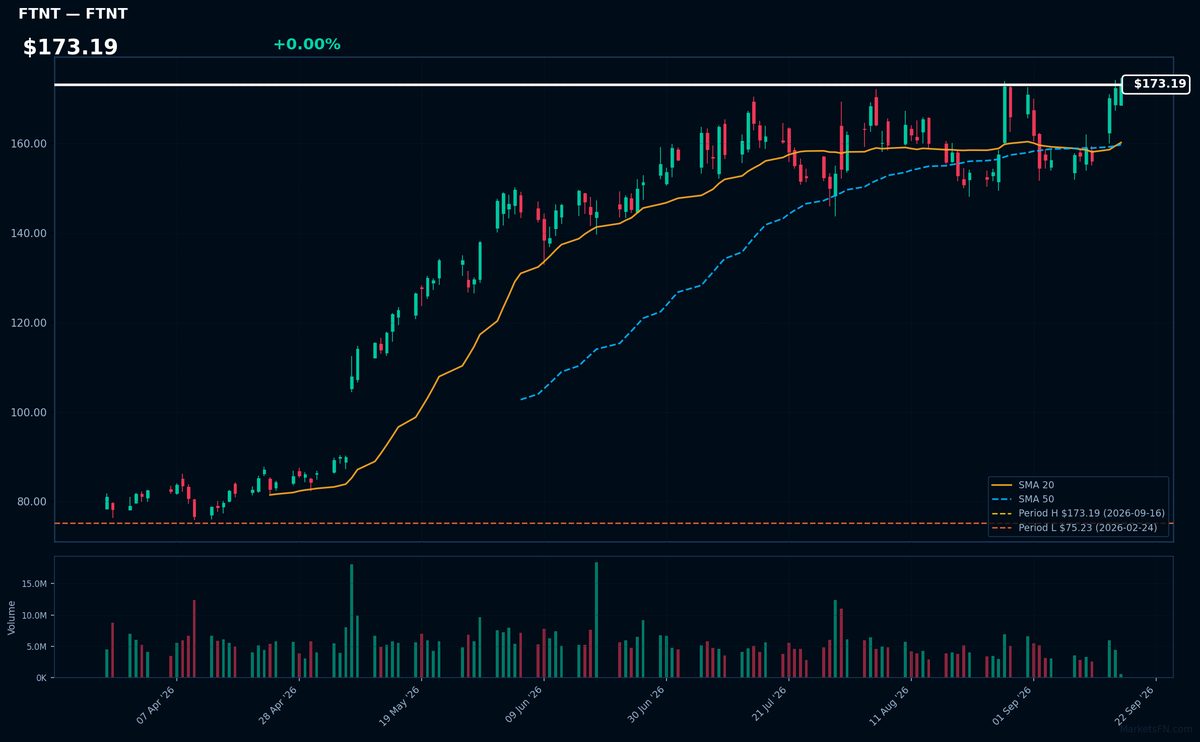
FTNT | Fortinet Inc | Technology | Price Last: $173.19 | % Realized: +117.08% | RSI: 62.0 | % above MA200: +53.3% | Trend: Above MA20, MA50, MA200
Fortinet Inc is a cybersecurity company that provides security solutions such as firewalls and intrusion detection/prevention systems. Investors should care because its products protect networks from cyber threats, a growing concern for businesses and organizations.
Fortinet Inc is in a sustained uptrend with price > MA20 > MA50 > MA200, RSI(14) at 62.0, and is 0.0% below its 52-Week high, indicating strong momentum with no immediate signs of overbought conditions.
Related headlines
- Fortinet Expands U.S. Presence with New Company-Owned Innovation Hub in New York City
- 2 Top Cybersecurity Stocks to Buy Amid AI Safety Fears: FTNT, QLYS
- Cybersecurity Stocks Jump As Anthropic CEOs AI Slowdown Call Sharpens Focus On Cyber Risks CRWD, PANW, FTNT Buck Market Selloff
- CRWD Stock Leads Wedbushs Cybersecurity Bets: Check Point, Fortinet, Varonis, Telos Downgraded
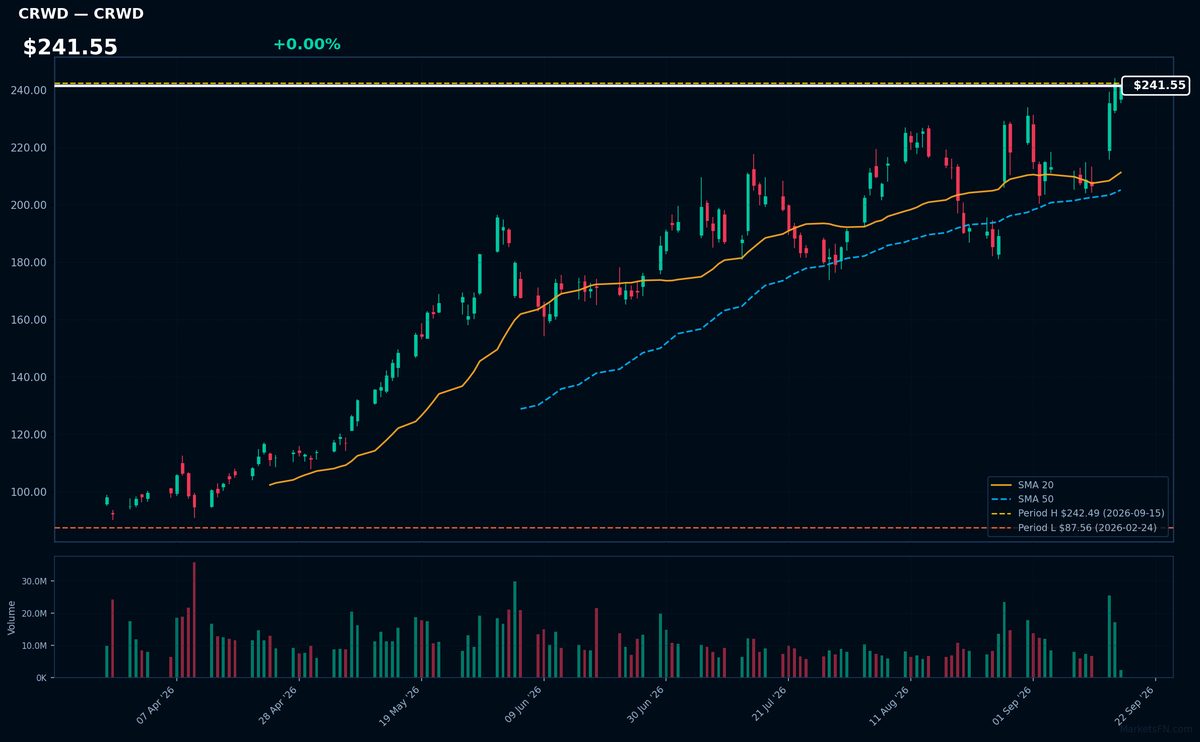
CRWD | Crowdstrike Holdings Inc | Technology | Price Last: $241.54 | % Realized: +117.13% | RSI: 64.0 | % above MA200: +65.6% | Trend: Above MA20, MA50, MA200
Crowdstrike Holdings Inc is a cybersecurity company providing cloud-delivered endpoint and cloud workload protection. Investors should care due to its innovative approach and growing demand for cybersecurity solutions.
Crowdstrike's technicals indicate sustained uptrend with price > MA20 > MA50 > MA200, RSI(14) at 64.0, and is 0.4% below its 52-Week high, suggesting momentum near a potential breakout.
Related headlines
- CrowdStrike Named the Only Customers Choice in the 2026 Gartner Peer Insights Voice of the Customer for Identity Threat Detection and Response (ITDR)
- Why Did DELL, CRWD, CVX Stocks Jump To 52-Week Highs Today?
- CRWD, PANW Stocks Extend AI-Fueled Rally As Cybersecurity Bets Outpace Software
- CrowdStrike CEO Warns AI Cyber Threat Is Already Here
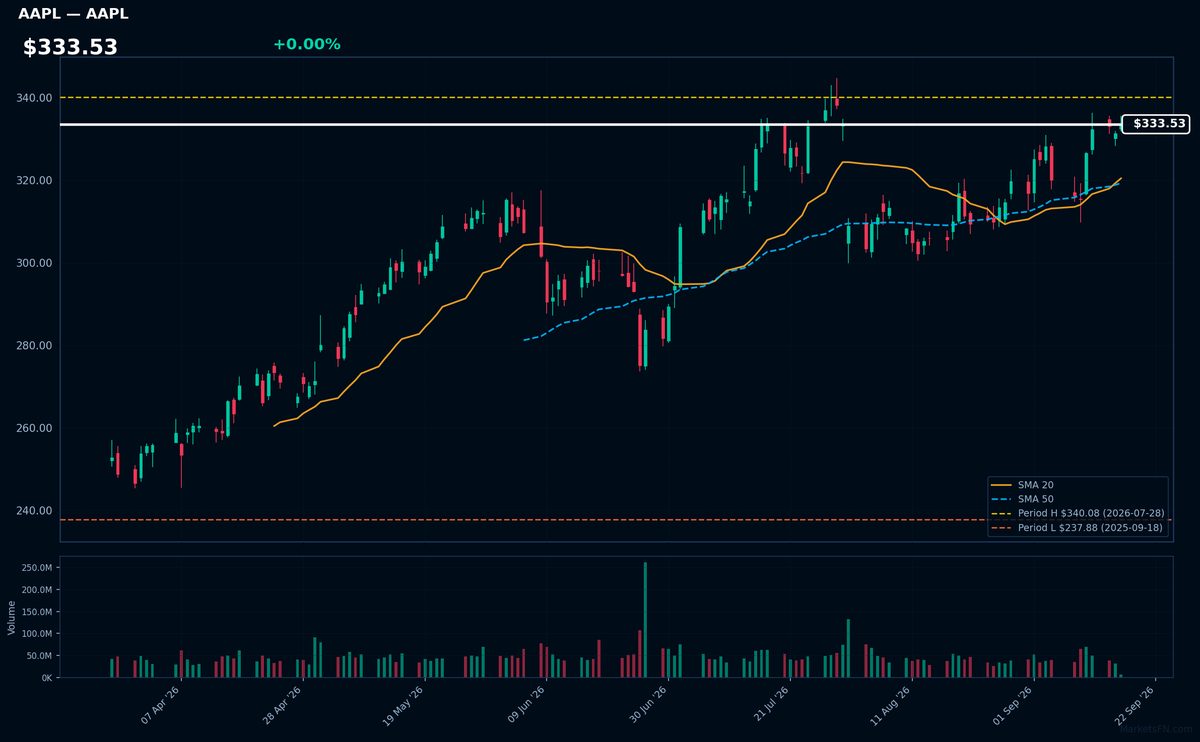
AAPL | Apple Inc | Technology | Price Last: $333.59 | % Realized: +40.08% | RSI: 62.9 | % above MA200: +16.7% | Trend: Above MA20, MA50, MA200
Apple Inc designs, manufactures, and markets consumer electronics, software, and services. Investors care about its innovative product ecosystem, including iPhones, Macs, and wearables, driving revenue growth and profitability.
AAPL is in a sustained uptrend with price > MA20 > MA50 > MA200, RSI(14) at 62.9, and is 1.9% below its 52-Week high, indicating strong momentum with potential for breakout.
Related headlines
- Apple building M8 AI servers, talks with Nvidia, reports The Information
- Citi Survey Points to Shorter Smartphone Replacement Cycles and Potential Apple Market Share Gains
- Apple reportedly accepts Samsung's 1Q27 memory hike, raising the 2027 smartphone cost floor
- Apple, Intel links sharpen focus on Lens Technology's next glass growth markets
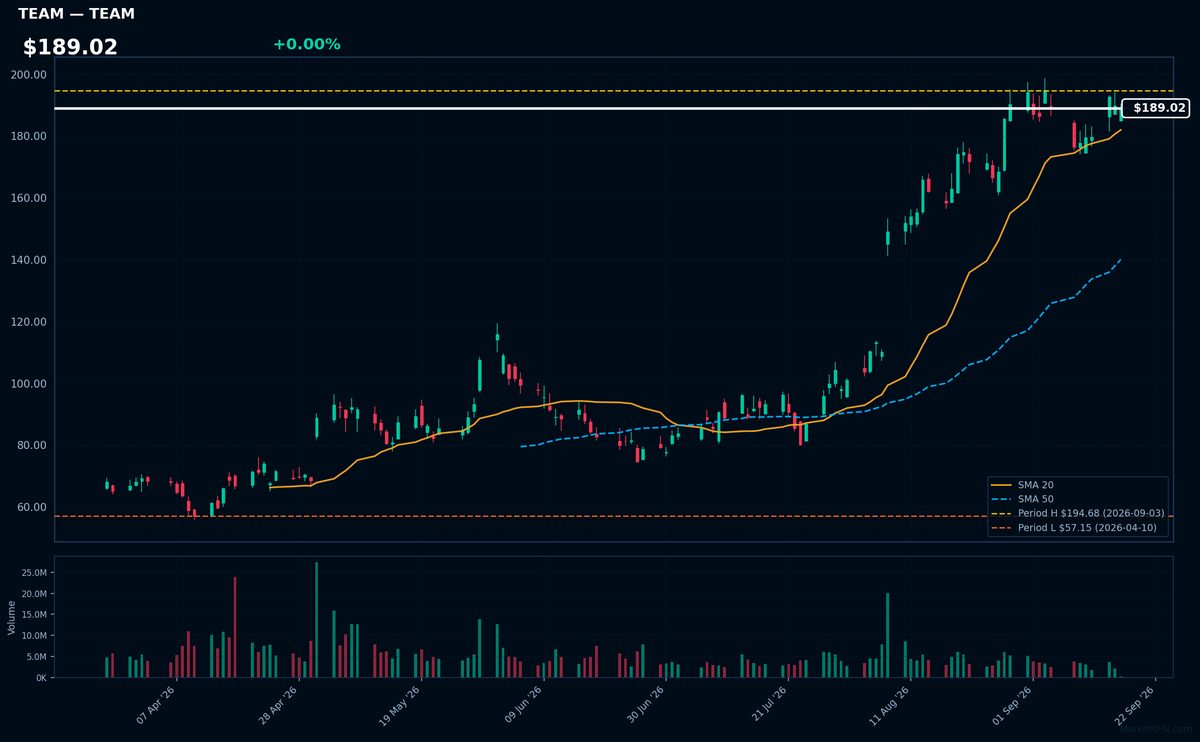
TEAM | Atlassian Corporation | Technology | Price Last: $189.02 | % Realized: +9.87% | RSI: 64.2 | % above MA200: +71.0% | Trend: Above MA20, MA50, MA200
Atlassian Corporation is a software company that provides collaboration and productivity tools like Jira and Trello. Investors should care because its products are widely adopted by enterprises, driving growth and profitability.
Atlassian's technicals indicate sustained uptrend with price > MA20 > MA50 > MA200, RSI(14) at 64.2, and 2.9% below 52-Week high, suggesting momentum near a potential breakout level.
Related headlines
- Atlassian Shares Rise 3% as Software Stocks Outperform Chipmakers
- Atlassian Launches System to Coordinate and Accelerate Agentic Engineering
- Why Did SNOW, DELL, TEAM Stocks Surge To 52-Week Highs Today?
- TEAM Stock Heads For Best Month Ever As Software Stocks Swing From SaaSpocalypse To Full Revival In One Month
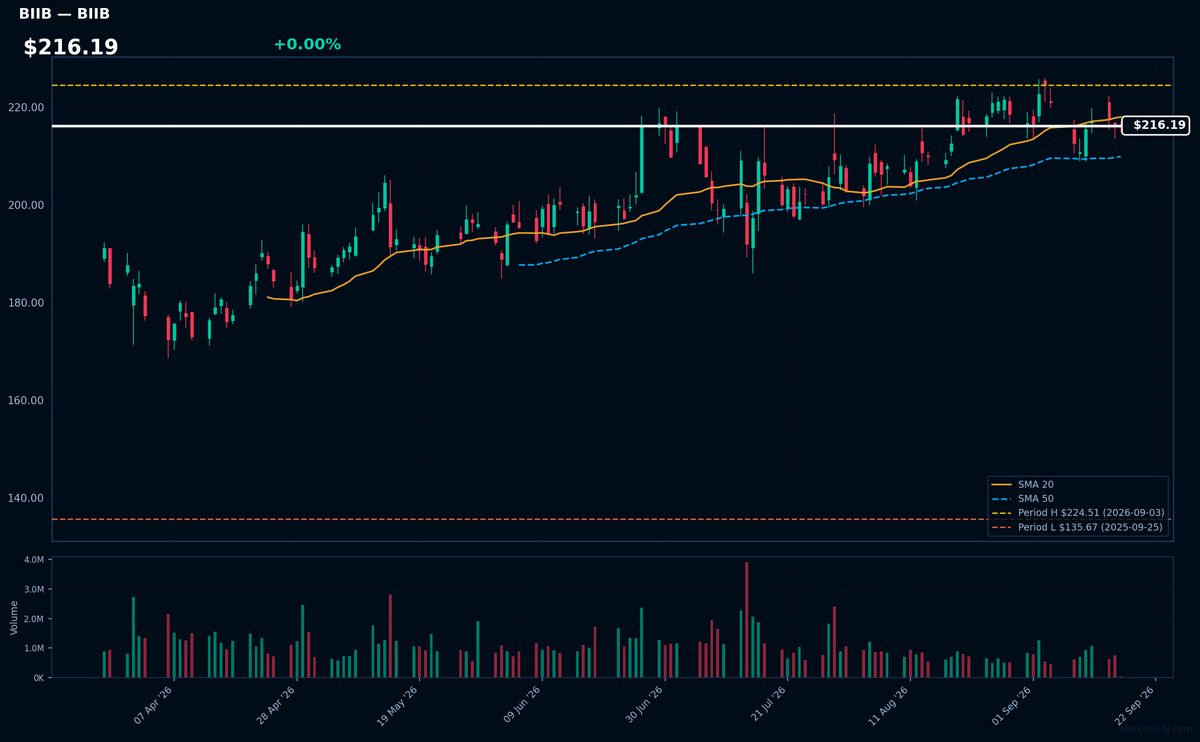
BIIB | Biogen Inc | Healthcare | Price Last: $216.19 | % Realized: +50.47% | RSI: 51.9 | % above MA200: +12.3% | Trend: Above MA50, MA200 · Below MA20
Biogen Inc is a biotechnology company that develops treatments for neurological and neurodegenerative diseases, such as multiple sclerosis and Alzheimer's. Investors should care due to its potential for growth driven by innovative therapies in high-demand areas.
Biogen Inc's technicals show mixed signals: RSI(14) at 51.9 indicates neutral momentum, with price above MA50/MA200 but below MA20. The stock is 3.7% below its 52-Week high, suggesting a potential breakout.
Related headlines
- Stoke Therapeutics and Biogen Present Long-Term Clinical Data that Support the Disease-Modifying Potential of Zorevunersen, an Investigational Medicine for the Treatment of Dravet Syndrome, at the 16th European Epilepsy Congress (EEC)
- Stoke Therapeutics and Biogen to present four-year zorevunersen data at epilepsy congress
- Stoke Therapeutics and Biogen Announce Presentations of Clinical Data from Studies of Zorevunersen, an Investigational Medicine for the Treatment of Dravet Syndrome, at the 16th European Epilepsy Congress (EEC)
- Wolfe Research upgrades Biogen, AbbVie on pipeline strength and valuation
📉 Nearest to 52-Week Low
Sectors represented: Utilities (2), Consumer Defensive (1), Technology (1), Consumer Cyclical (1)
| Ticker | Company | Sector | Price Last | % Realized | 52-Week Low Date | RSI | % above MA200 | Trend |
|---|---|---|---|---|---|---|---|---|
| PEP | PepsiCo Inc | Consumer Defensive | $134.88 | -3.67% | 2026-09-16 | 35.7 | -9.1% | Below MA20, MA50, MA200 |
| EXC | Exelon Corp | Utilities | $42.28 | -1.04% | 2026-09-15 | 30.8 | -7.8% | Below MA20, MA50, MA200 |
| XEL | Xcel Energy, Inc | Utilities | $72.63 | +0.72% | 2025-09-17 | 30.5 | -7.4% | Below MA20, MA50, MA200 |
| SNPS | Synopsys, Inc | Technology | $372.58 | -12.53% | 2026-09-15 | 37.1 | -16.6% | Below MA20, MA50, MA200 |
| LULU | Lululemon Athletica inc | Consumer Cyclical | $98.26 | -39.47% | 2026-09-10 | 34.2 | -34.6% | Below MA20, MA50, MA200 |
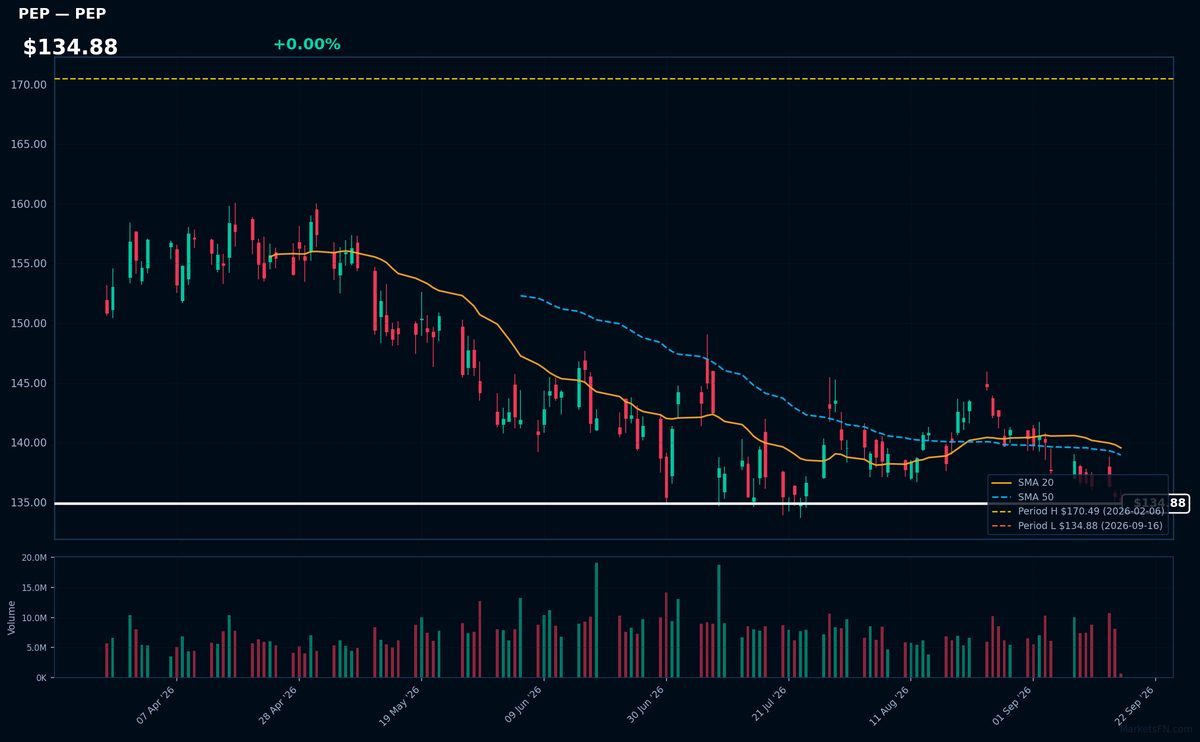
PEP | PepsiCo Inc | Consumer Defensive | Price Last: $134.88 | % Realized: -3.67% | RSI: 35.7 | % above MA200: -9.1% | Trend: Below MA20, MA50, MA200
PepsiCo Inc is a diversified food and beverage company with brands like Pepsi, Lay's, and Gatorade, generating revenue through beverage sales, snack foods, and other categories, making it an attractive investment for those seeking stable consumer staples exposure.
PepsiCo's technicals indicate a warning sign with an RSI(14) of 35.7, below MA20/MA50/MA200, and currently 0.0% above its 52-Week low, suggesting major support is being tested, potentially signaling further downside.
Related headlines
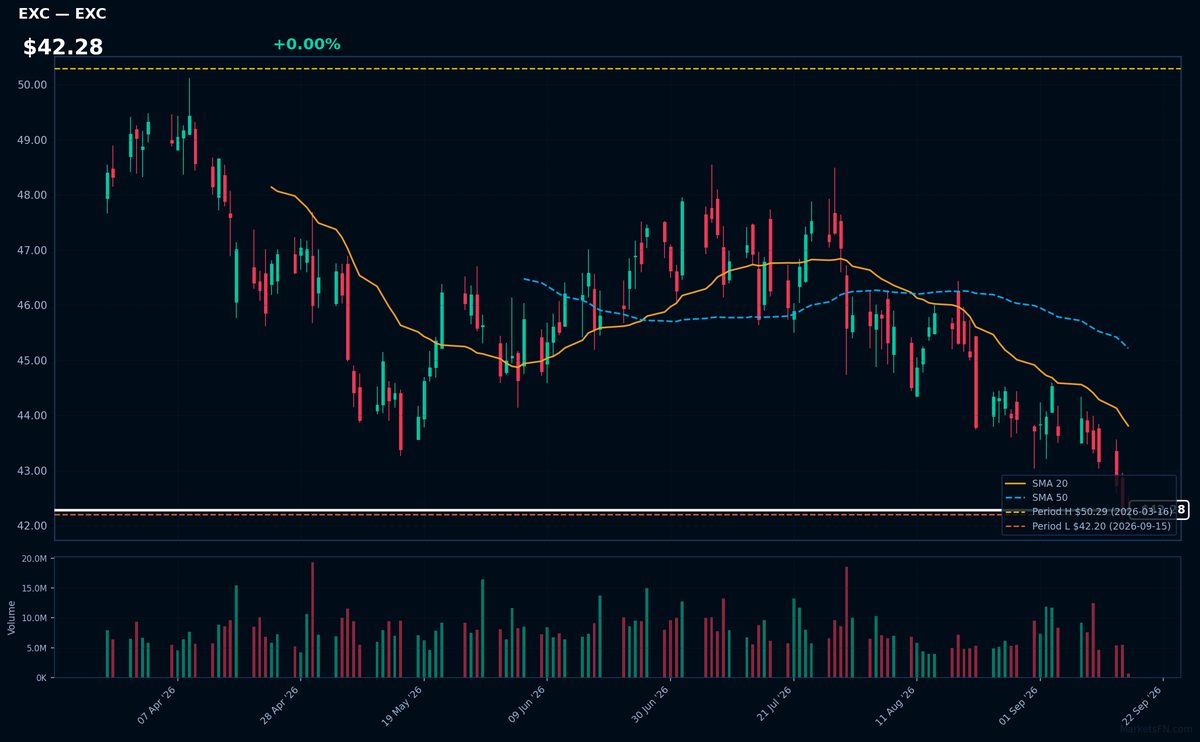
EXC | Exelon Corp | Utilities | Price Last: $42.28 | % Realized: -1.04% | RSI: 30.8 | % above MA200: -7.8% | Trend: Below MA20, MA50, MA200
Exelon Corp is a utility company that generates and distributes electricity, operating nuclear, natural gas, and renewable energy facilities. Investors should care about its stable cash flows and dividend yield, given its role in meeting energy demands.
Exelon Corp's technicals indicate a sustained downtrend with price ($42.28) below MA20, MA50, and MA200. The RSI(14) is 30.8, nearing oversold territory, and the stock is 0.2% above its 52-Week low, testing major support, potentially a warning sign.
Related headlines
- Exelon Announces Key Leadership Position Changes
- Exelon Secures More Than $1 Billion in Customer Protections Through Pioneering Transmission Security Agreements
- Exelon high probability data center load falls 40%
- Exelon Corp (EXC) (Q2 2026) Earnings Call Highlights: Navigating Regulatory Hurdles and Data ...
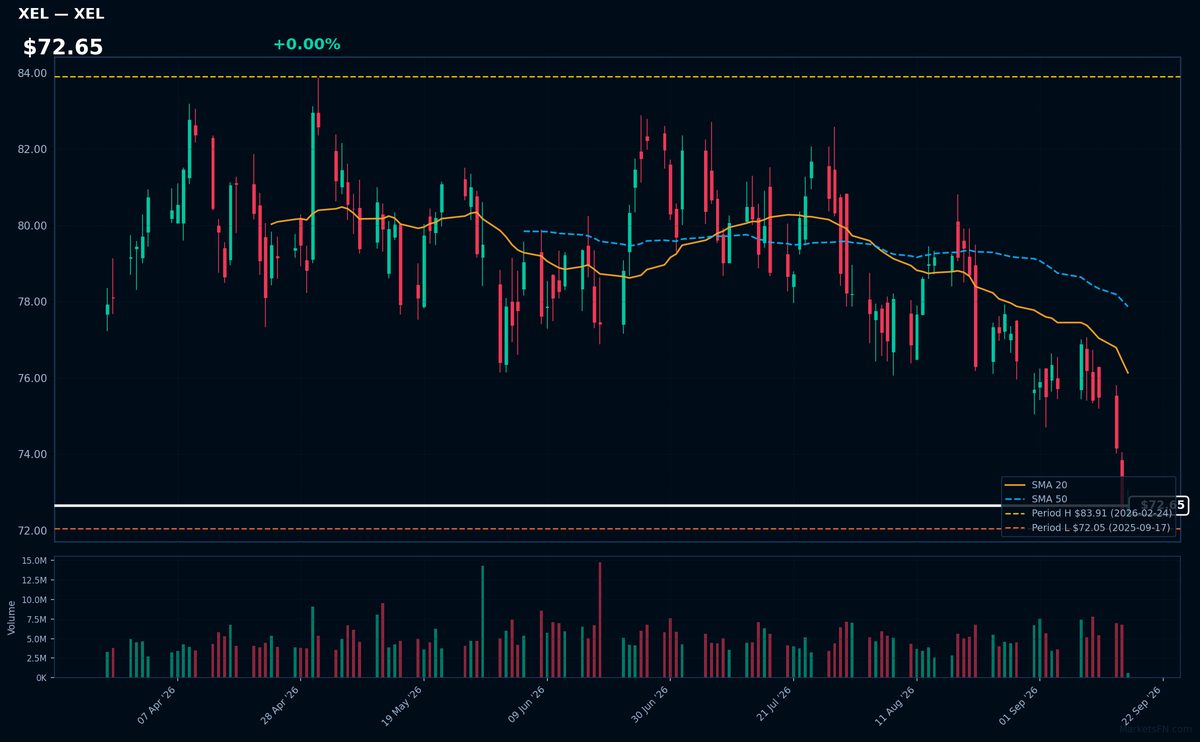
XEL | Xcel Energy, Inc | Utilities | Price Last: $72.63 | % Realized: +0.72% | RSI: 30.5 | % above MA200: -7.4% | Trend: Below MA20, MA50, MA200
Xcel Energy, Inc is a major electric and natural gas utility company serving 3.4 million customers across eight states, generating and distributing electricity from a diverse mix of sources including wind, solar, and natural gas, making it relevant to investors seeking stable, regulated energy exposure.
Xcel Energy's current technical situation indicates a sustained downtrend with price ($72.65) below MA20, MA50, and MA200. The RSI(14) is 30.5, nearing oversold territory, and the stock is 0.8% above its 52-Week low, testing major support, potentially a warning sign.
Related headlines
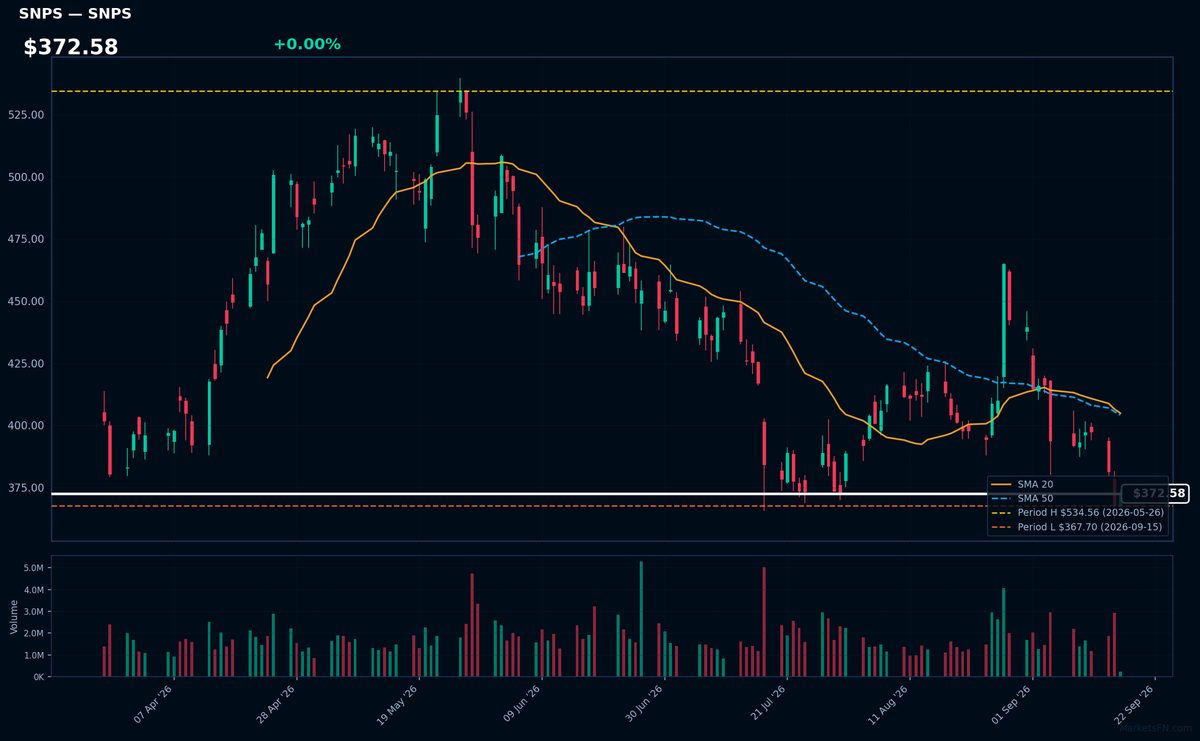
SNPS | Synopsys, Inc | Technology | Price Last: $372.58 | % Realized: -12.53% | RSI: 37.1 | % above MA200: -16.6% | Trend: Below MA20, MA50, MA200
Synopsys, Inc is a software company that provides electronic design automation (EDA) tools and semiconductor intellectual property (IP) used in the design and verification of complex digital systems-on-chips, making it a crucial player in the semiconductor industry.
Synopsys' current technical situation shows a potential warning sign with an RSI(14) of 37.1, below MA20, MA50, and MA200, and is only 1.3% above its 52-Week low, indicating a test of major support.
Related headlines
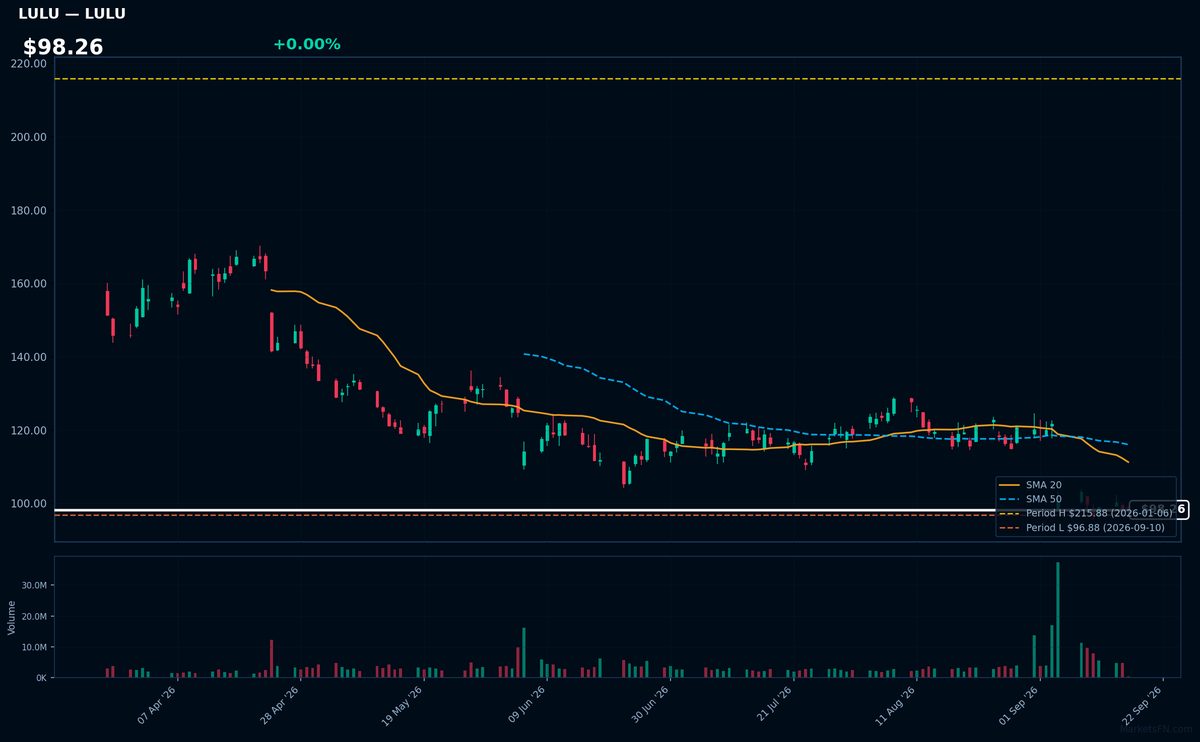
LULU | Lululemon Athletica inc | Consumer Cyclical | Price Last: $98.26 | % Realized: -39.47% | RSI: 34.2 | % above MA200: -34.6% | Trend: Below MA20, MA50, MA200
Lululemon Athletica inc designs and sells yoga and athletic wear, a niche with strong brand loyalty. Investors care due to its premium pricing and growth potential in the activewear market.
Lululemon's technicals indicate a sustained downtrend with price ($98.26) below MA20, MA50, and MA200. RSI(14) is 34.2, near oversold territory, and the stock is 1.4% above its 52-Week low, testing major support after a -39.5% 52-Week return.
Related headlines
- Lululemon's Founder Is Getting Divorced. What It Will Mean for His Fortune.
- Michael Burry calls Lululemon the trickster in his portfolio why its now his biggest position
- Lululemon is dealing with 'fixable problems', says fmr. CEO Christine Day
- Michael Burry Sells FLUT To Pile Into LULU Under $100 Plus A New Bet On ZTS
Market Commentary
The Nasdaq 100 stocks listed near 52-week extremes indicate a significant trend in the technology sector. Stocks near 52-week highs, such as FTNT and CRWD, are -0.4% or less from their highs, while those near 52-week lows, like PEP and EXC, are marginally above their lows. This suggests a strong directional bias in the tech sector.
The technology sector's performance is driven by various macro themes, including innovation and disruption. Companies like AAPL and CRWD are pushing the boundaries in their respective fields. The energy sector, represented by EXC and XEL, is also influencing the Nasdaq 100, with their proximity to 52-week lows potentially indicating underlying concerns.
Key levels to watch include the 52-week extremes for these stocks. A breakout or breakdown could be triggered by various catalysts, such as earnings reports or macroeconomic announcements. For instance, FTNT is already at its 52-week high, while PEP is at its 52-week low. Monitoring these levels and potential catalysts will be crucial in determining the next direction for these stocks.
Methodology: All 101 Nasdaq 100 constituents screened. 52-week high = highest daily close over the past 252 trading days (approx. 1 year). 52-week low = lowest daily close over the same period. Distance = (current price / extreme − 1) × 100. Technical indicators computed on up to 1 year of daily OHLCV data.
Disclaimer: For informational purposes only. Not investment advice. Past performance is not indicative of future results.

