Nasdaq 100 52-Week Highs & Lows Radar: Electronic Arts, (EA), Electronic Arts, (EA) and more
MarketsFN Team

Nasdaq 100 52-Week Highs & Lows Radar: Electronic Arts, (EA), Electronic Arts, (EA) and more
Screening all 101 Nasdaq 100 constituents for stocks nearest to their 52-week high and their 52-week low. Data as of September 14, 2026. % Realized = 52-week total return.
Legend: RSI > 70 = overbought · RSI < 30 = oversold · Green % Realized = positive 52W return · Red = negative.
📈 Nearest to 52-Week High
Sectors represented: Technology (2), Communication Services (1), Energy (1), Consumer Defensive (1)
| Ticker | Company | Sector | Price Last | % Realized | 52-Week High Date | RSI | % above MA200 | Trend |
|---|---|---|---|---|---|---|---|---|
| EA | Electronic Arts, Inc | Communication Services | $209.70 | +0.38% | 2026-08-04 | — | — | — |
| CRWD | Crowdstrike Holdings Inc | Technology | $229.88 | +106.74% | 2026-08-31 | 60.4 | +58.9% | Above MA20, MA50, MA200 |
| FANG | Diamondback Energy Inc | Energy | $209.95 | +56.06% | 2026-05-04 | 61.8 | +15.2% | Above MA20, MA50, MA200 |
| AAPL | Apple Inc | Technology | $334.09 | +41.14% | 2026-07-28 | 64.0 | +17.1% | Above MA20, MA50, MA200 |
| MDLZ | Mondelez International Inc | Consumer Defensive | $62.92 | +2.13% | 2026-07-29 | 54.0 | +6.2% | Above MA20, MA50, MA200 |
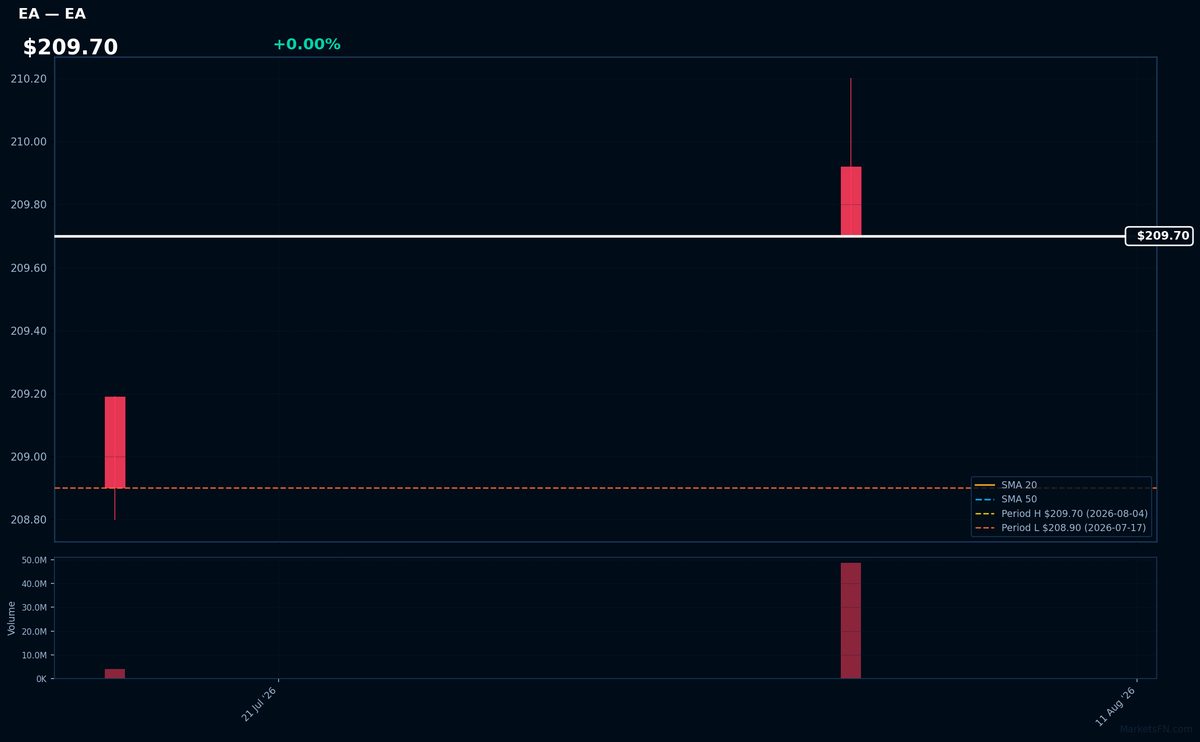
EA | Electronic Arts, Inc | Communication Services | Price Last: $209.70 | % Realized: +0.38% | RSI: — | % above MA200: — | Trend: —
Electronic Arts, Inc (EA) is a video game company that develops and publishes games such as FIFA and Madden NFL. Investors should care because its games have a large and dedicated player base, potentially driving revenue.
The stock is near its 52-Week high, up 0.4% over the period. Since MA and RSI data is incomplete or N/A, the technical situation cannot be fully assessed.
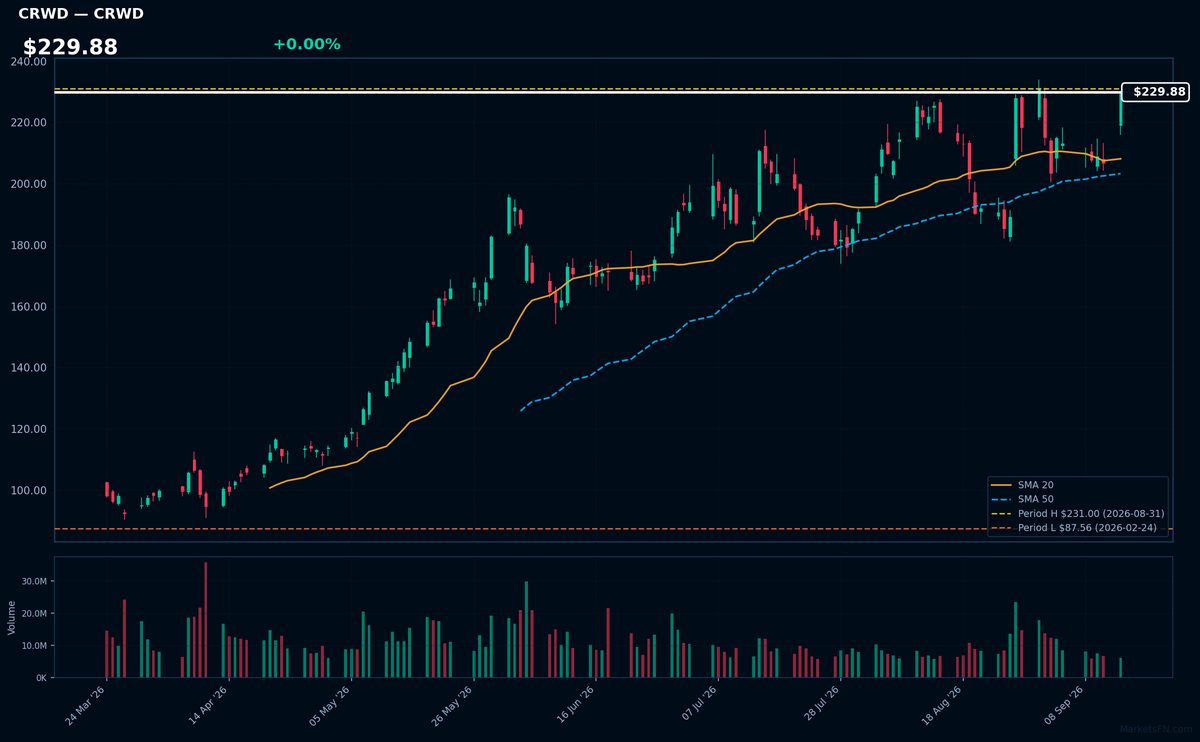
CRWD | Crowdstrike Holdings Inc | Technology | Price Last: $229.88 | % Realized: +106.74% | RSI: 60.4 | % above MA200: +58.9% | Trend: Above MA20, MA50, MA200
Crowdstrike Holdings Inc is a cybersecurity company providing cloud-delivered endpoint and cloud workload protection. Investors should care because its innovative Falcon platform has driven significant growth, making it a key player in the rapidly expanding cybersecurity market.
Crowdstrike's technicals indicate sustained uptrend with price > MA20 > MA50 > MA200, RSI(14) at 60.4, and is 0.5% below its 52-Week high, suggesting momentum near a potential breakout level, with a 106.7% 52-Week return.
Related headlines
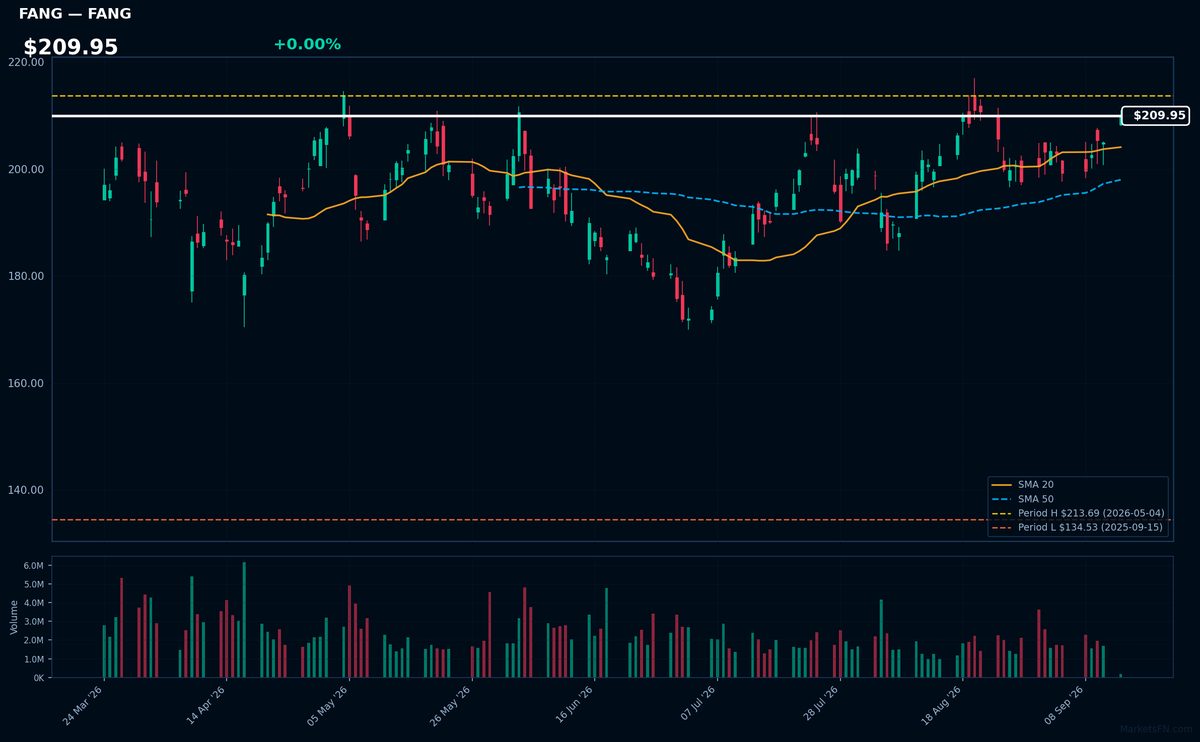
FANG | Diamondback Energy Inc | Energy | Price Last: $209.95 | % Realized: +56.06% | RSI: 61.8 | % above MA200: +15.2% | Trend: Above MA20, MA50, MA200
Diamondback Energy Inc is an oil and gas company. Investors should care because its performance is tied to energy prices and production levels. As an energy producer, its stock performance reflects the overall health of the energy sector.
Diamondback Energy Inc is in a sustained uptrend with price > MA20 > MA50 > MA200. The RSI(14) is 61.8, near its 52-Week high at 1.8% below, indicating strong momentum with 56.1% return over the 52-Week period.
Related headlines
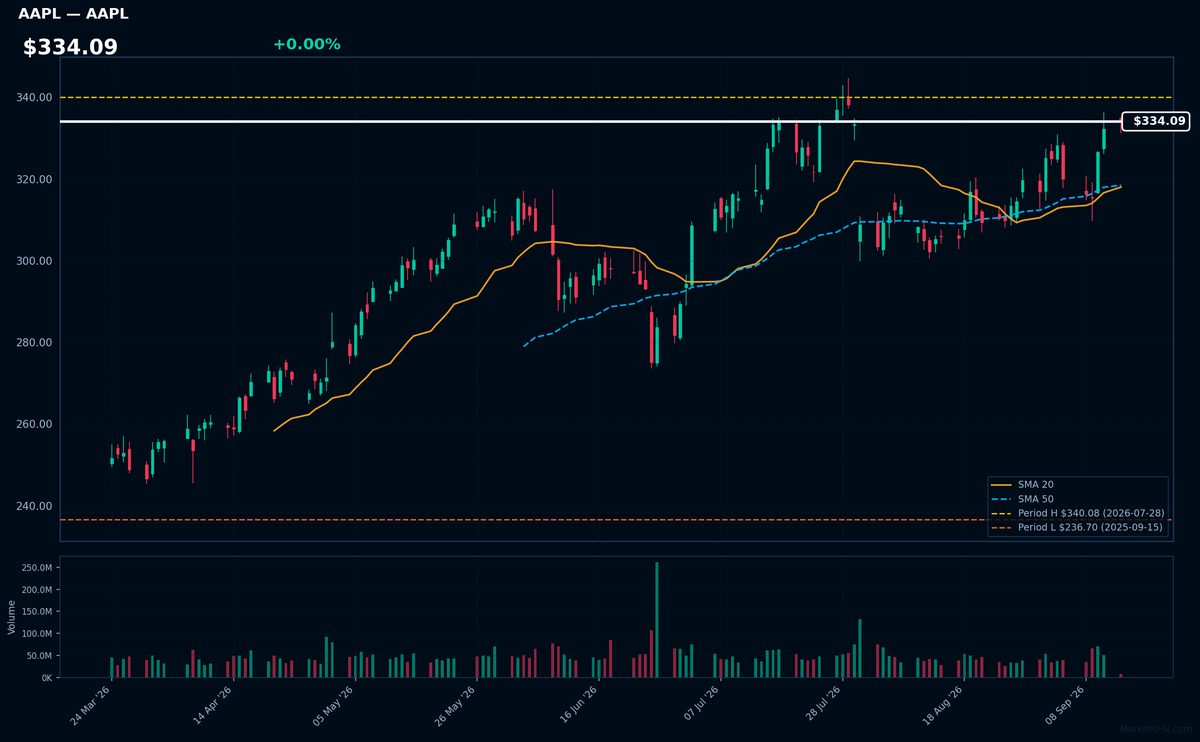
AAPL | Apple Inc | Technology | Price Last: $334.09 | % Realized: +41.14% | RSI: 64.0 | % above MA200: +17.1% | Trend: Above MA20, MA50, MA200
Apple Inc designs, manufactures, and markets consumer electronics, software, and services. Investors care about its innovative product ecosystem, including iPhones, Macs, and wearables, driving revenue growth and profitability.
AAPL's RSI(14) is 64.0, indicating rising momentum. The stock is above MA20, MA50, and MA200, with a 1.8% discount to its 52-Week high, suggesting a potential breakout. The 41.1% 52-Week return reinforces the momentum narrative.
Related headlines
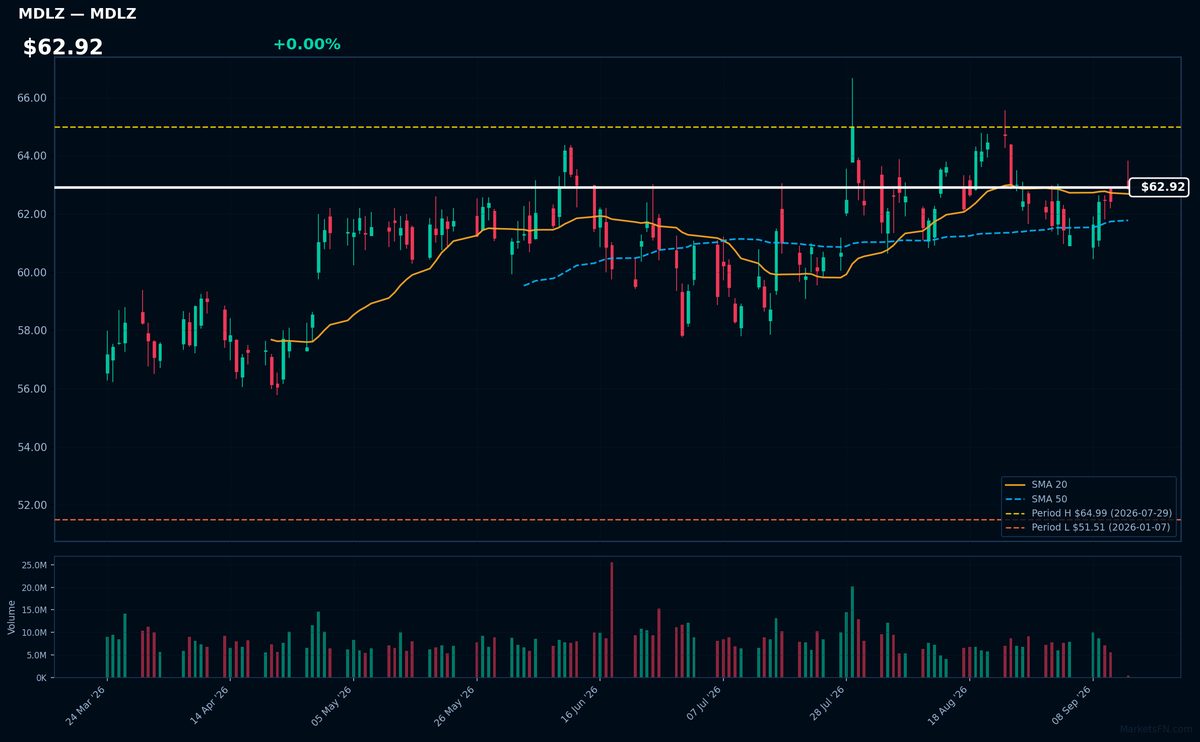
MDLZ | Mondelez International Inc | Consumer Defensive | Price Last: $62.92 | % Realized: +2.13% | RSI: 54.0 | % above MA200: +6.2% | Trend: Above MA20, MA50, MA200
Mondelez International Inc is a global snacking powerhouse with brands like Oreo and Cadbury. Investors should care about its ability to drive growth through premiumization and geographic expansion, potentially leading to increased revenue and profitability.
The stock shows a sustained uptrend with price > MA20 > MA50 > MA200 and RSI(14) at 54.0, indicating steady momentum. It's 3.2% below its 52-Week high, nearing a potential breakout level, suggesting continued upward pressure.
Related headlines
- How Mondelez wants to shake up snacking with cookies
- Müller teams up on yogurt NPD with Mondelez, Pladis
- Mondelez International Continues to Expand Sports Footprint with Sponsorships Across Five Powerhouse College Athletics Programs
- Mondelez International to Participate in Barclays Global Consumer Staples Conference on September 9, 2026
📉 Nearest to 52-Week Low
Sectors represented: Communication Services (1), Utilities (1), Healthcare (1), Industrials (1), Consumer Defensive (1)
| Ticker | Company | Sector | Price Last | % Realized | 52-Week Low Date | RSI | % above MA200 | Trend |
|---|---|---|---|---|---|---|---|---|
| EA | Electronic Arts, Inc | Communication Services | $209.70 | +0.38% | 2026-07-17 | — | — | — |
| EXC | Exelon Corp | Utilities | $42.90 | -1.22% | 2025-09-16 | 34.0 | -6.5% | Below MA20, MA50, MA200 |
| IDXX | Idexx Laboratories, Inc | Healthcare | $508.39 | -21.06% | 2026-09-11 | 33.9 | -15.6% | Below MA20, MA50, MA200 |
| HON | Honeywell International Inc | Industrials | $199.10 | -4.88% | 2025-11-20 | 26.7 | -13.4% | Below MA20, MA50, MA200 |
| PEP | PepsiCo Inc | Consumer Defensive | $137.75 | -2.05% | 2026-07-23 | 44.8 | -7.3% | Below MA20, MA50, MA200 |
EA | Electronic Arts, Inc | Communication Services | Price Last: $209.70 | % Realized: +0.38% | RSI: — | % above MA200: — | Trend: —
Electronic Arts, Inc (EA) is a video game company that develops and publishes games such as FIFA and Madden NFL. Investors should care because its games have a large and dedicated player base, potentially driving revenue.
The stock is near its 52-Week high, up 0.4% over the period. Since MA and RSI data is incomplete or N/A, the technical situation cannot be fully assessed.
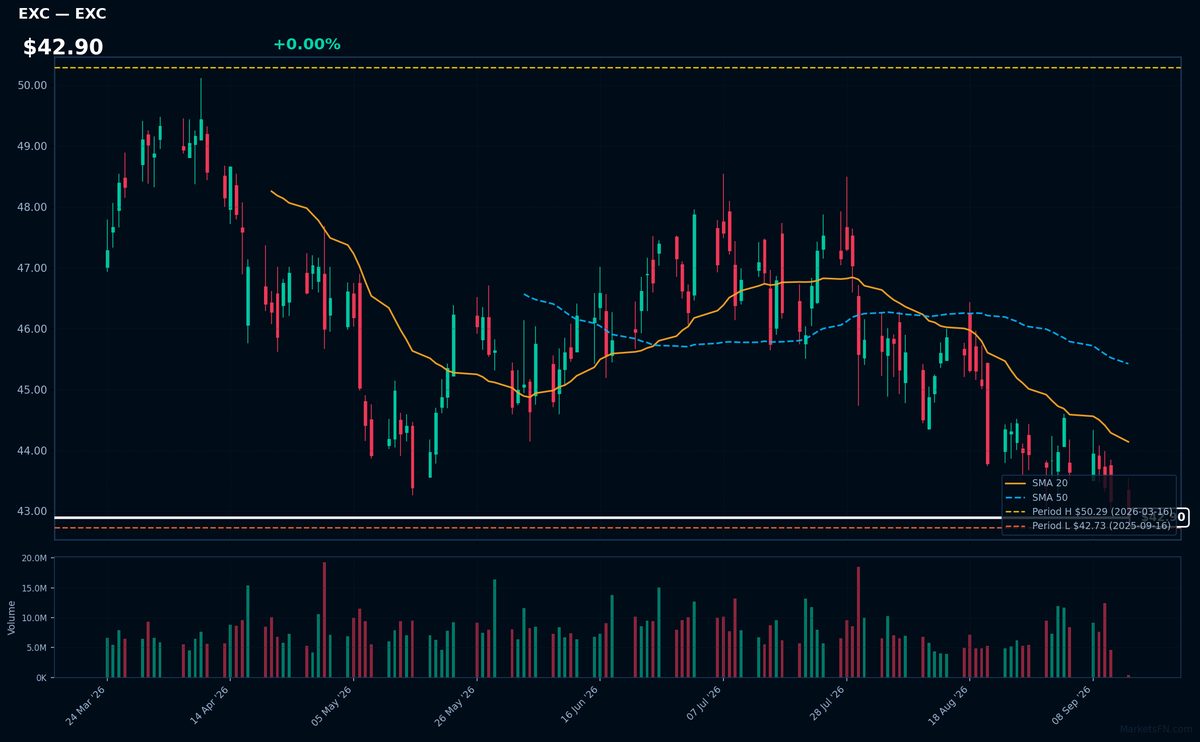
EXC | Exelon Corp | Utilities | Price Last: $42.90 | % Realized: -1.22% | RSI: 34.0 | % above MA200: -6.5% | Trend: Below MA20, MA50, MA200
Exelon Corp (EXC) is a utility company that generates and distributes electricity, operating nuclear, natural gas, and renewable energy facilities. Investors care about its stable cash flows and dividend yield, given its role in meeting energy demands.
EXC's technicals indicate a sustained downtrend with price ($42.90) below MA20, MA50, and MA200. The RSI(14) is 34.0, near oversold territory, and the stock is 0.4% above its 52-Week low, testing major support, potentially a warning sign.
Related headlines
- Exelon Announces Key Leadership Position Changes
- Exelon Secures More Than $1 Billion in Customer Protections Through Pioneering Transmission Security Agreements
- Exelon high probability data center load falls 40%
- Exelon Corp (EXC) (Q2 2026) Earnings Call Highlights: Navigating Regulatory Hurdles and Data ...
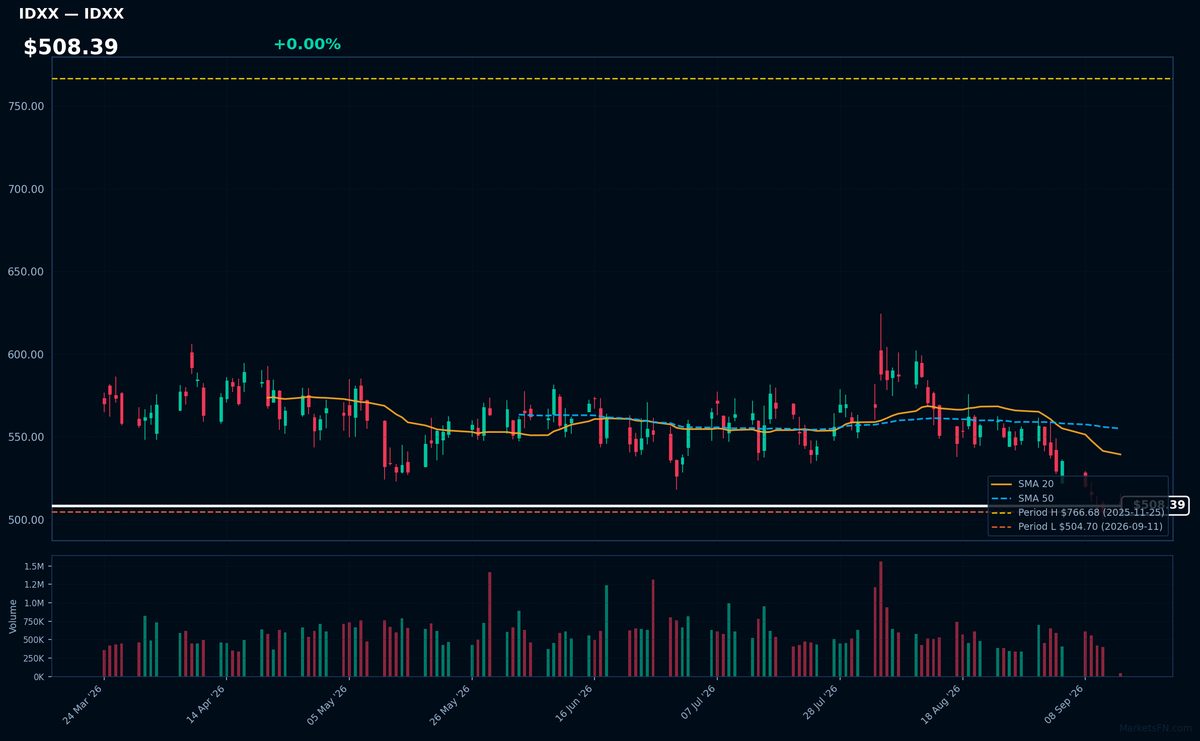
IDXX | Idexx Laboratories, Inc | Healthcare | Price Last: $508.39 | % Realized: -21.06% | RSI: 33.9 | % above MA200: -15.6% | Trend: Below MA20, MA50, MA200
Idexx Laboratories, Inc is a leading provider of veterinary diagnostic and software solutions. Investors should care because its products and services are crucial for animal healthcare, driving revenue growth. Its innovative edge in diagnostics and companion animal healthcare is key.
IDXX's technicals indicate a sustained downtrend with price < MA20 < MA50 < MA200. The RSI(14) is 33.9, nearing oversold territory. The stock is 0.7% above its 52-Week low, testing major support, and has returned -21.1% over the 52-Week period, signaling a potential warning sign.
Related headlines
- IDEXX Laboratories to Participate in Morgan Stanley 24th Annual Global Healthcare Conference
- IDEXX Expands Catalyst Platform into Cardiac Disease with First and Only Dual-Species Point-of-Care NT-proBNP Test
- IDEXX Laboratories, Inc. Q2 2026 Earnings Call Summary
- IDEXX Laboratories Inc (IDXX) (Q2 2026) Earnings Call Highlights: Strong Revenue Growth and ...
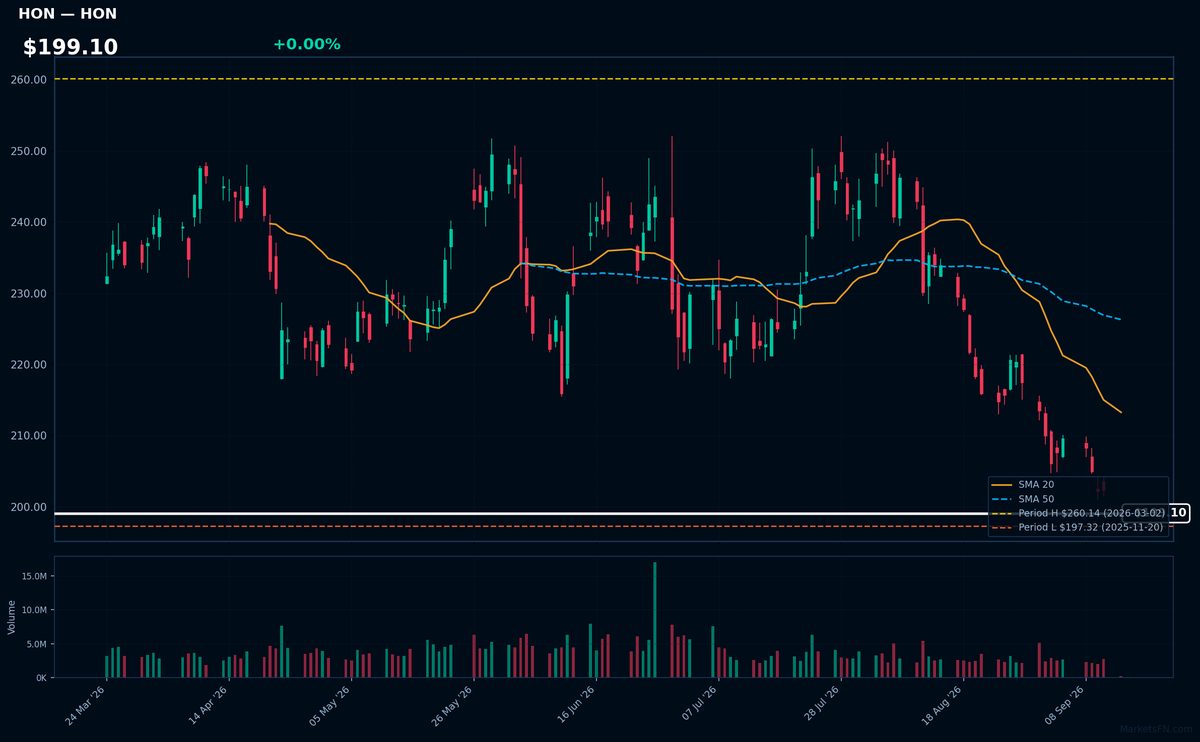
HON | Honeywell International Inc | Industrials | Price Last: $199.10 | % Realized: -4.88% | RSI: 26.7 | % above MA200: -13.4% | Trend: Below MA20, MA50, MA200
Honeywell International Inc is a diversified technology conglomerate that operates in aerospace, building technologies, performance materials, and safety & productivity solutions, providing innovative products that drive industrial efficiency and commercial aviation growth, making it a significant player in multiple critical industries.
Honeywell's current technical situation indicates a sustained downtrend with price at $199.10 below all key MAs (MA20, MA50, MA200), and an RSI(14) of 26.7, signaling oversold conditions near its 52-Week low, a potential warning sign for further downside.
Related headlines
- Dow falls 175 points on losses for NVIDIA Corp., Honeywell stocks
- Is Honeywell Aerospace Stock Riskier Than Its Order Book Looks?
- Honeywell Technologies Announces Participation at Upcoming Investor Conference
- Honeywell Aerospace Agrees To Pay Over $2M To Settle Cybersecurity Allegations HONA Stock Falls 2.5%
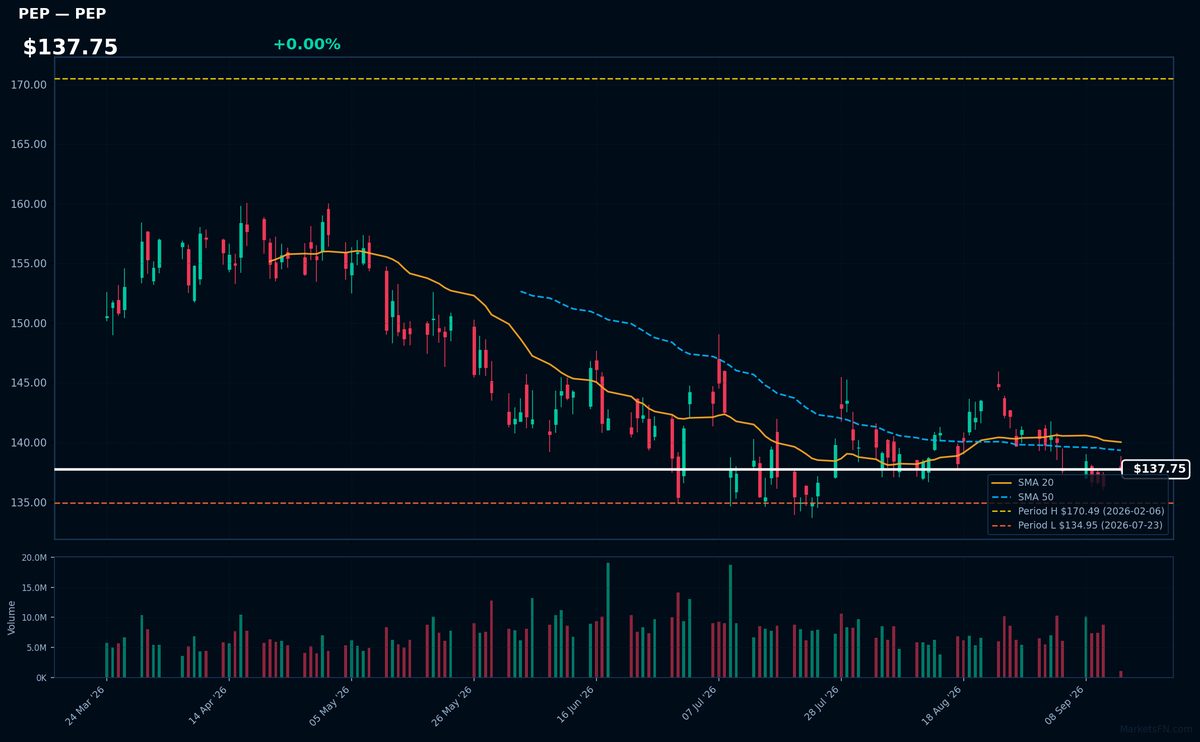
PEP | PepsiCo Inc | Consumer Defensive | Price Last: $137.75 | % Realized: -2.05% | RSI: 44.8 | % above MA200: -7.3% | Trend: Below MA20, MA50, MA200
PepsiCo Inc is a diversified food and beverage company with brands like Pepsi, Lay's, and Gatorade, generating revenue through beverage sales, snack foods, and other categories. Investors care about its stable cash flows and dividend yield.
PepsiCo's technicals indicate a warning sign: RSI(14) is 44.8, below MA20/MA50/MA200, and the stock is 2.1% above its 52-Week low, testing major support, with a -2.1% return over the 52-Week period.
Related headlines
Market Commentary
The Nasdaq 100 stocks near 52-week extremes indicate a significant trend. Stocks like EA and CRWD are near their 52-week highs, while others like EXC and IDXX are close to their 52-week lows. This suggests a divergence in performance within the index.
The technology sector is driving the highs, with EA and CRWD being notable examples. The proximity of AAPL to its 52-week high also underscores the strength of tech giants. Conversely, the presence of EXC and HON near their 52-week lows may be related to macroeconomic factors affecting their respective industries. The performance of these stocks near extremes may be influenced by broader market themes.
Key levels to watch include the 52-week highs and lows for these stocks. A breakout above the 52-week high for CRWD and AAPL, or a breakdown below the 52-week low for EXC and HON, could be significant. Catalysts for such movements could include earnings reports, industry trends, and macroeconomic indicators. Monitoring these levels and potential catalysts will be crucial for understanding the direction of these stocks and the broader Nasdaq 100 index.
Methodology: All 101 Nasdaq 100 constituents screened. 52-week high = highest daily close over the past 252 trading days (approx. 1 year). 52-week low = lowest daily close over the same period. Distance = (current price / extreme − 1) × 100. Technical indicators computed on up to 1 year of daily OHLCV data.
Disclaimer: For informational purposes only. Not investment advice. Past performance is not indicative of future results.

