Nasdaq 100 52-Week Highs & Lows Radar: Automatic Data Processing (ADP), Netflix (NFLX) and more
MarketsFN Team

Screening all 101 Nasdaq 100 constituents for stocks nearest to their 52-week high and their 52-week low. Data as of October 21, 2026. % Realized = 52-week total return.
Legend: RSI > 70 = overbought · RSI < 30 = oversold · Green % Realized = positive 52W return · Red = negative.
📈 Nearest to 52-Week High
Sectors represented: Technology (3), Industrials (1), Consumer Defensive (1)
| Ticker | Company | Sector | Price Last | % Realized | 52-Week High Date | RSI | % above MA200 | Trend |
|---|---|---|---|---|---|---|---|---|
| ADP | Automatic Data Processing Inc | Technology | $292.95 | +3.16% | 2026-10-21 | 72.3 | +22.5% | Above MA20, MA50, MA200 |
| TEAM | Atlassian Corporation | Technology | $223.39 | +32.41% | 2026-10-21 | 68.6 | +93.6% | Above MA20, MA50, MA200 |
| CTAS | Cintas Corporation | Industrials | $216.44 | +10.15% | 2026-10-20 | 71.5 | +14.4% | Above MA20, MA50, MA200 |
| KDP | Keurig Dr Pepper Inc | Consumer Defensive | $34.51 | +24.72% | 2026-10-20 | 67.6 | +16.0% | Above MA20, MA50, MA200 |
| AAPL | Apple Inc | Technology | $340.88 | +29.73% | 2026-10-16 | 57.3 | +16.1% | Above MA20, MA50, MA200 |
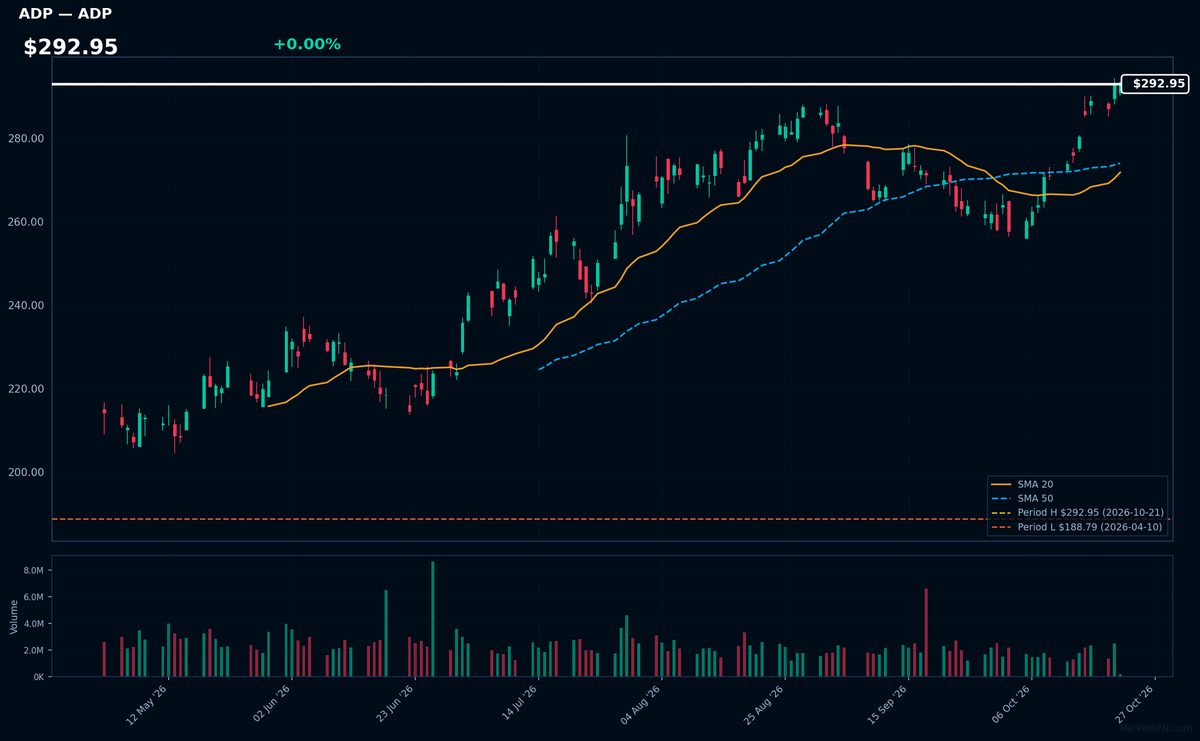
ADP | Automatic Data Processing Inc | Technology | Price Last: $292.95 | % Realized: +3.16% | RSI: 72.3 | % above MA200: +22.5% | Trend: Above MA20, MA50, MA200
ADP provides payroll processing, HR management, and tax filing services to businesses globally. Investors care because its recurring revenue model (85% from payroll) offers stability, while cloud migration and compliance complexity drive growth in a sticky, regulated industry with high switching costs.
ADP trades at $292.95 (0.0% below 52W high) with overbought RSI(14) at 72.3 and mixed MA alignment (above MA20/50/200). The 3.2% annual return suggests weak momentum despite extreme proximity to breakout — caution warranted given stretched technicals.
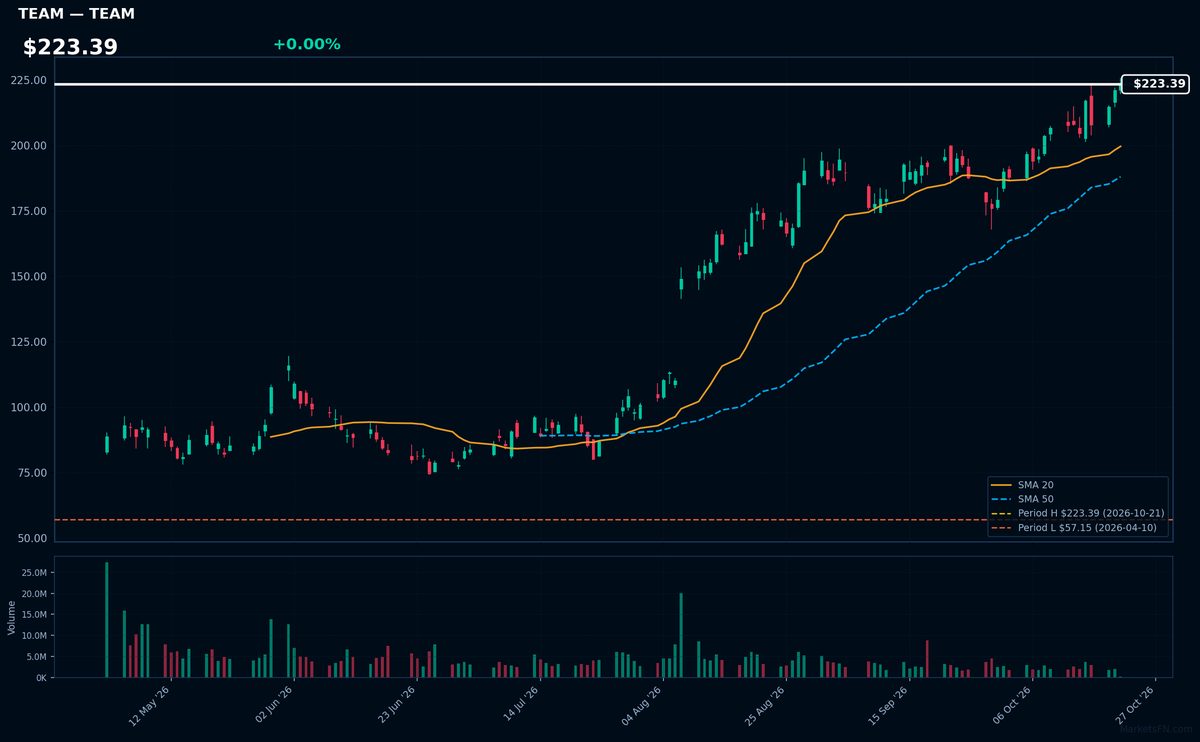
TEAM | Atlassian Corporation | Technology | Price Last: $223.39 | % Realized: +32.41% | RSI: 68.6 | % above MA200: +93.6% | Trend: Above MA20, MA50, MA200
Atlassian provides collaboration software (Jira, Confluence) for agile development teams. Investors care because its tools are mission-critical for software developers, creating sticky enterprise subscriptions with 32.4% annual returns as digital transformation accelerates.
Technically bullish with RSI(14) at 68.6 (approaching overbought) and price > MA20 > MA50 > MA200. Stock tests 52-week highs (0.0% below), suggesting strong momentum but potential near-term exhaustion.
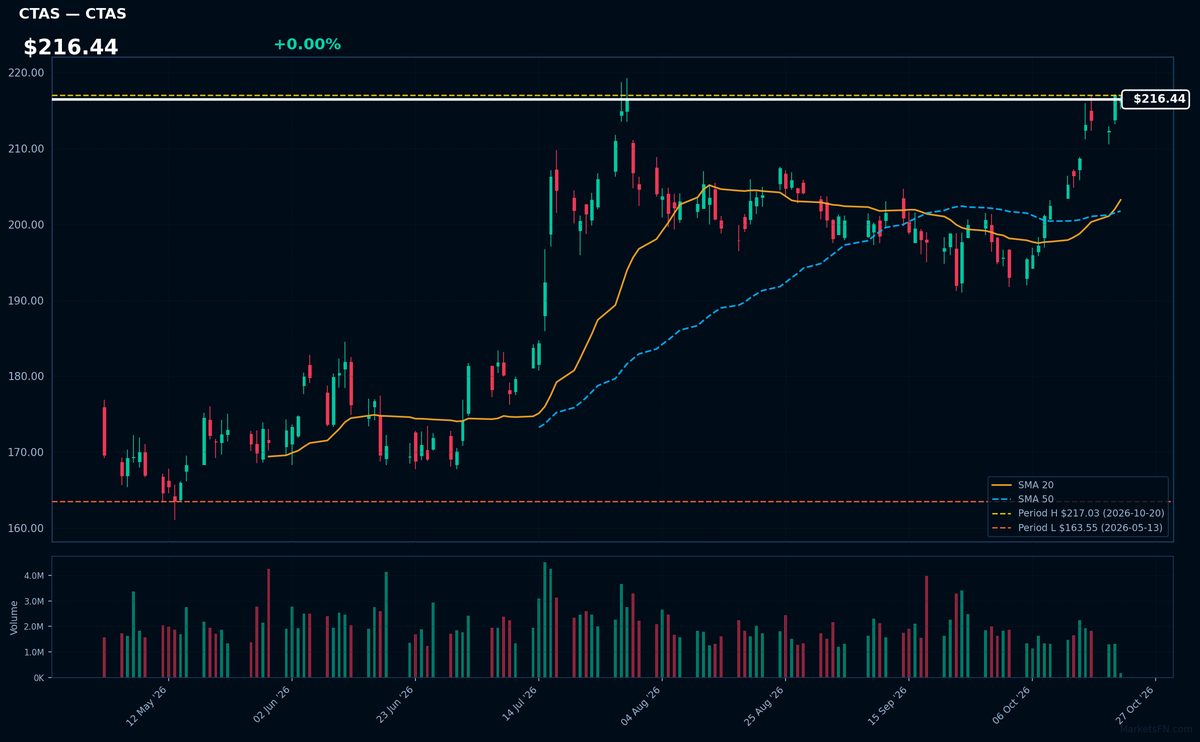
CTAS | Cintas Corporation | Industrials | Price Last: $216.44 | % Realized: +10.15% | RSI: 71.5 | % above MA200: +14.4% | Trend: Above MA20, MA50, MA200
Cintas provides corporate identity uniforms and facility services (restroom supplies, safety equipment) to businesses. Investors care because its recurring revenue model and essential services create stable cash flows even in economic downturns.
Technically bullish with price ($216.44) above all MAs and RSI(14) at 71.5 (near overbought). The 0.3% below 52-week high suggests breakout potential, but elevated RSI warrants caution.
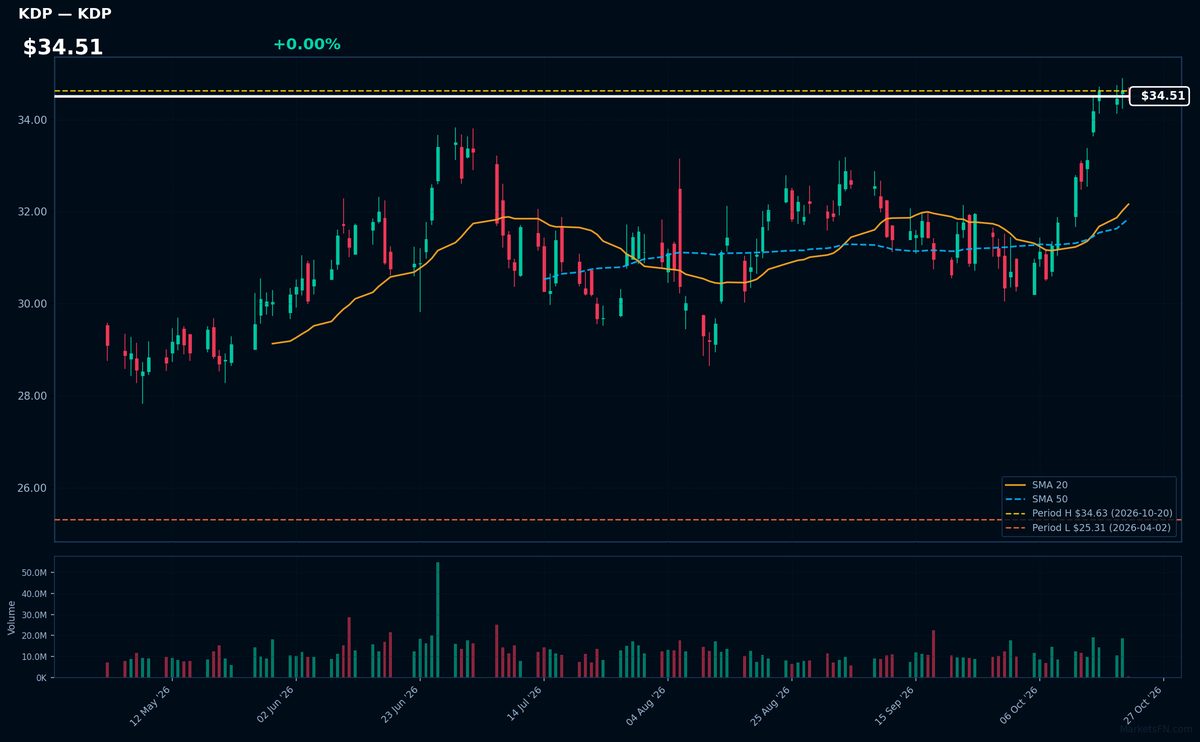
KDP | Keurig Dr Pepper Inc | Consumer Defensive | Price Last: $34.51 | % Realized: +24.72% | RSI: 67.6 | % above MA200: +16.0% | Trend: Above MA20, MA50, MA200
Keurig Dr Pepper Inc manufactures single-serve coffee systems (Keurig) and distributes beverages (Dr Pepper, Snapple). Investors care because it dominates North American coffee pods (75% market share) and holds #2 spot in US soft drinks, offering stable cash flows from recurring consumables purchases.
Technically bullish: RSI(14) at 67.6 shows strong momentum, with price ($34.51) above MA20>MA50>MA200 confirming the uptrend. The stock sits just 0.3% below 52-week highs after a 24.7% annual gain, suggesting continuation potential but warranting RSI caution near overbought territory.
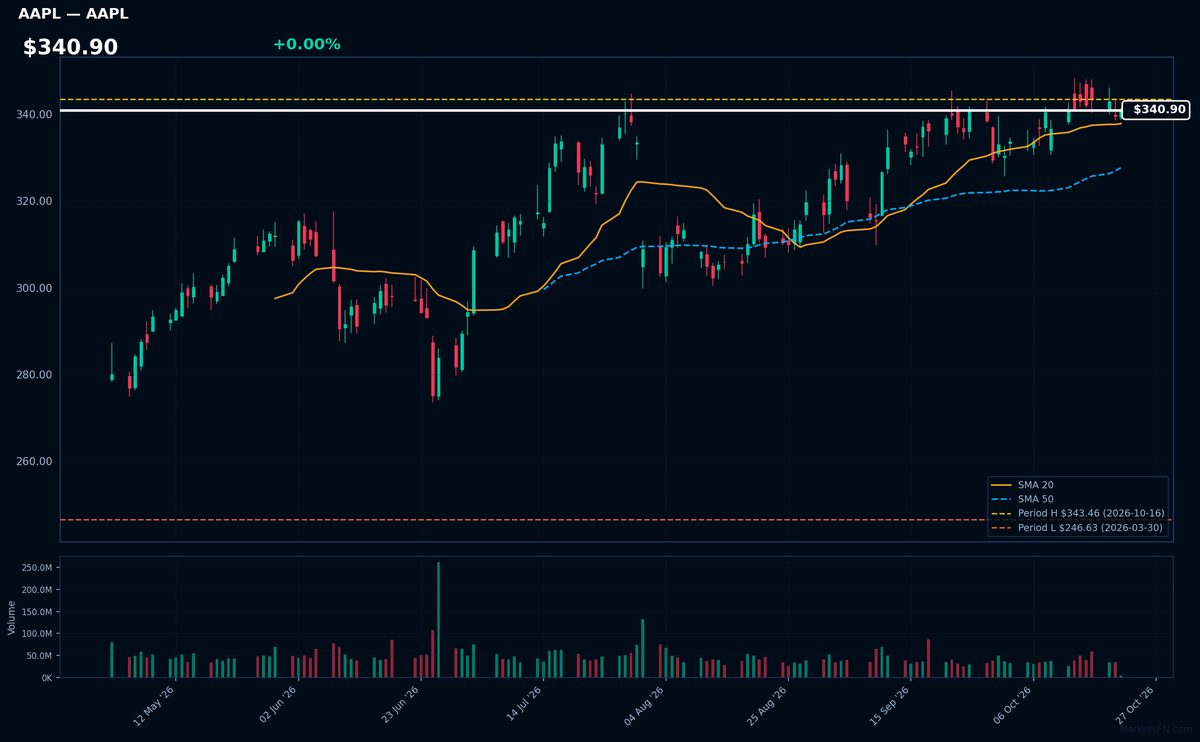
AAPL | Apple Inc | Technology | Price Last: $340.88 | % Realized: +29.73% | RSI: 57.3 | % above MA200: +16.1% | Trend: Above MA20, MA50, MA200
Apple designs premium consumer electronics (iPhone, Mac, AirPods) and operates high-margin services (App Store, iCloud). Investors care because its ecosystem creates recurring revenue and pricing power, with 29.7% annual returns demonstrating this advantage.
Technically bullish: $340.90 price shows sustained uptrend (MA20>MA50>MA200) and near breakout (0.8% below 52W high). RSI 57.3 suggests room for further momentum before overbought.
📉 Nearest to 52-Week Low
Sectors represented: Communication Services (4), Consumer Cyclical (1)
| Ticker | Company | Sector | Price Last | % Realized | 52-Week Low Date | RSI | % above MA200 | Trend |
|---|---|---|---|---|---|---|---|---|
| NFLX | Netflix Inc | Communication Services | $66.49 | -46.44% | 2026-10-21 | 35.4 | -19.4% | Below MA20, MA50, MA200 |
| APP | Applovin Corp | Communication Services | $268.63 | -51.39% | 2026-10-14 | 39.1 | -37.4% | Below MA20, MA50, MA200 |
| BKNG | Booking Holdings Inc | Consumer Cyclical | $159.22 | -24.70% | 2026-05-15 | 40.1 | -11.1% | Below MA20, MA50, MA200 |
| CHTR | Charter Communications Inc | Communication Services | $106.74 | -57.73% | 2026-10-12 | 38.1 | -36.6% | Below MA20, MA50, MA200 |
| TMUS | T-Mobile US Inc | Communication Services | $154.95 | -32.36% | 2026-10-09 | 39.9 | -17.8% | Below MA20, MA50, MA200 |
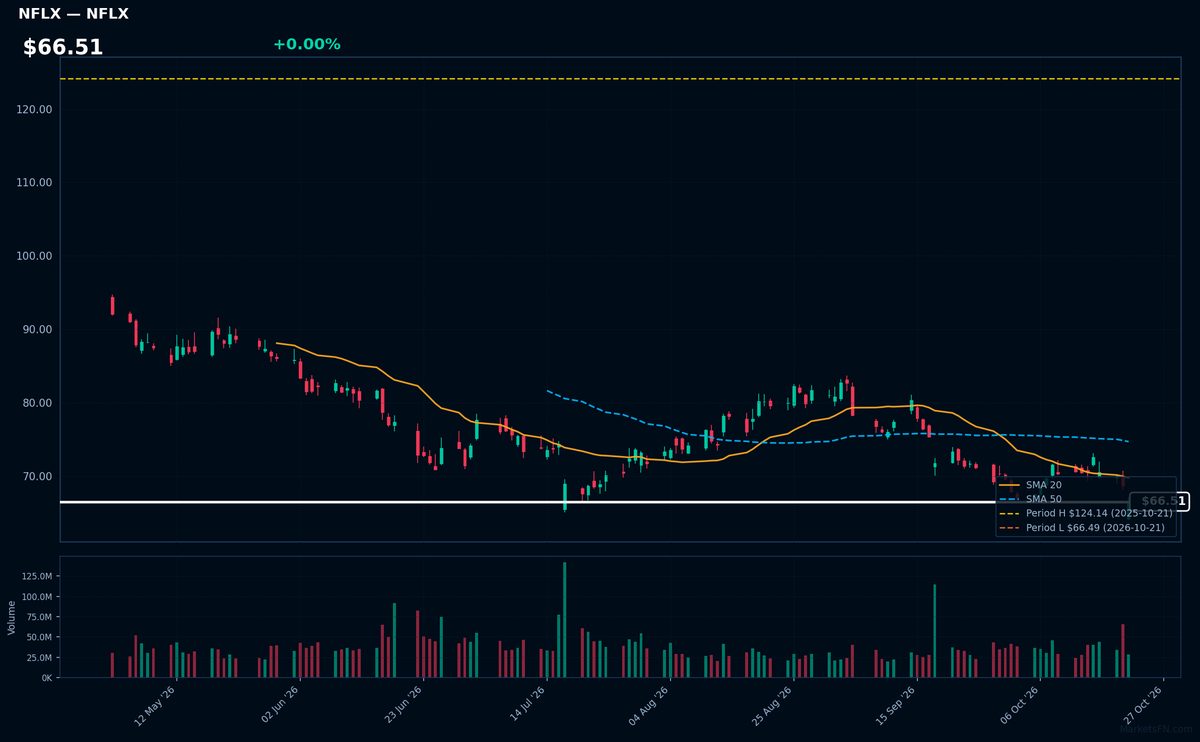
NFLX | Netflix Inc | Communication Services | Price Last: $66.49 | % Realized: -46.44% | RSI: 35.4 | % above MA200: -19.4% | Trend: Below MA20, MA50, MA200
Netflix Inc operates the world's dominant subscription streaming platform, producing original content and licensing third-party shows. Investors care because its global subscriber base and pricing power make it a bellwether for digital entertainment's profitability amid rising competition.
Netflix shows severe technical weakness: RSI(14) at 35.4 (approaching oversold) with bearish MA alignment (price < MA20 < MA50 < MA200). Trading just 0.0% above 52-week lows after a -46.4% plunge, this is a clear warning sign of sustained downtrend pressure.
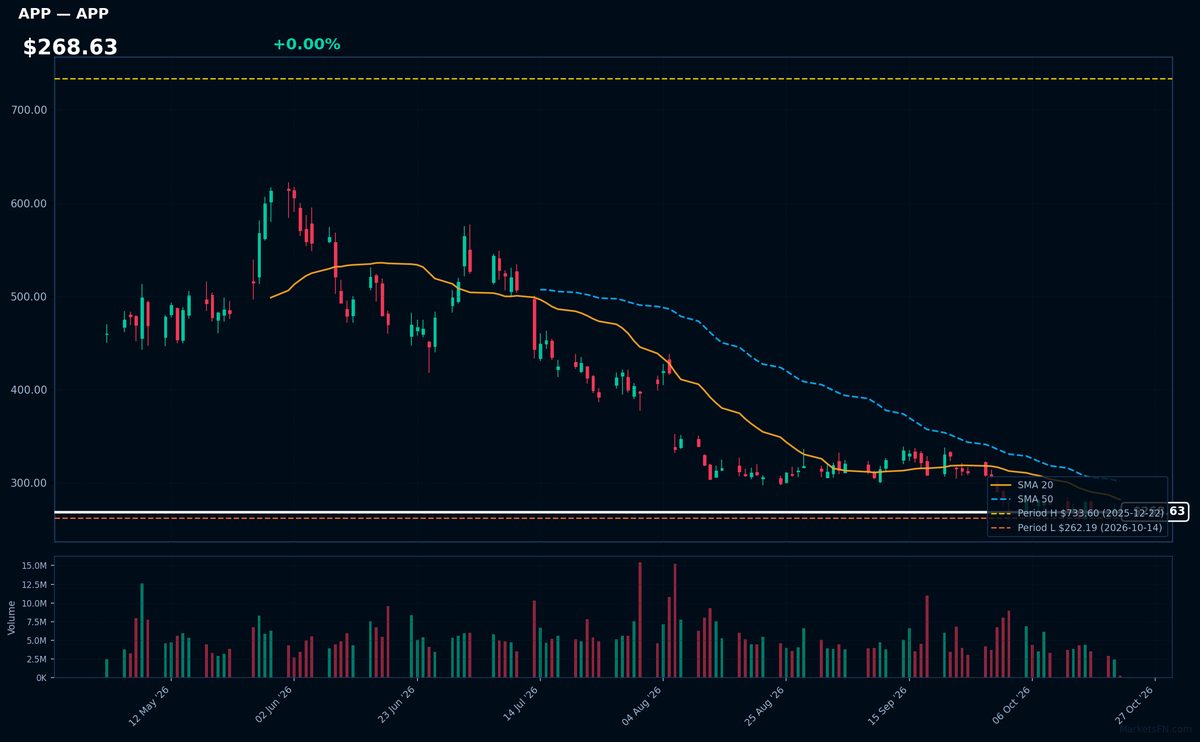
APP | Applovin Corp | Communication Services | Price Last: $268.63 | % Realized: -51.39% | RSI: 39.1 | % above MA200: -37.4% | Trend: Below MA20, MA50, MA200
Applovin operates a mobile advertising platform that helps developers monetize apps through targeted ads and analytics. Investors care because its AI-powered ad network captures growth in mobile gaming and app marketing, a $300B+ global market.
Technically concerning: RSI(14) at 39.1 shows weak momentum, with bearish MA alignment (price < MA20 < MA50 < MA200) and just 2.5% above 52-week lows. The -51.4% annual return signals sustained downtrend, testing critical support.
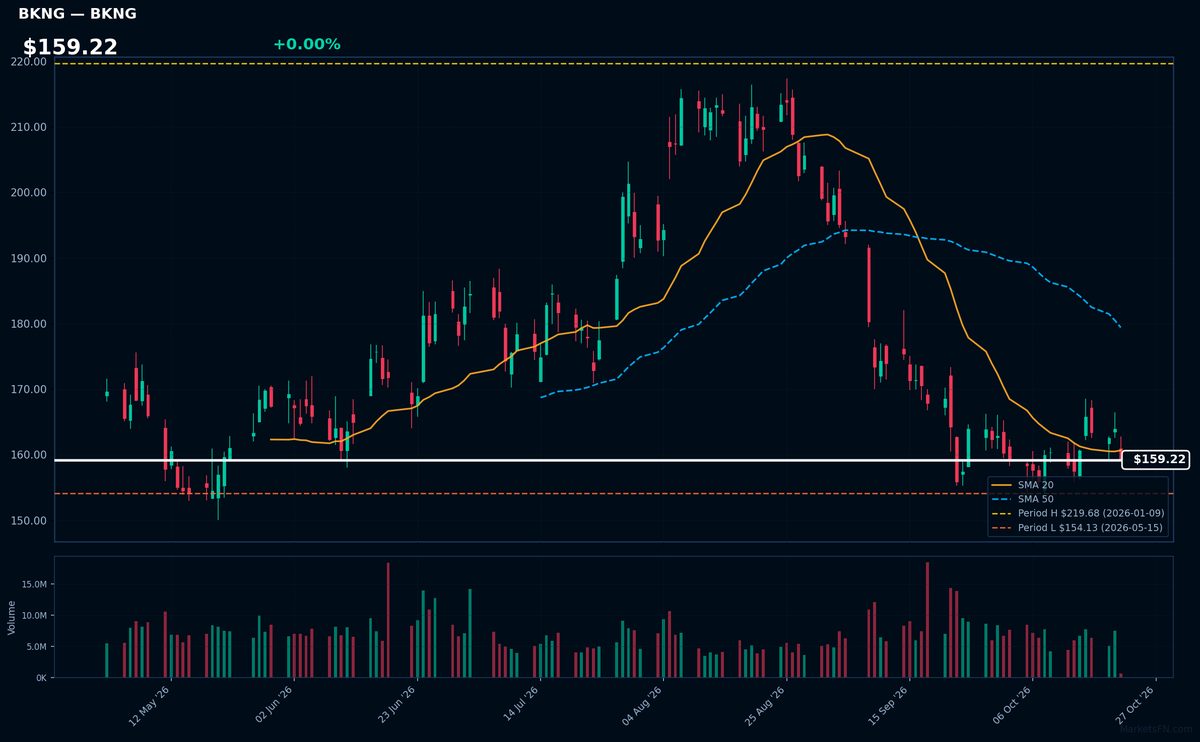
BKNG | Booking Holdings Inc | Consumer Cyclical | Price Last: $159.22 | % Realized: -24.70% | RSI: 40.1 | % above MA200: -11.1% | Trend: Below MA20, MA50, MA200
Booking Holdings operates leading online travel platforms (Booking.com, Priceline, Kayak) connecting travelers with lodging/transportation. Investors care because it dominates global online travel with pricing power and high-margin recurring revenue, though exposed to economic cycles.
Technically concerning: RSI(14) at 40.1 shows weakening momentum, trading below MA20/MA50/MA200 with mixed signals, just 3.3% above 52-week lows after a 24.7% annual decline — testing critical support.
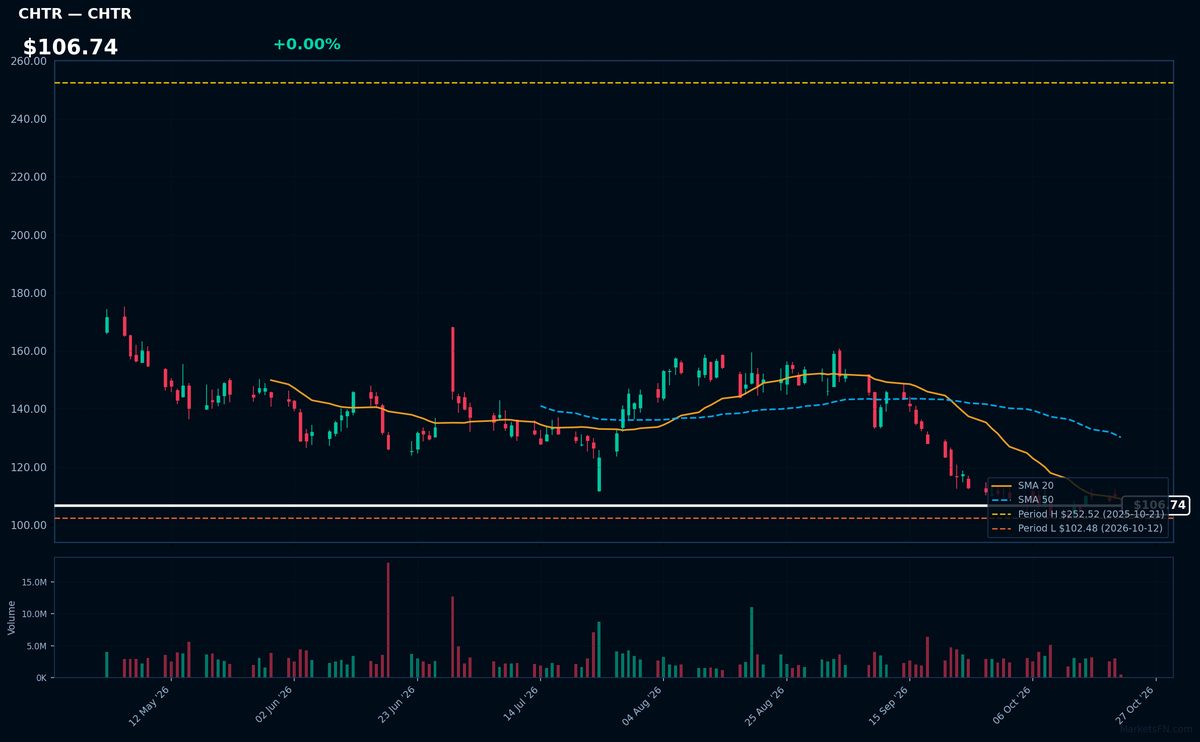
CHTR | Charter Communications Inc | Communication Services | Price Last: $106.74 | % Realized: -57.73% | RSI: 38.1 | % above MA200: -36.6% | Trend: Below MA20, MA50, MA200
Charter Communications provides cable TV, internet, and voice services to 32 million customers under the Spectrum brand. Investors watch its broadband growth amid cord-cutting, as it operates in a consolidated industry with high infrastructure costs but recurring revenue from essential connectivity services.
Technically dire: RSI at 38.1 shows oversold conditions, but the sustained downtrend (price < MA20 < MA50 < MA200) and -57.7% annual return signal severe weakness. Trading just 4.2% above 52-week lows, this tests critical support — a warning sign absent fundamental catalysts.
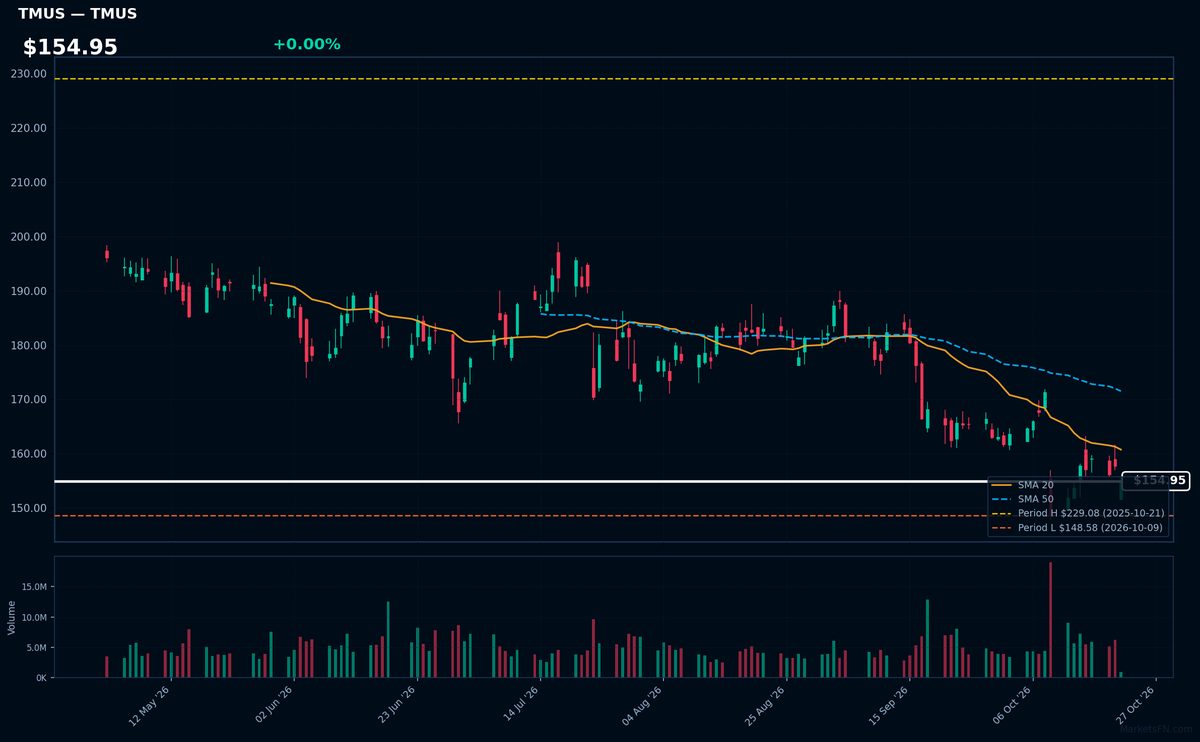
TMUS | T-Mobile US Inc | Communication Services | Price Last: $154.95 | % Realized: -32.36% | RSI: 39.9 | % above MA200: -17.8% | Trend: Below MA20, MA50, MA200
T-Mobile US operates the nation's largest 5G network, serving 117 million customers with wireless services. Investors watch its spectrum advantage and post-merger synergies from Sprint integration, which drive industry-leading subscriber growth and cash flow expansion in the consolidating telecom sector.
Technically distressed with RSI(14) at 39.9 and bearish MA alignment (price < MA20 < MA50 < MA200). Trading just 4.3% above 52-week lows after a -32.4% decline signals severe downside momentum, testing critical support levels.
Market Commentary
The clustering of Nasdaq 100 stocks at 52-week extremes signals a stark divergence in market sentiment. ADP, TEAM, and AAPL trading near highs reflects confidence in resilient business models (payroll software, collaboration tools, and consumer tech), while NFLX and BKNG hovering near lows suggests concerns about streaming competition and travel demand volatility. This bifurcation highlights selective risk appetite amid macroeconomic uncertainty.
Sector themes explain the split: Cloud-based productivity tools (TEAM, ADP) benefit from hybrid work tailwinds, while consumer-facing tech (AAPL, KDP) demonstrates pricing power. Conversely, NFLX faces streaming saturation, and BKNG contends with recession fears dampening travel. Interest rate sensitivity weighs on growth stocks like APP and CHTR, with TMUS's relative resilience (+4.3% from low) reflecting stable telecom demand.
Monitor AAPL's -0.8% gap to its high for tech leadership cues, while NFLX holding at +0.0% above its low is critical for growth sentiment. Catalysts include earnings revisions (CTAS, KDP margin resilience) and consumer spending data (BKNG, AAPL). Breakdown risks loom for CHTR if broadband growth slows; TEAM could extend gains on SaaS demand confirmation.
Methodology: All 101 Nasdaq 100 constituents screened. 52-week high = highest daily close over the past 252 trading days (approx. 1 year). 52-week low = lowest daily close over the same period. Distance = (current price / extreme − 1) × 100. Technical indicators computed on up to 1 year of daily OHLCV data.
Disclaimer: For informational purposes only. Not investment advice. Past performance is not indicative of future results.