Nasdaq 100 52-Week Highs & Lows Radar: Atlassianoration (TEAM), Comcast (CMCSA) and more
MarketsFN Team

Nasdaq 100 52-Week Highs & Lows Radar: Atlassianoration (TEAM), Comcast (CMCSA) and more
Screening all 101 Nasdaq 100 constituents for stocks nearest to their 52-week high and their 52-week low. Data as of October 08, 2026. % Realized = 52-week total return.
Legend: RSI > 70 = overbought · RSI < 30 = oversold · Green % Realized = positive 52W return · Red = negative.
📈 Nearest to 52-Week High
Sectors represented: Technology (5)
| Ticker | Company | Sector | Price Last | % Realized | 52-Week High Date | RSI | % above MA200 | Trend |
|---|---|---|---|---|---|---|---|---|
| TEAM | Atlassian Corporation | Technology | $197.43 | +32.04% | 2026-10-08 | 61.1 | +74.7% | Above MA20, MA50, MA200 |
| FTNT | Fortinet Inc | Technology | $189.57 | +119.26% | 2026-10-06 | 69.1 | +57.0% | Above MA20, MA50, MA200 |
| AAPL | Apple Inc | Technology | $337.37 | +30.73% | 2026-09-25 | 58.4 | +16.2% | Above MA20, MA50, MA200 |
| NVDA | NVIDIA Corp | Technology | $234.90 | +24.21% | 2026-10-06 | 60.3 | +16.3% | Above MA20, MA50, MA200 |
| AMD | Advanced Micro Devices Inc | Technology | $637.36 | +170.57% | 2026-10-06 | 67.2 | +66.2% | Above MA20, MA50, MA200 |
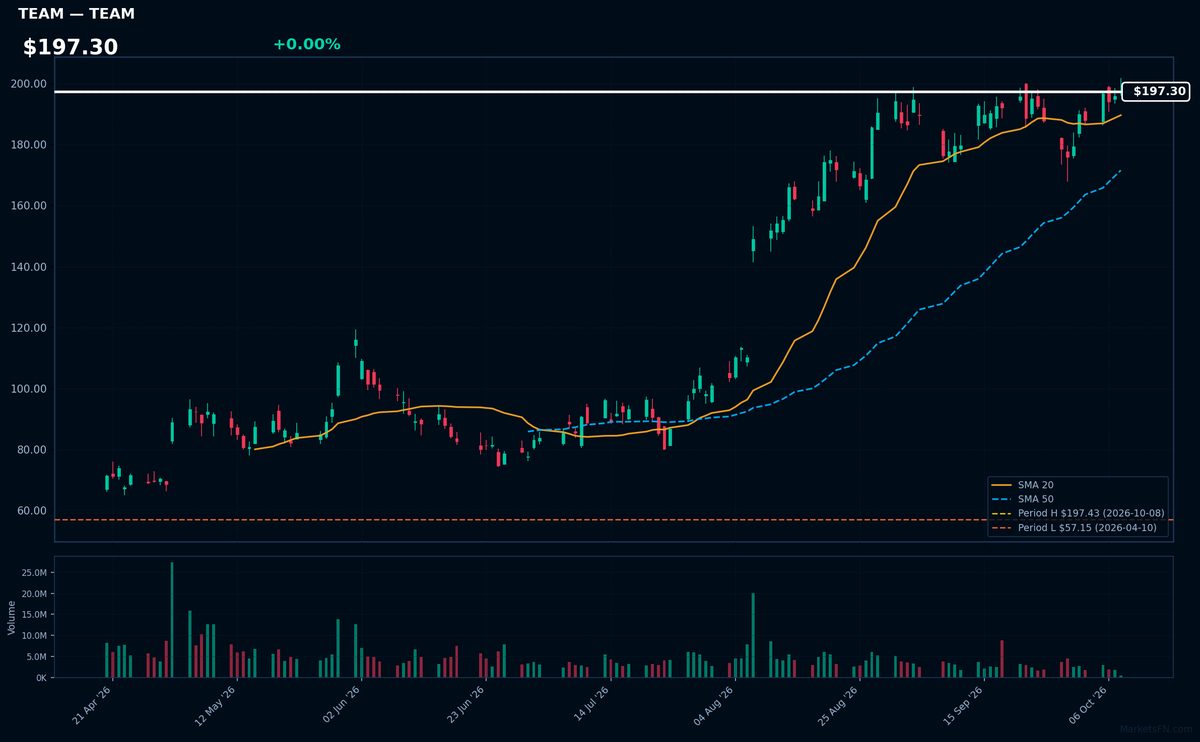
TEAM | Atlassian Corporation | Technology | Price Last: $197.43 | % Realized: +32.04% | RSI: 61.1 | % above MA200: +74.7% | Trend: Above MA20, MA50, MA200
Atlassian provides collaboration software (Jira, Confluence) for agile development teams. Investors care because its tools are mission-critical for DevOps workflows, driving sticky enterprise subscriptions with 32.0% annual returns as digital transformation accelerates.
TEAM shows bullish momentum: RSI(14) at 61.1 (neutral), price > MA20 > MA50 > MA200 in sustained uptrend, testing 52-week highs (+32.0%).
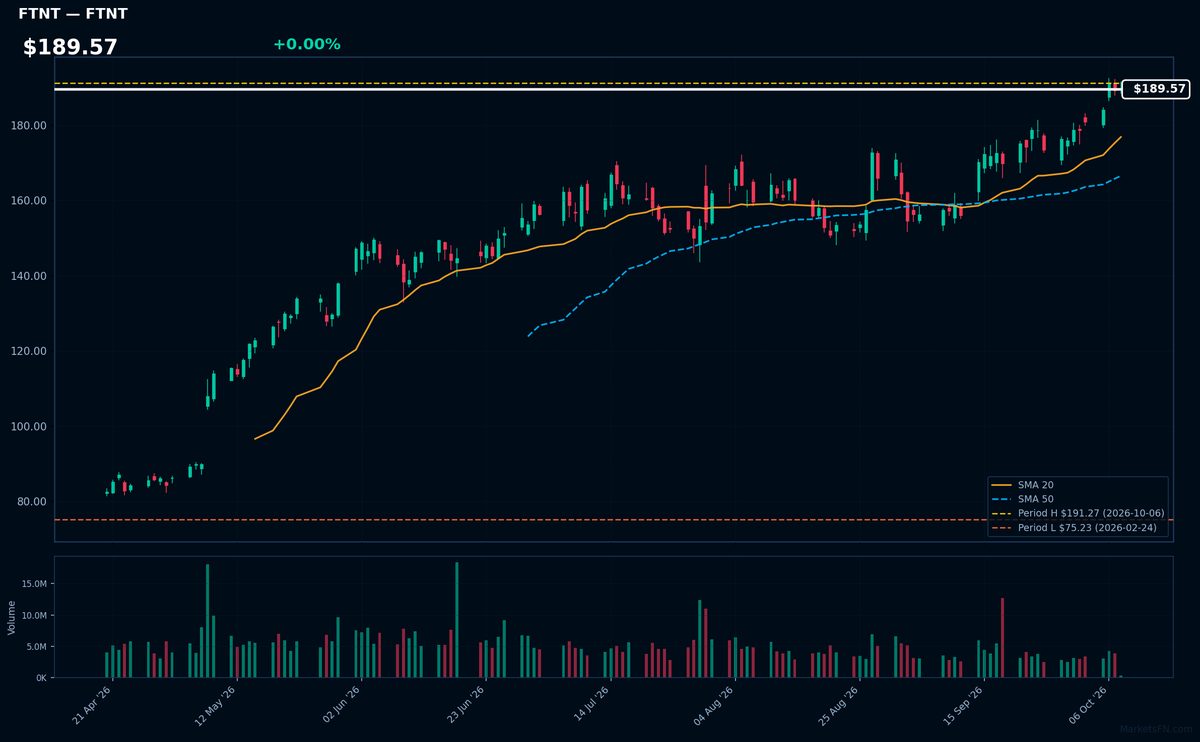
FTNT | Fortinet Inc | Technology | Price Last: $189.57 | % Realized: +119.26% | RSI: 69.1 | % above MA200: +57.0% | Trend: Above MA20, MA50, MA200
Fortinet provides cybersecurity solutions, specializing in network firewalls and threat detection. Investors should care as demand surges for enterprise security amid rising cyber threats, with FTNT's integrated platforms gaining market share in a high-growth sector.
Technically bullish: RSI(14) at 69.1 shows strong momentum, with price ($189.57) above MA20>MA50>MA200 in a 119.3% 52-week uptrend. Extreme proximity to 52W high (0.9% below) suggests breakout potential, though RSI nears overbought.
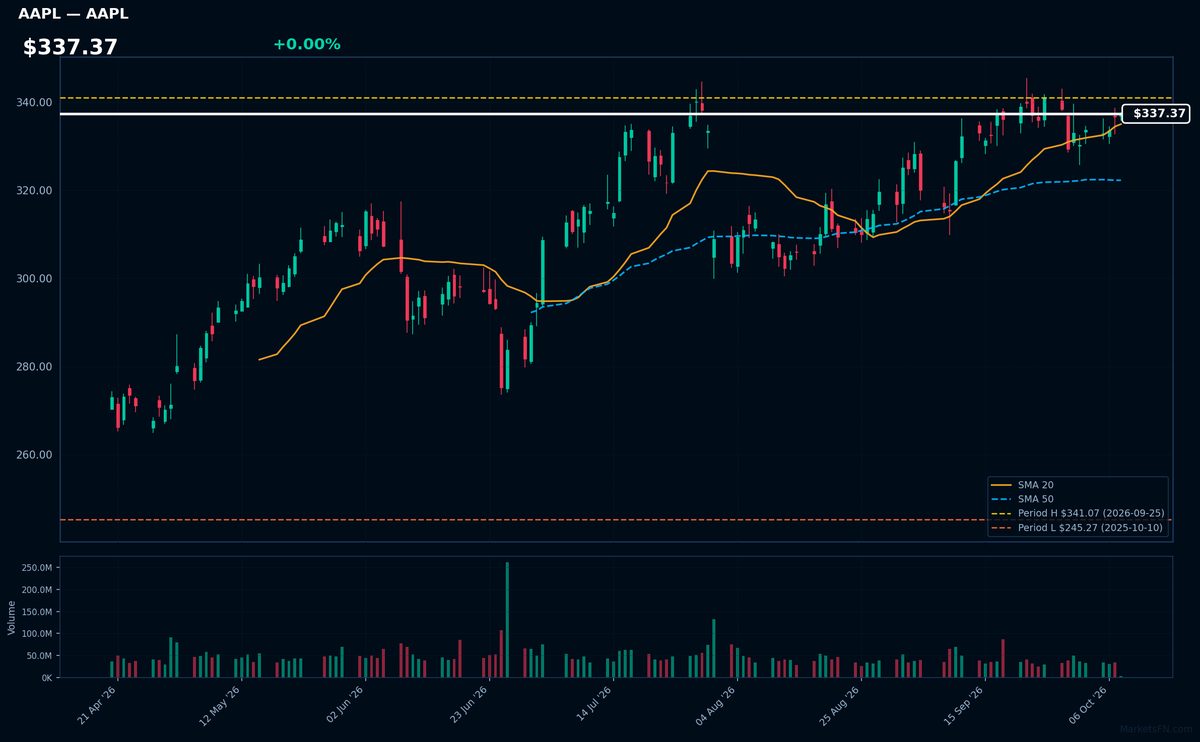
AAPL | Apple Inc | Technology | Price Last: $337.37 | % Realized: +30.73% | RSI: 58.4 | % above MA200: +16.2% | Trend: Above MA20, MA50, MA200
Apple Inc designs, manufactures, and markets smartphones, personal computers, tablets, wearables, and services including its App Store and Apple Music. Investors care because it's a cash-generating leader in premium consumer tech with 30.7% annual returns.
Technically bullish with RSI(14) at 58.4 and price > MA20 > MA50 > MA200. At 1.1% below 52-week highs, this shows sustained uptrend momentum.
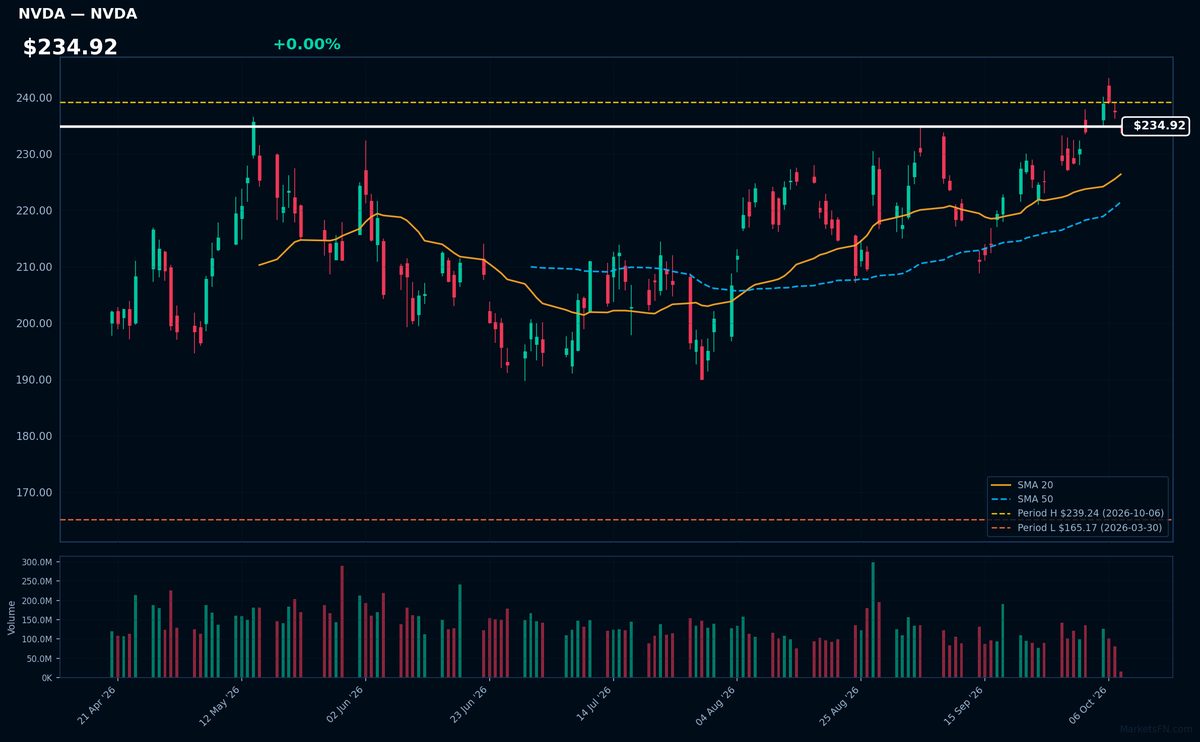
NVDA | NVIDIA Corp | Technology | Price Last: $234.90 | % Realized: +24.21% | RSI: 60.3 | % above MA200: +16.3% | Trend: Above MA20, MA50, MA200
NVIDIA designs GPUs powering AI, gaming, and data centers. Its chips are fundamental to generative AI and accelerated computing, making it a critical player in secular tech growth trends. Investors care because it dominates high-growth markets with 80%+ share in AI accelerators.
Technically bullish with RSI(14) at 60.3 and price above all key MAs (MA20 > MA50 > MA200). The 24.2% 52-week return and 1.8% proximity to highs suggest strong momentum, though RSI nears overbought territory. MA alignment confirms the sustained uptrend.
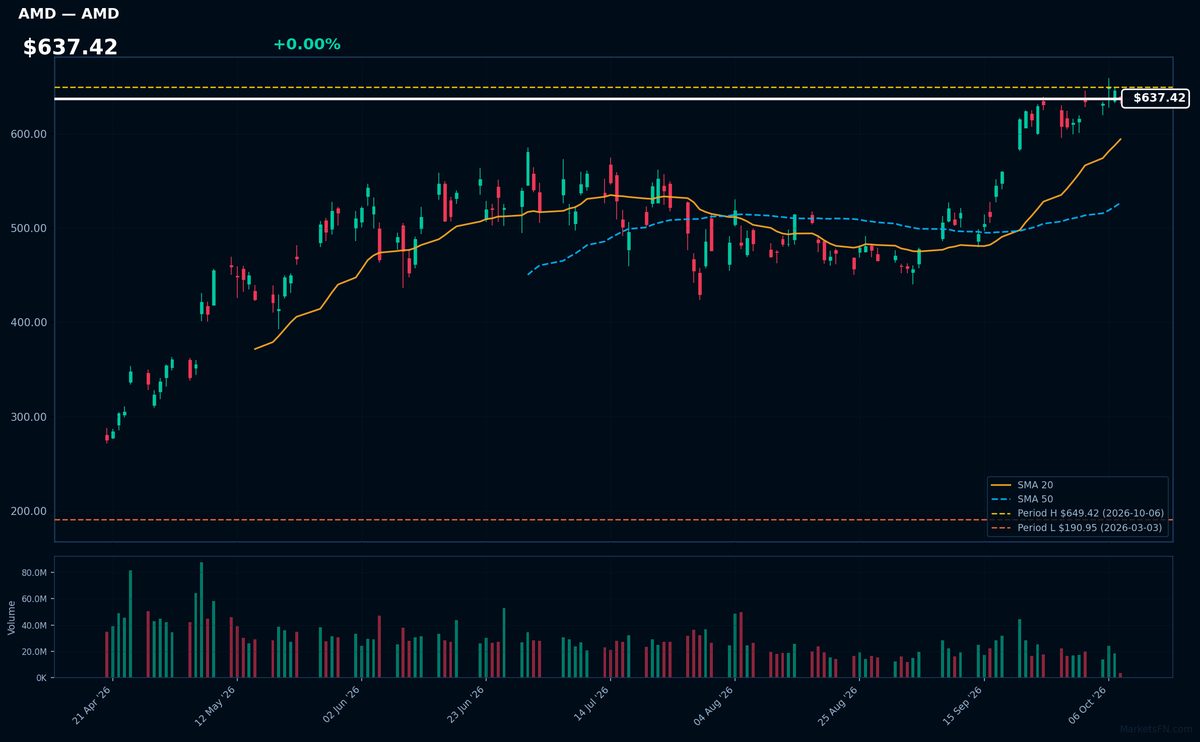
AMD | Advanced Micro Devices Inc | Technology | Price Last: $637.36 | % Realized: +170.57% | RSI: 67.2 | % above MA200: +66.2% | Trend: Above MA20, MA50, MA200
Advanced Micro Devices Inc designs high-performance computing and graphics processors competing with Nvidia and Intel. Investors care because AMD's chips power AI workloads, gaming PCs, and data centers — markets with explosive growth potential as computing demands accelerate globally.
AMD shows bullish momentum with RSI(14) at 67.2 and price above all key MAs (MA20 > MA50 > MA200). The stock sits 1.9% below its 52-week high after gaining 170.6% annually, suggesting sustained uptrend strength rather than overextension. Watch for breakout confirmation near all-time highs.
📉 Nearest to 52-Week Low
Sectors represented: Communication Services (2), Consumer Cyclical (1), Industrials (1), Healthcare (1)
| Ticker | Company | Sector | Price Last | % Realized | 52-Week Low Date | RSI | % above MA200 | Trend |
|---|---|---|---|---|---|---|---|---|
| CMCSA | Comcast Corp | Communication Services | $20.93 | -27.40% | 2026-10-08 | 23.0 | -21.2% | Below MA20, MA50, MA200 |
| LULU | Lululemon Athletica inc | Consumer Cyclical | $91.78 | -47.50% | 2026-10-08 | 31.4 | -35.6% | Below MA20, MA50, MA200 |
| CPRT | Copart, Inc | Industrials | $26.64 | -40.71% | 2026-10-07 | 30.6 | -19.9% | Below MA20, MA50, MA200 |
| CHTR | Charter Communications Inc | Communication Services | $107.35 | -60.87% | 2026-10-07 | 28.4 | -37.9% | Below MA20, MA50, MA200 |
| IDXX | Idexx Laboratories, Inc | Healthcare | $511.29 | -18.83% | 2026-09-11 | 42.9 | -12.5% | Below MA20, MA50, MA200 |
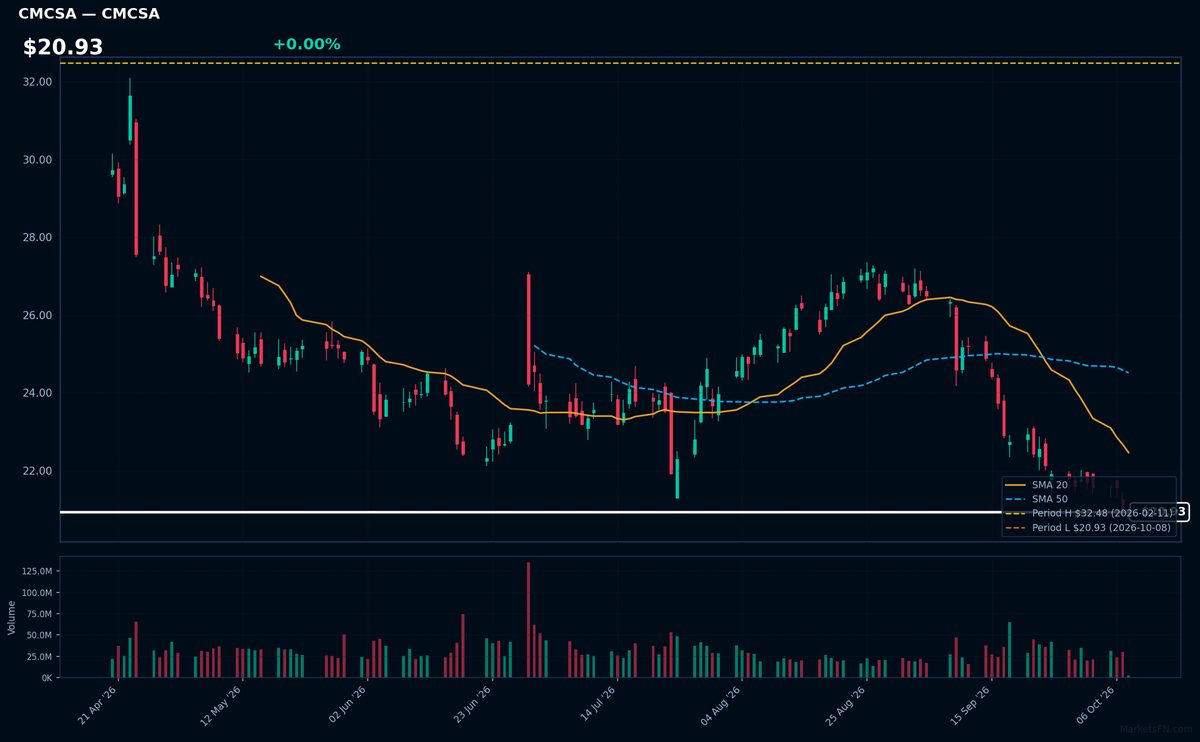
CMCSA | Comcast Corp | Communication Services | Price Last: $20.93 | % Realized: -27.40% | RSI: 23.0 | % above MA200: -21.2% | Trend: Below MA20, MA50, MA200
Comcast Corp (CMCSA) operates as a global media and technology conglomerate, providing broadband, video, wireless, and streaming services through Xfinity, NBCUniversal, and Sky. Investors watch it for its infrastructure-heavy cash flows and exposure to evolving connectivity demands.
At $20.93, CMCSA shows extreme technical weakness: RSI(14) at 23.0 (oversold), with a bearish MA alignment (price < MA20 < MA50 < MA200) and -27.4% 52-week return. Testing 52-week low suggests critical support breach risk.
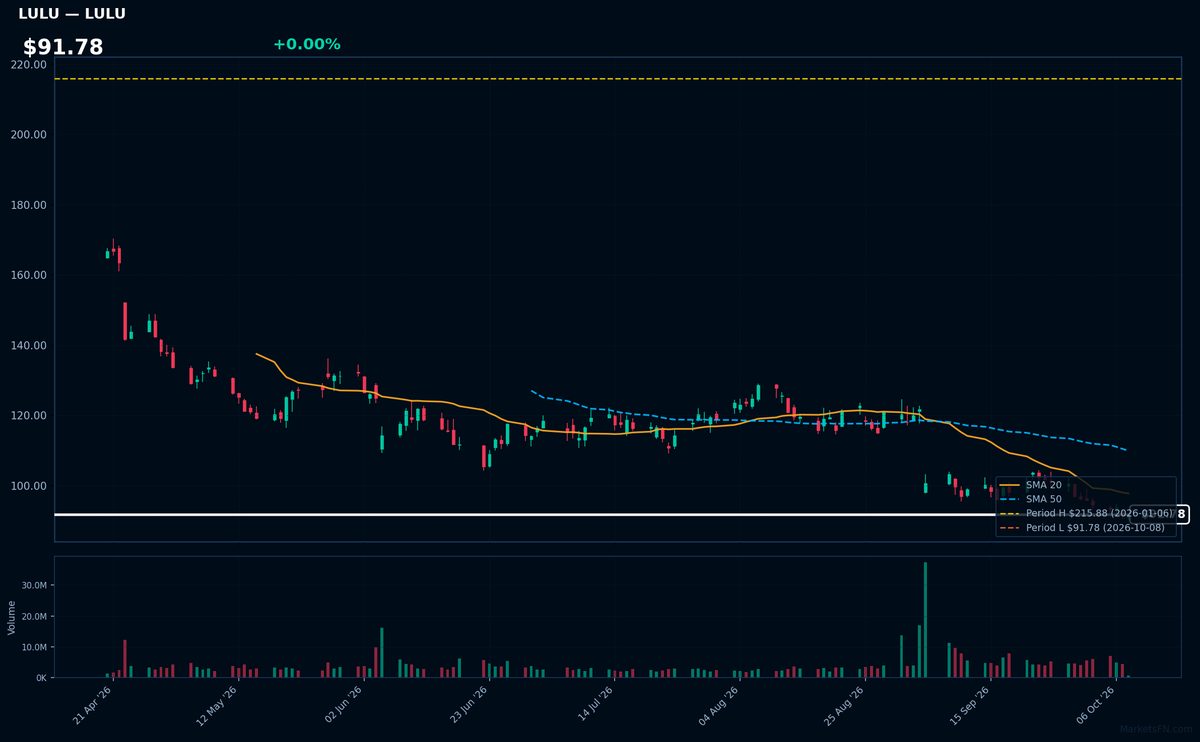
LULU | Lululemon Athletica inc | Consumer Cyclical | Price Last: $91.78 | % Realized: -47.50% | RSI: 31.4 | % above MA200: -35.6% | Trend: Below MA20, MA50, MA200
Lululemon designs premium athletic apparel and accessories, dominating the high-growth athleisure market with cult-like brand loyalty. Investors watch its pricing power and international expansion as key value drivers in a competitive space.
Technically dire: RSI at 31.4 shows oversold conditions amid a sustained downtrend (price < MA20 < MA50 < MA200). Stock tests 52-week lows after a 47.5% plunge — extreme bearish momentum warns of structural breakdown risk.
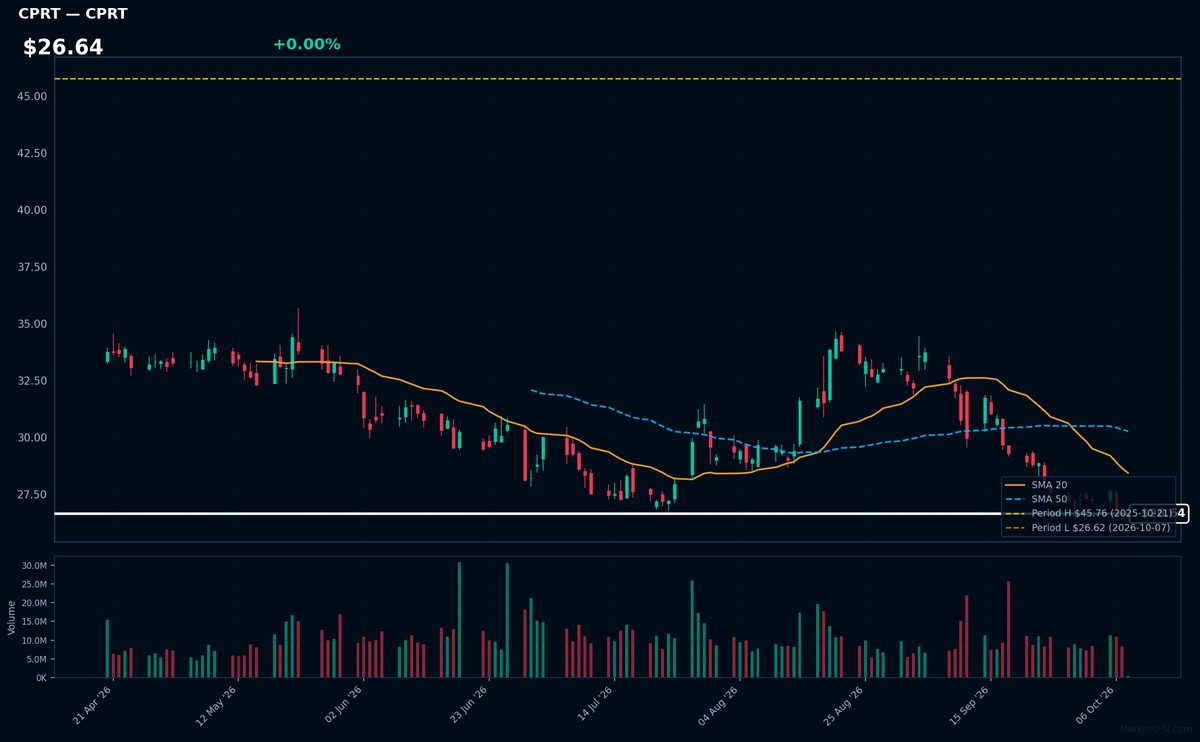
CPRT | Copart, Inc | Industrials | Price Last: $26.64 | % Realized: -40.71% | RSI: 30.6 | % above MA200: -19.9% | Trend: Below MA20, MA50, MA200
Copart operates an online vehicle auction platform, specializing in salvage and used cars for insurers, dealers, and individuals. Investors care because its asset-light model dominates a $10B+ niche with high repeat-purchase demand, though cyclical exposure to used car prices creates volatility.
Technically dire: RSI(14) at 30.6 shows oversold conditions amid a sustained downtrend (price $26.64 < MA20 < MA50 < MA200). Trading just 0.1% above 52-week lows after -40.7% annual decline signals breakdown risk, not momentum.
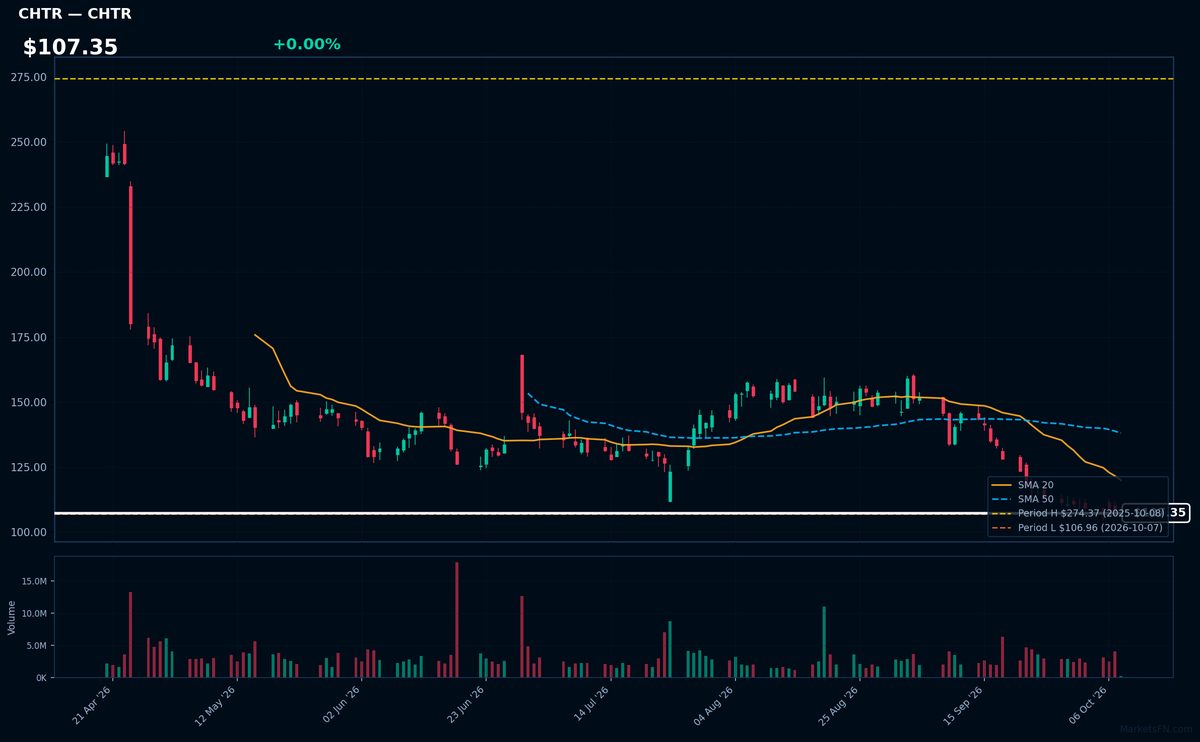
CHTR | Charter Communications Inc | Communication Services | Price Last: $107.35 | % Realized: -60.87% | RSI: 28.4 | % above MA200: -37.9% | Trend: Below MA20, MA50, MA200
Charter Communications Inc (CHTR) operates as a broadband connectivity and cable operator, providing essential internet, TV, and voice services to residential/commercial customers. Investors monitor its infrastructure-heavy model and competitive positioning in telecom amid cord-cutting trends.
CHTR shows extreme technical weakness: RSI(14) at 28.4 (oversold), with bearish MA alignment (price < MA20 < MA50 < MA200) and -60.9% 52-week return. Trading just 0.4% above 52-week lows, this signals severe downtrend pressure, not momentum.
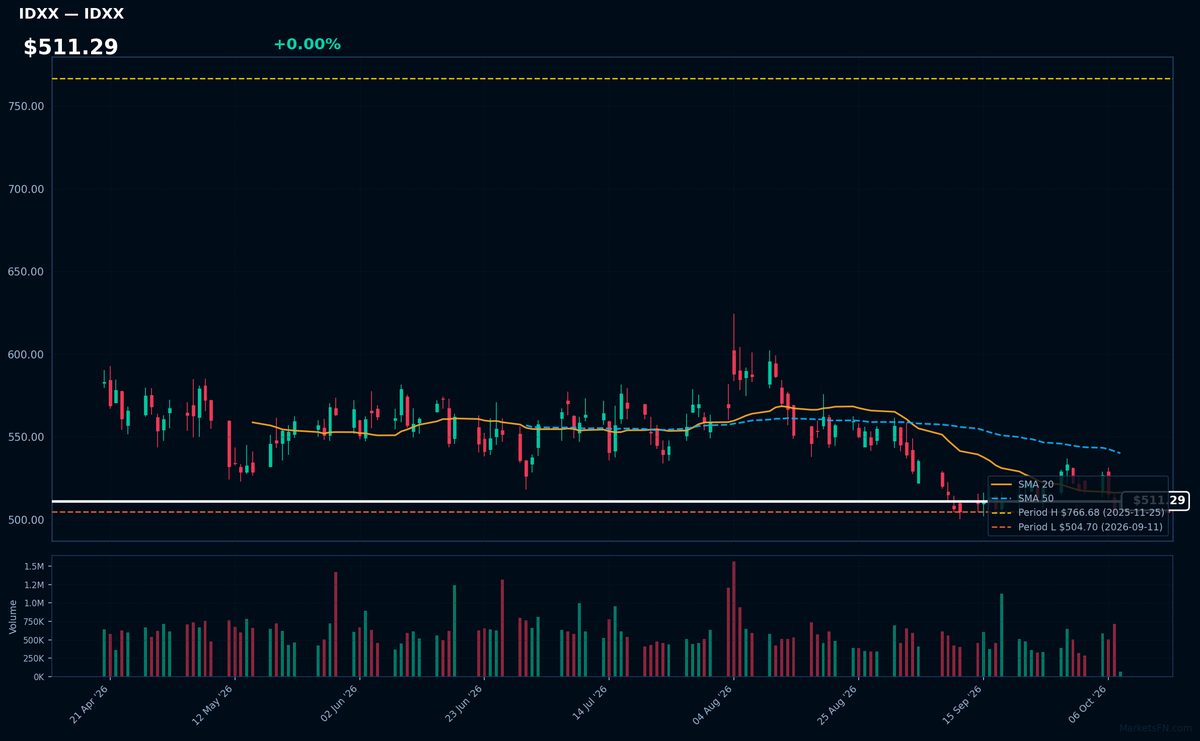
IDXX | Idexx Laboratories, Inc | Healthcare | Price Last: $511.29 | % Realized: -18.83% | RSI: 42.9 | % above MA200: -12.5% | Trend: Below MA20, MA50, MA200
Idexx Laboratories provides diagnostic and IT solutions for veterinary practices, including lab testing equipment and software. Investors care because pet healthcare spending remains resilient, creating stable demand for its high-margin consumables and services despite economic cycles.
IDXX shows bearish momentum: RSI(14) at 42.9 confirms weakening, while the sustained downtrend (price < MA20 < MA50 < MA200) and -18.8% 52-week return signal caution. Trading just 1.3% above 52-week lows, it tests critical support.
Market Commentary
The concentration of Nasdaq 100 technology stocks at 52-week extremes highlights a stark divergence in market sentiment. TEAM, FTNT, AAPL, NVDA, and AMD trading within 2% of their highs reflects persistent demand for cloud software, cybersecurity, and AI-related hardware, while CMCSA, LULU, CPRT, CHTR, and IDXX hovering near lows signals weakness in consumer discretionary and legacy telecom sectors. This bifurcation suggests investors are aggressively rewarding growth and innovation while punishing perceived structural challenges or cyclical headwinds.
Macro themes are reinforcing these trends: AI infrastructure spending continues to buoy semiconductor and software names (NVDA, AMD, TEAM), while higher interest rates pressure capital-intensive telecoms (CHTR, CMCSA) and discretionary spending weighs on retail-exposed stocks like LULU. The resilience of cybersecurity (FTNT) underscores enterprise prioritization of digital defenses despite economic uncertainty. These sector rotations align with a "risk-on" appetite for tech disruptors amid moderating inflation expectations.
Key technical levels to monitor include the 52-week highs for NVDA ($505.48) and AAPL ($198.23), as breaks above could trigger momentum buying. Conversely, LULU ($298.01 low) and IDXX ($398.76 low) must hold their current levels to avoid accelerated selling. Near-term catalysts include earnings revisions, Fed policy signals, and any shifts in AI investment trajectories that could either extend leadership or spark mean reversion.
Methodology: All 101 Nasdaq 100 constituents screened. 52-week high = highest daily close over the past 252 trading days (approx. 1 year). 52-week low = lowest daily close over the same period. Distance = (current price / extreme − 1) × 100. Technical indicators computed on up to 1 year of daily OHLCV data.
Disclaimer: For informational purposes only. Not investment advice. Past performance is not indicative of future results.