Nasdaq 100 2026 YTD Highs & Lows Radar: Microsoftoration (MSFT), PepsiCo (PEP) and more
MarketsFN Team

Nasdaq 100 2026 YTD Highs & Lows Radar: Microsoftoration (MSFT), PepsiCo (PEP) and more
Screening all 101 Nasdaq 100 constituents for stocks nearest to their 2026 year-to-date high and their 2026 YTD low. Data as of October 08, 2026. % Realized = total return since Jan 1 2026.
Legend: RSI > 70 = overbought · RSI < 30 = oversold · Green % Realized = positive YTD return · Red = negative.
📈 Nearest to 2026 High
Sectors represented: Technology (5)
| Ticker | Company | Sector | Price Last | % Realized | 2026 YTD High Date | RSI | % above MA200 | Trend |
|---|---|---|---|---|---|---|---|---|
| MSFT | Microsoft Corporation | Technology | $529.76 | +12.01% | 2026-10-07 | 68.7 | +22.1% | Above MA20, MA50, MA200 |
| PLTR | Palantir Technologies Inc | Technology | $194.12 | +15.64% | 2026-10-07 | 70.2 | +27.5% | Above MA20, MA50, MA200 |
| TEAM | Atlassian Corporation | Technology | $195.79 | +26.51% | 2026-10-05 | 62.1 | +73.2% | Above MA20, MA50, MA200 |
| AMD | Advanced Micro Devices Inc | Technology | $645.86 | +189.01% | 2026-10-06 | 66.2 | +68.4% | Above MA20, MA50, MA200 |
| NVDA | NVIDIA Corp | Technology | $237.47 | +25.75% | 2026-10-06 | 59.3 | +17.6% | Above MA20, MA50, MA200 |
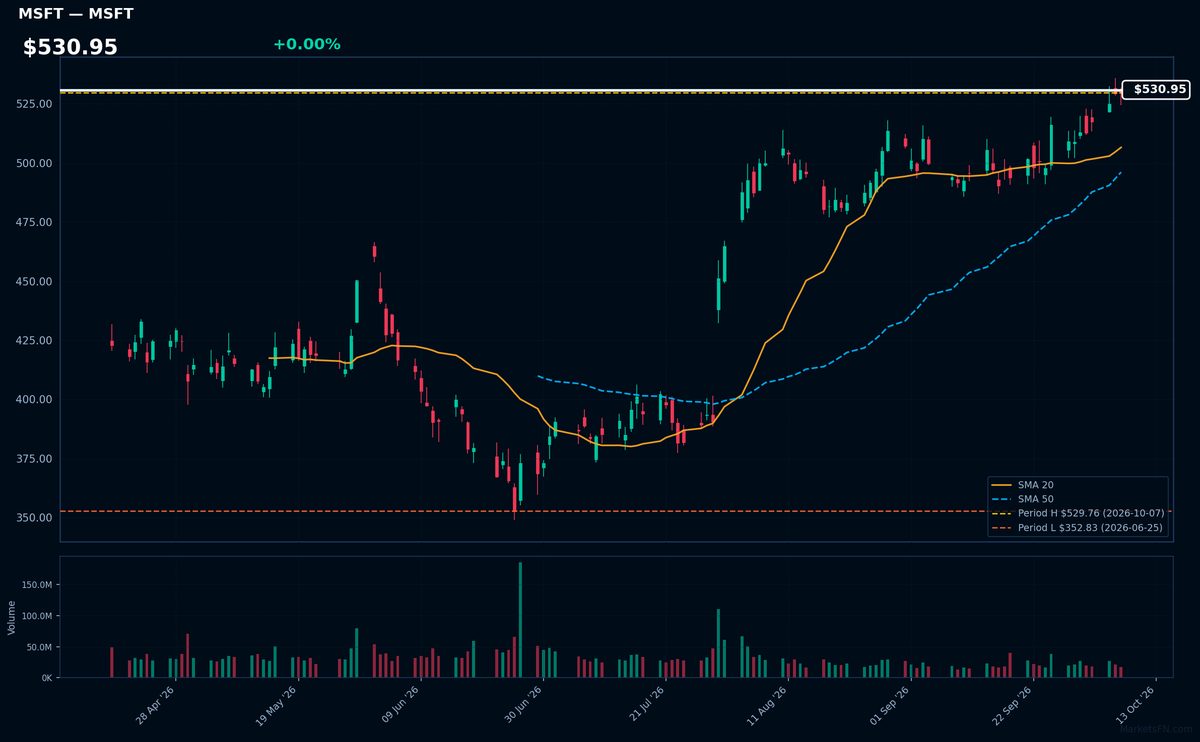
MSFT | Microsoft Corporation | Technology | Price Last: $529.76 | % Realized: +12.01% | RSI: 68.7 | % above MA200: +22.1% | Trend: Above MA20, MA50, MA200
Microsoft dominates enterprise cloud computing (Azure), productivity software (Office 365), and AI infrastructure (OpenAI partnership). Its entrenched ecosystem generates recurring revenue and positions it as a primary beneficiary of AI adoption, making it a core holding for growth-oriented investors.
Technically bullish with RSI(14) at 68.7 (approaching overbought) and price > MA20 > MA50 > MA200. The 12.0% YTD gain and 0.0% gap to YTD highs suggest strong momentum, though RSI warrants caution near 70.
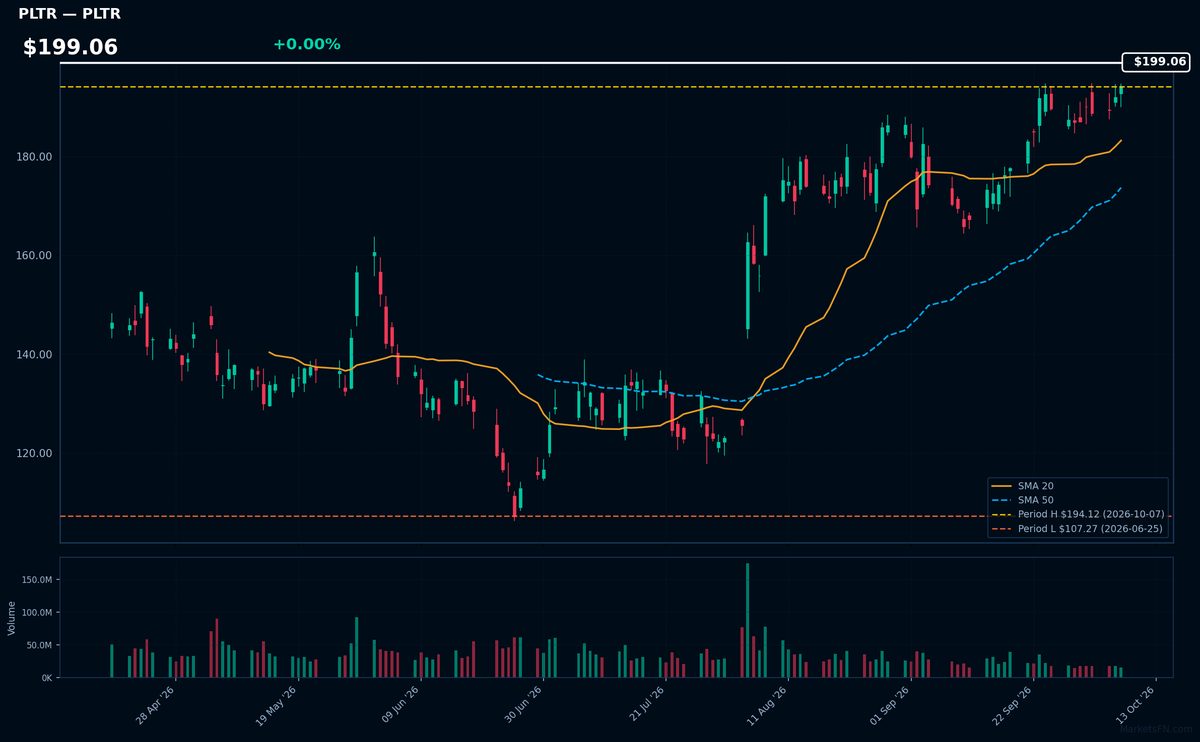
PLTR | Palantir Technologies Inc | Technology | Price Last: $194.12 | % Realized: +15.64% | RSI: 70.2 | % above MA200: +27.5% | Trend: Above MA20, MA50, MA200
Palantir develops AI-powered data analytics platforms (Gotham for government, Foundry for enterprises) that process classified and commercial datasets. Investors care because its software is mission-critical for national security and supply chain optimization, creating high switching costs and recurring revenue.
Technically overbought (RSI 70.2) but in strong uptrend (price > MA20 > MA50 > MA200). At YTD highs after 15.6% 2026 gain, suggesting momentum but near resistance.
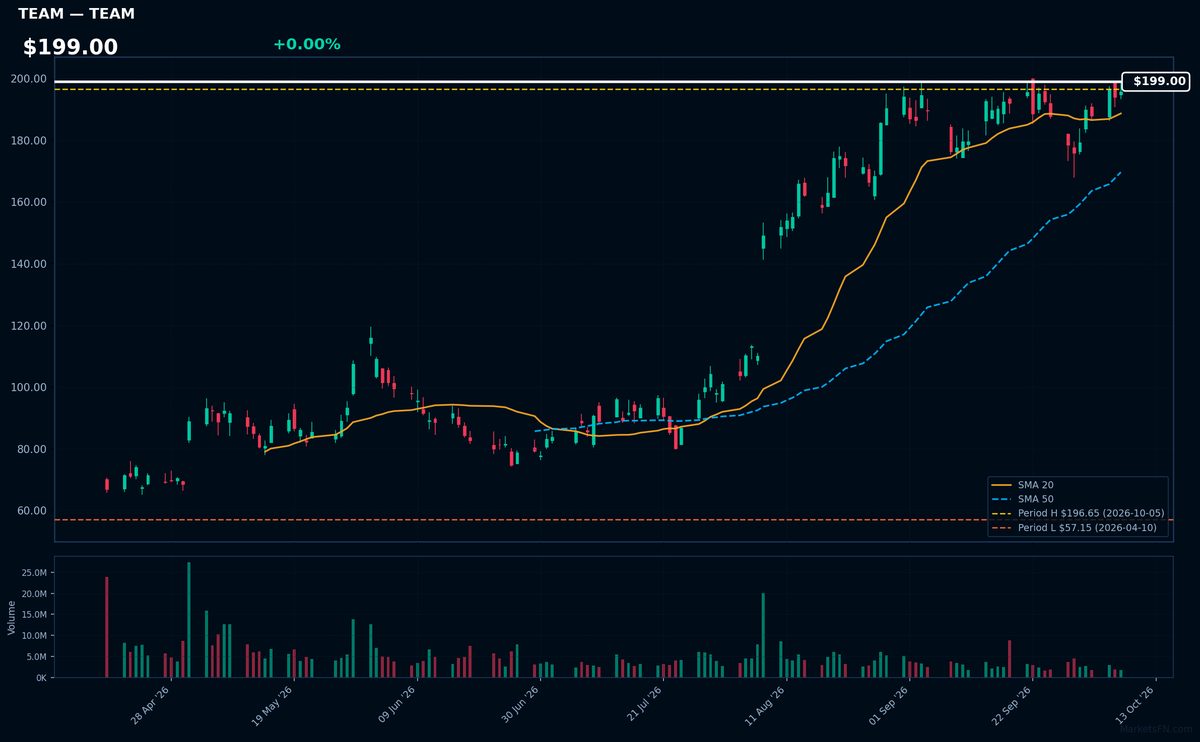
TEAM | Atlassian Corporation | Technology | Price Last: $195.79 | % Realized: +26.51% | RSI: 62.1 | % above MA200: +73.2% | Trend: Above MA20, MA50, MA200
Atlassian provides collaboration software (Jira, Confluence) for agile development teams. Investors care because its tools are mission-critical for software companies, creating sticky subscriptions with 26.5% YTD returns showing strong adoption.
Technically bullish: $199 price sits above rising MAs (20>50>200) with RSI(14) at 62.1 — near breakout territory (0.4% below YTD high). Momentum appears strong but not overbought.
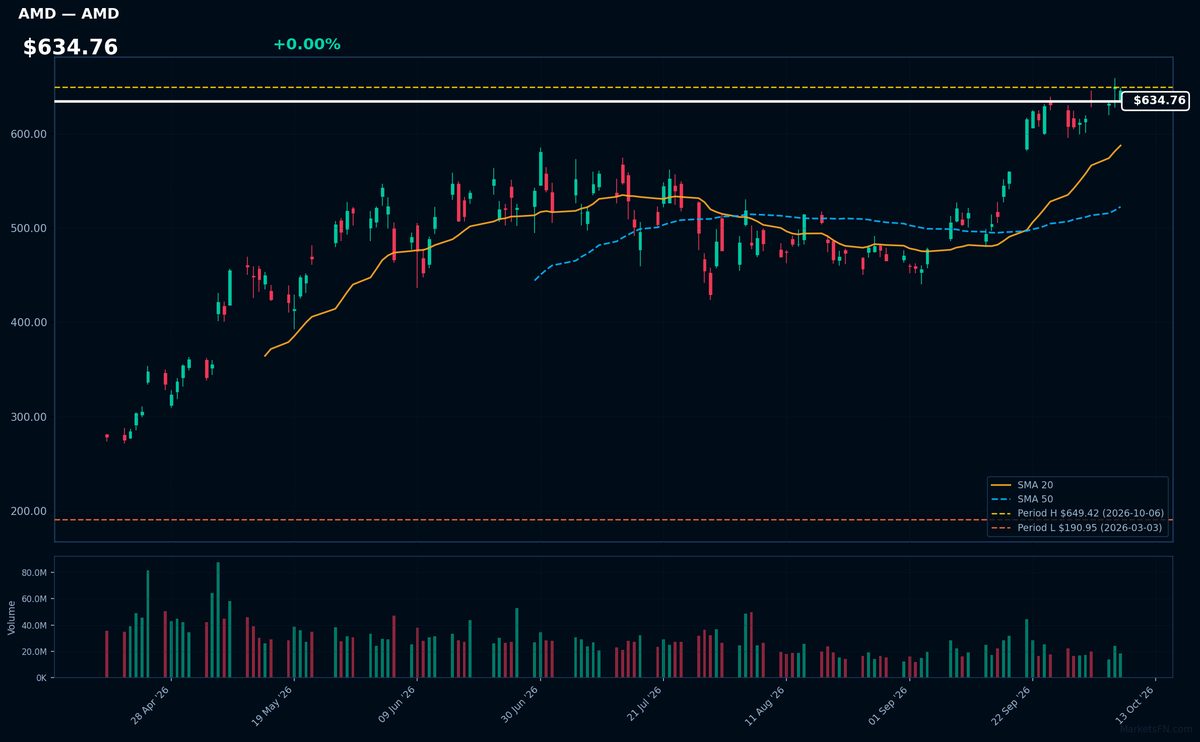
AMD | Advanced Micro Devices Inc | Technology | Price Last: $645.86 | % Realized: +189.01% | RSI: 66.2 | % above MA200: +68.4% | Trend: Above MA20, MA50, MA200
Advanced Micro Devices designs high-performance CPUs and GPUs competing directly with Nvidia and Intel. Investors care because AMD's AI-optimized chips are gaining market share in data centers and PCs, driving its 189% YTD surge as demand for AI hardware accelerates.
AMD shows bullish momentum with a 66.2 RSI (approaching overbought) and confirmed uptrend (price > MA20 > MA50 > MA200). At 0.5% below its YTD high, it's testing breakout resistance after the 189% rally — watch for either continuation or profit-taking at these extended levels.
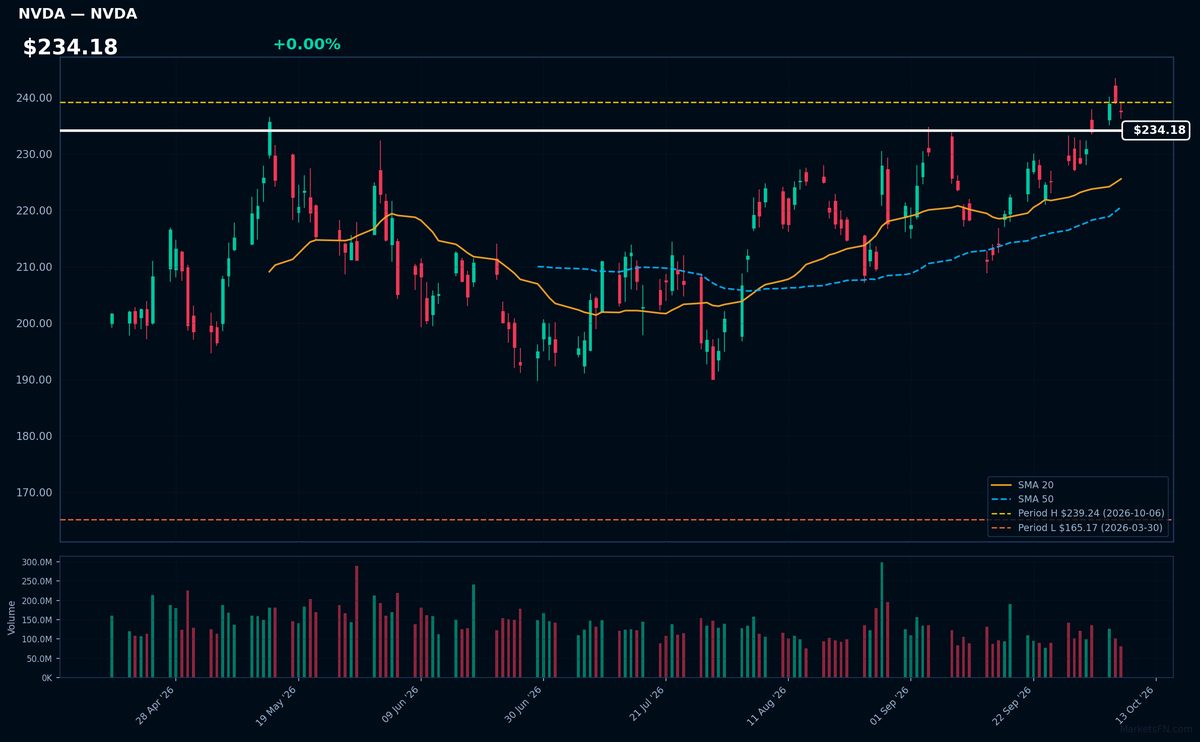
NVDA | NVIDIA Corp | Technology | Price Last: $237.47 | % Realized: +25.75% | RSI: 59.3 | % above MA200: +17.6% | Trend: Above MA20, MA50, MA200
NVIDIA dominates GPU design for AI/ML workloads, with its H100/H200 chips powering data centers globally. Its CUDA software moat and 80%+ data center GPU share make it the critical infrastructure play for generative AI adoption.
NVDA shows bullish momentum (RSI 59.3, price > MA20 > MA50 > MA200) near YTD highs (+25.7% 2026 YTD). The 0.7% proximity to record levels suggests breakout potential if buying pressure sustains.
📉 Nearest to 2026 Low
Sectors represented: Communication Services (2), Industrials (2), Consumer Defensive (1)
| Ticker | Company | Sector | Price Last | % Realized | 2026 YTD Low Date | RSI | % above MA200 | Trend |
|---|---|---|---|---|---|---|---|---|
| PEP | PepsiCo Inc | Consumer Defensive | $123.73 | -13.01% | 2026-10-07 | 36.0 | -15.7% | Below MA20, MA50, MA200 |
| CMCSA | Comcast Corp | Communication Services | $20.94 | -24.36% | 2026-10-07 | 23.3 | -21.2% | Below MA20, MA50, MA200 |
| PCAR | Paccar Inc | Industrials | $106.86 | -4.21% | 2026-10-07 | 16.9 | -11.5% | Below MA20, MA50, MA200 |
| CPRT | Copart, Inc | Industrials | $26.62 | -29.52% | 2026-10-07 | 30.6 | -19.9% | Below MA20, MA50, MA200 |
| CHTR | Charter Communications Inc | Communication Services | $106.96 | -48.89% | 2026-10-07 | 29.9 | -38.1% | Below MA20, MA50, MA200 |
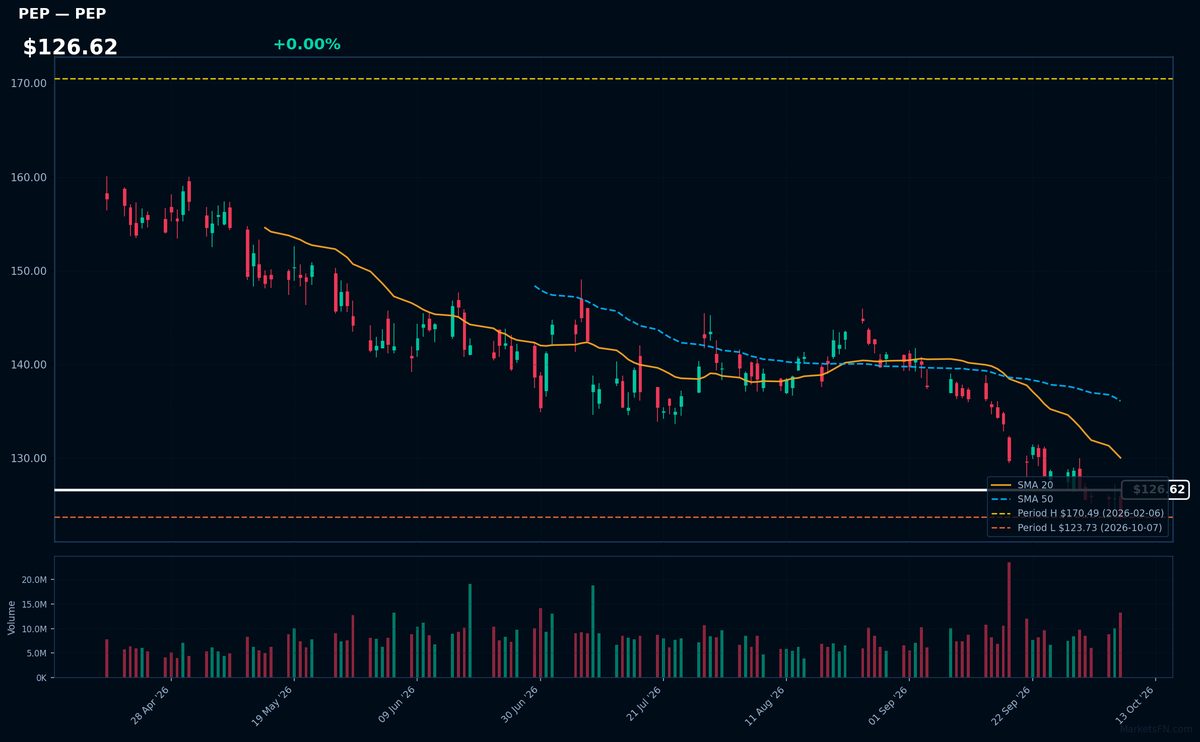
PEP | PepsiCo Inc | Consumer Defensive | Price Last: $123.73 | % Realized: -13.01% | RSI: 36.0 | % above MA200: -15.7% | Trend: Below MA20, MA50, MA200
PepsiCo Inc (PEP) operates a global food and beverage portfolio including Pepsi, Frito-Lay snacks, and Quaker foods, generating stable cash flows from essential consumer goods. Investors care for its defensive positioning and reliable dividends in volatile markets.
PEP shows severe technical weakness: RSI(14) at 36.0 (nearing oversold) with bearish MA alignment (price < MA20 < MA50 < MA200). Down 13.0% YTD and testing 2026 lows, this signals sustained downtrend, not momentum or strength.
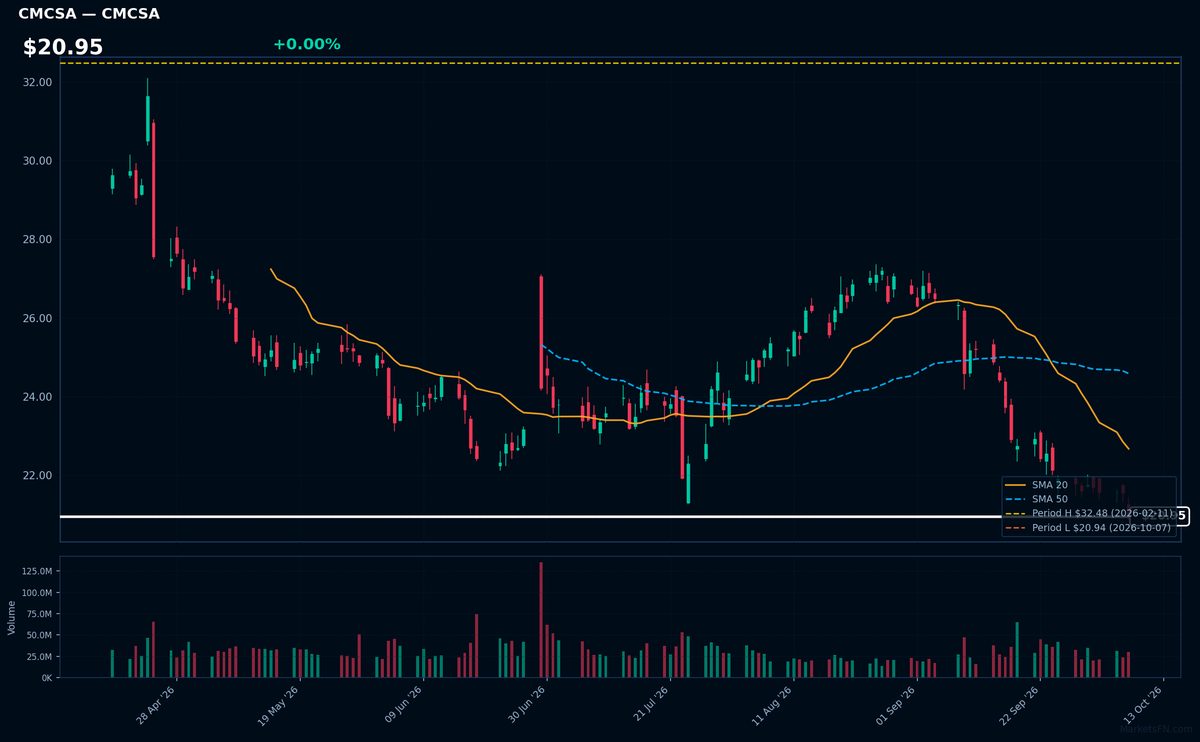
CMCSA | Comcast Corp | Communication Services | Price Last: $20.94 | % Realized: -24.36% | RSI: 23.3 | % above MA200: -21.2% | Trend: Below MA20, MA50, MA200
Comcast Corp operates cable/internet networks and media assets (NBCUniversal, Sky). Investors care for its cash-generating broadband monopoly and content library, though cord-cutting pressures persist.
Technically dire: RSI(14) at 23.3 (oversold) with bearish MA alignment (price < MA20 < MA50 < MA200). Testing YTD lows after -24.4% YTD decline — clear warning sign.
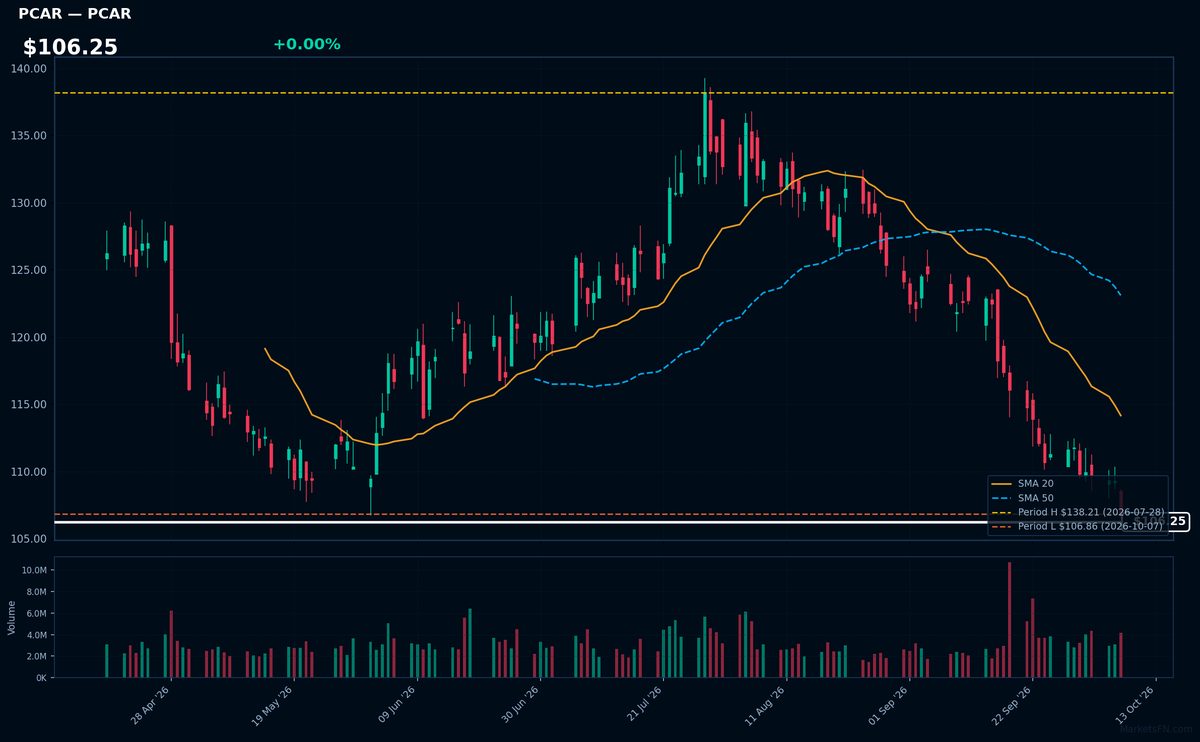
PCAR | Paccar Inc | Industrials | Price Last: $106.86 | % Realized: -4.21% | RSI: 16.9 | % above MA200: -11.5% | Trend: Below MA20, MA50, MA200
Paccar manufactures heavy-duty trucks (Peterbilt, Kenworth) and provides financial services. Investors care because its cyclical business offers exposure to freight demand, infrastructure spending, and replacement cycles in North America/Europe, with pricing power from premium brands.
Technically concerning: RSI(14) at 16.9 (severely oversold), trading 0.0% above 2026 YTD lows (-4.2% YTD) with mixed MA alignment (below MA20/MA50/MA200). Tests major support.
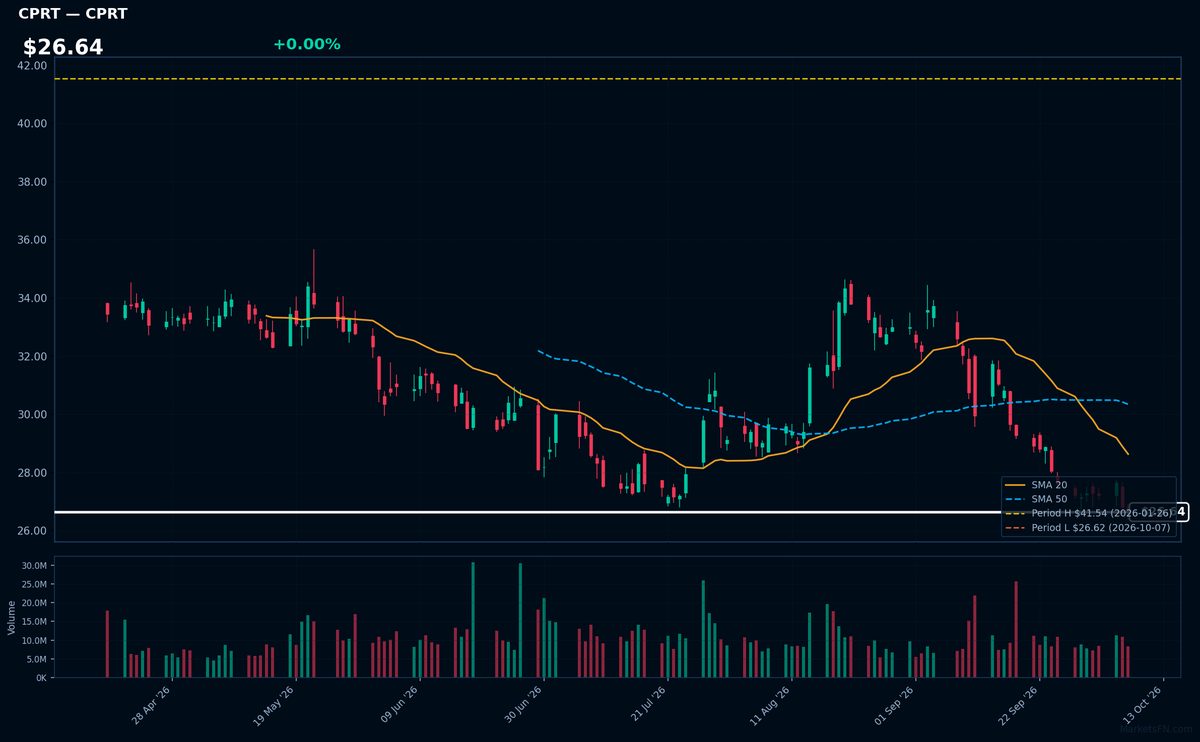
CPRT | Copart, Inc | Industrials | Price Last: $26.62 | % Realized: -29.52% | RSI: 30.6 | % above MA200: -19.9% | Trend: Below MA20, MA50, MA200
Copart operates an online vehicle auction platform, specializing in salvage and used cars for insurers, dealers, and individuals. Investors watch its asset-light model and pricing power in the $100B+ global used vehicle market, where digital adoption is accelerating.
Technically dire: RSI(14) at 30.6 shows oversold conditions amid a sustained downtrend (price < MA20 < MA50 < MA200). Trading just 0.0% above 2026 lows after a -29.5% YTD plunge signals critical support test—a warning sign absent fundamental catalysts.
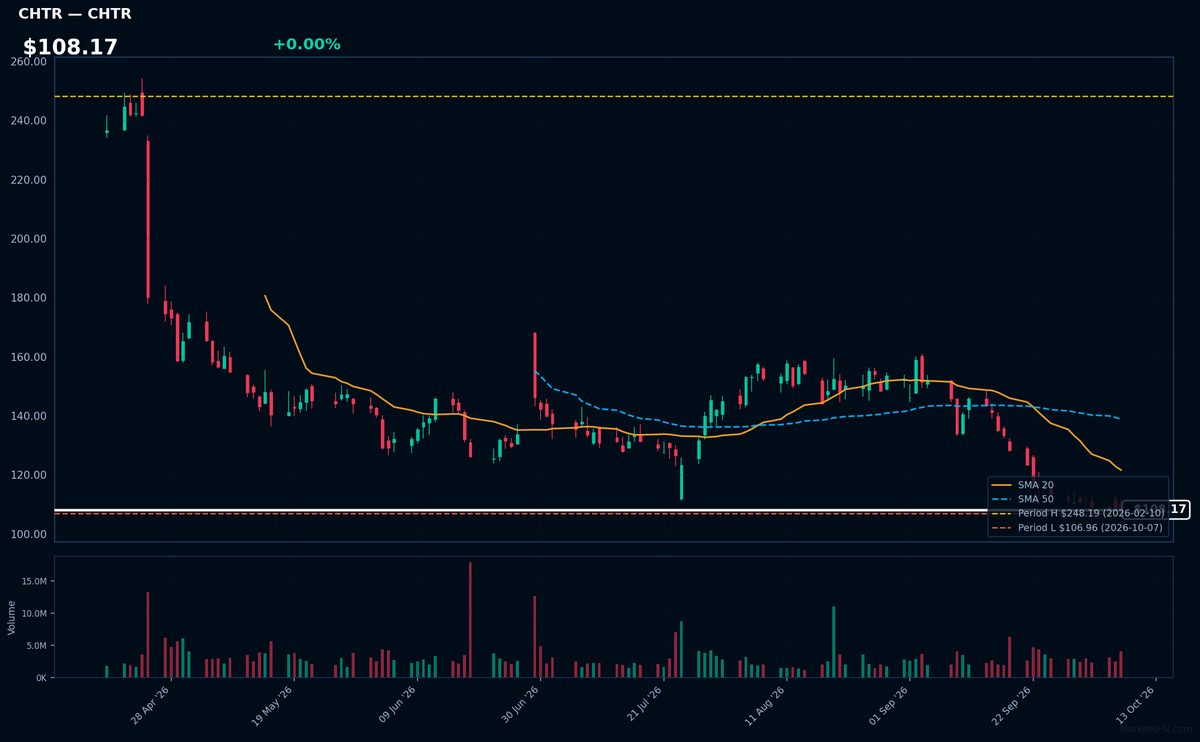
CHTR | Charter Communications Inc | Communication Services | Price Last: $106.96 | % Realized: -48.89% | RSI: 29.9 | % above MA200: -38.1% | Trend: Below MA20, MA50, MA200
Charter Communications operates as a broadband connectivity and cable operator, providing essential internet, TV, and voice services to residential/commercial customers. Investors care due to its infrastructure-heavy, recurring-revenue model in an increasingly digital economy, though heavy debt and cord-cutting pose risks.
Technically, CHTR shows severe weakness: RSI(14) at 29.9 (oversold) with bearish MA alignment (price < MA20 < MA50 < MA200) and -48.9% YTD decline. Testing 2026 lows suggests breakdown risk, not momentum.
Market Commentary
The Nasdaq 100's 2026 extremes reveal a stark divergence between high-flying tech stocks and lagging consumer/industrial names. Microsoft (MSFT), Palantir (PLTR), Atlassian (TEAM), AMD, and NVIDIA (NVDA) are all within -0.7% of their 2026 highs, demonstrating sustained demand for AI infrastructure, cloud computing, and enterprise software. Meanwhile, PepsiCo (PEP), Comcast (CMCSA), Paccar (PCAR), Copart (CPRT), and Charter (CHTR) languish at their 2026 lows, reflecting weaker performance in consumer staples, media, and transportation sectors.
This bifurcation underscores how AI adoption and digital transformation continue to dominate capital flows, with semiconductor (AMD, NVDA) and data analytics (PLTR) firms benefiting from hyperscaler spending. The underperformance of traditional sectors suggests persistent inflation pressures and cyclical headwinds are weighing on discretionary spending and advertising-dependent businesses. Monetary policy expectations and corporate AI capex commitments remain key macro drivers.
Investors should monitor hyperscaler earnings for cloud/AI spending trends, particularly Azure (MSFT) and CUDA platform (NVDA) updates. Any rotation toward value sectors would require evidence of Fed easing or improved consumer resilience. Traders near extremes should watch for mean-reversion signals in stretched tech valuations versus contrarian opportunities in oversold dividend payers like PEP (2.9% yield). Semiconductor inventory cycles and AI monetization timelines remain critical micro catalysts.
Methodology: All 101 Nasdaq 100 constituents screened. Close prices downloaded from 2026-01-01. Period high = highest close since Jan 1 2026; period low = lowest close since Jan 1 2026. Distance = (current price / period extreme − 1) × 100. Technical indicators computed on up to 1 year of daily OHLCV data.
Disclaimer: For informational purposes only. Not investment advice. Past performance is not indicative of future results.