Nasdaq 100 2026 YTD Highs & Lows Radar: Microsoftoration (MSFT), Comcast (CMCSA) and more
MarketsFN Team

Nasdaq 100 2026 YTD Highs & Lows Radar: Microsoftoration (MSFT), Comcast (CMCSA) and more
Screening all 101 Nasdaq 100 constituents for stocks nearest to their 2026 year-to-date high and their 2026 YTD low. Data as of September 28, 2026. % Realized = total return since Jan 1 2026.
Legend: RSI > 70 = overbought · RSI < 30 = oversold · Green % Realized = positive YTD return · Red = negative.
📈 Nearest to 2026 High
Sectors represented: Technology (3), Communication Services (1), Healthcare (1)
| Ticker | Company | Sector | Price Last | % Realized | 2026 YTD High Date | RSI | % above MA200 | Trend |
|---|---|---|---|---|---|---|---|---|
| MSFT | Microsoft Corporation | Technology | $516.17 | +9.14% | 2026-09-25 | 55.5 | +19.5% | Above MA20, MA50, MA200 |
| AAPL | Apple Inc | Technology | $341.07 | +25.85% | 2026-09-25 | 66.1 | +18.4% | Above MA20, MA50, MA200 |
| AMD | Advanced Micro Devices Inc | Technology | $630.63 | +182.20% | 2026-09-25 | 67.0 | +72.0% | Above MA20, MA50, MA200 |
| WBD | Warner Bros. Discovery Inc | Communication Services | $30.86 | +8.24% | 2026-09-25 | 75.5 | +11.6% | Above MA20, MA50, MA200 |
| BIIB | Biogen Inc | Healthcare | $227.60 | +27.99% | 2026-09-25 | 63.4 | +17.2% | Above MA20, MA50, MA200 |
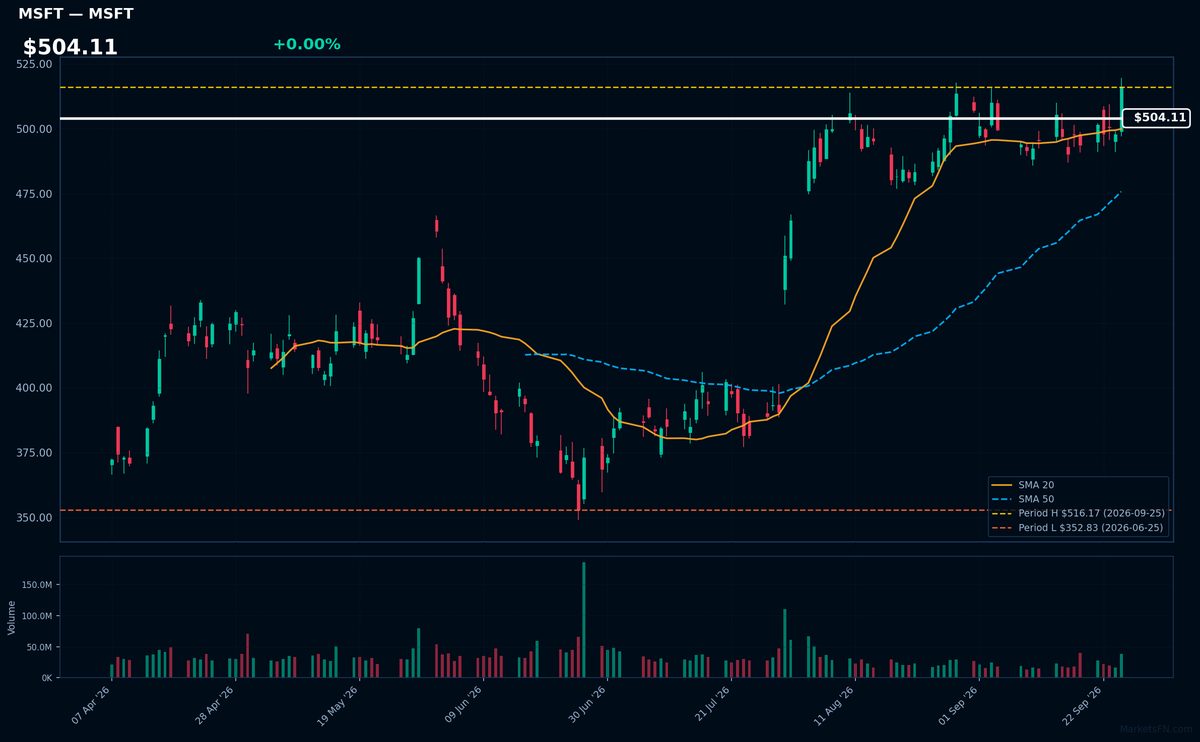
MSFT | Microsoft Corporation | Technology | Price Last: $516.17 | % Realized: +9.14% | RSI: 55.5 | % above MA200: +19.5% | Trend: Above MA20, MA50, MA200
Microsoft Corporation is a technology company that develops, licenses, and supports software, hardware, and services, including Windows, Office, Azure, and Xbox. Investors care about its dominance in productivity software and cloud computing, driving growth and profitability.
Microsoft's current technical situation indicates sustained uptrend with bullish MA alignment (price > MA20 > MA50 > MA200) and RSI(14) at 55.5, near a potential breakout level as it's 0.0% below its 2026 YTD high, suggesting momentum.
Related headlines
- Senate Democrats are grilling Meta, Amazon, Google, and Microsoft over AI tax breaks
- Microsoft Rolls Out Refreshed Copilot App as Stock Lags Megacap Peers
- Microsoft's Gates Says AI Needs Regulation
- Microsoft Copilot Is Turning Into An AI Operating System Heres What It Means For MSFT Stock, According To Oppenheimers Brian Schwartz
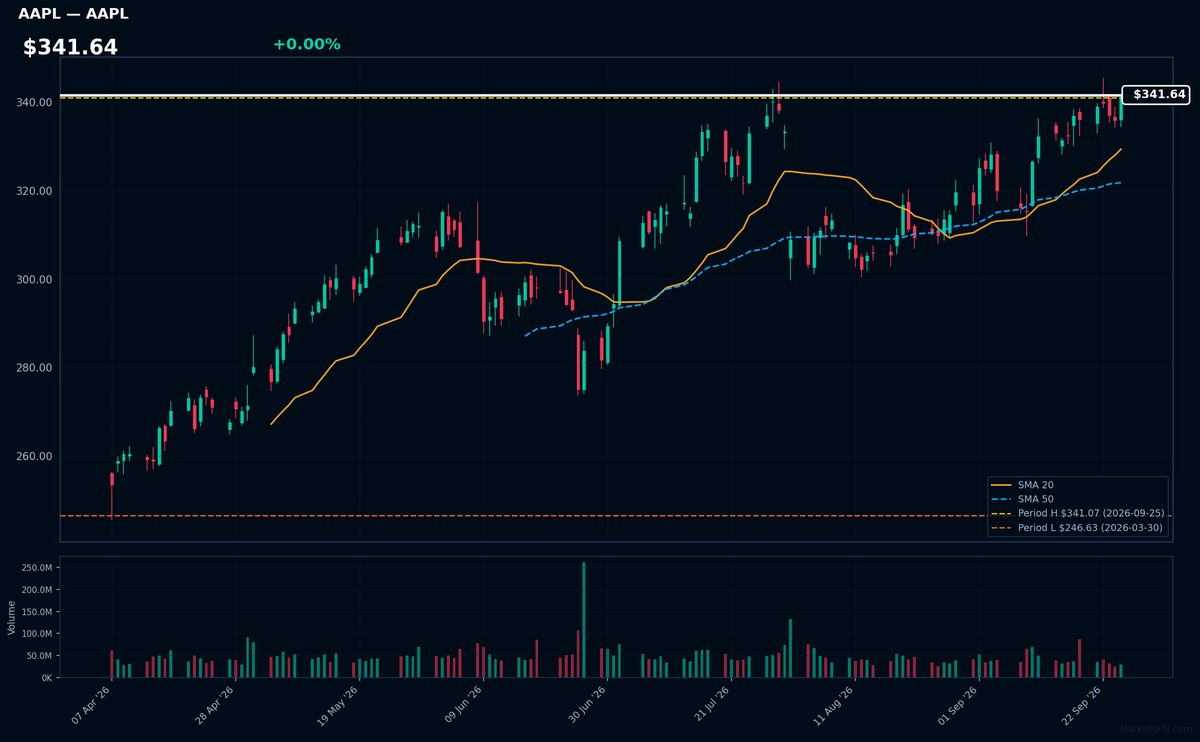
AAPL | Apple Inc | Technology | Price Last: $341.07 | % Realized: +25.85% | RSI: 66.1 | % above MA200: +18.4% | Trend: Above MA20, MA50, MA200
Apple Inc designs, manufactures, and markets consumer electronics, software, and services. Investors care about its innovative product ecosystem, services growth, and profitability. Specific areas of interest include iPhone sales, Services segment expansion, and wearables adoption.
AAPL's RSI(14) is 66.1, indicating rising momentum. The bullish MA alignment (price > MA20 > MA50 > MA200) confirms a sustained uptrend. With the stock 0.0% below its 2026 YTD high, it nears a potential breakout level, suggesting continued momentum.
Related headlines
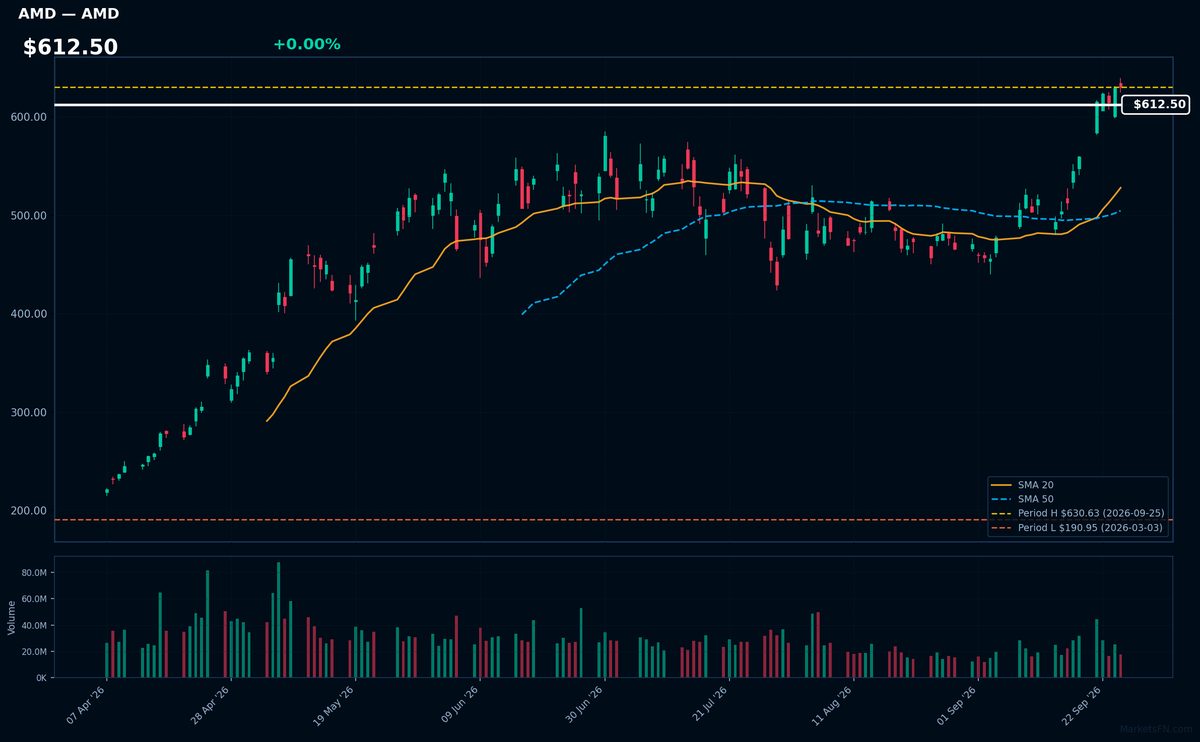
AMD | Advanced Micro Devices Inc | Technology | Price Last: $630.63 | % Realized: +182.20% | RSI: 67.0 | % above MA200: +72.0% | Trend: Above MA20, MA50, MA200
Advanced Micro Devices Inc (AMD) is a semiconductor company designing and manufacturing high-performance CPUs, GPUs, and other processing technologies crucial for gaming, data centers, and AI applications, making it a key player in the rapidly evolving tech landscape.
AMD's current technical situation indicates strong momentum: RSI(14) is 67.0, and the stock exhibits a bullish MA alignment with price > MA20 > MA50 > MA200. It's near its 2026 YTD high, up 182.2% YTD, suggesting a sustained uptrend with potential for breakout.
Related headlines
- INTC, AMD, AVGO: Chip Stocks Lead Slide As Tech Gets Hammered Amid Renewed U.S.-Iran Tensions
- Why Did AMD, HPE, MRNA Stocks Surge To 52-Week Highs Last Week?
- AMD Just Hit $1 Trillion After A Blistering 194% Surge YTD Beth Kindig Says The Dark Horse Still Has Room To Run
- Bank of America Sees AMD at $720 on CPU Demand. Anthropics $11.6 Billion Akamai Deal Is Part of Why
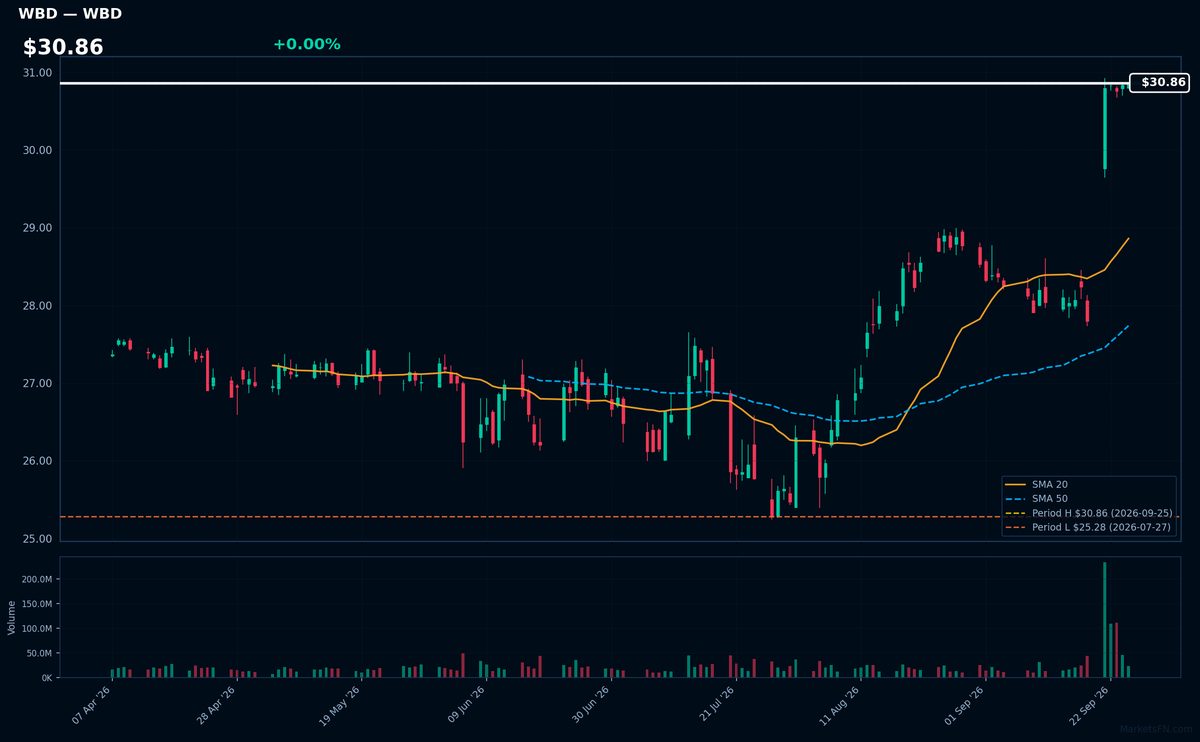
WBD | Warner Bros. Discovery Inc | Communication Services | Price Last: $30.86 | % Realized: +8.24% | RSI: 75.5 | % above MA200: +11.6% | Trend: Above MA20, MA50, MA200
Warner Bros. Discovery Inc is a media conglomerate owning major entertainment brands such as HBO, Warner Bros., and Discovery Channel, generating revenue through content creation, distribution, and advertising. Investors care about its content library and streaming growth potential.
Warner Bros. Discovery Inc shows strong technical momentum with RSI(14) at 75.5 and a bullish MA alignment (price > MA20 > MA50 > MA200). The stock is 0.0% below its 2026 YTD high, indicating a potential breakout.
Related headlines
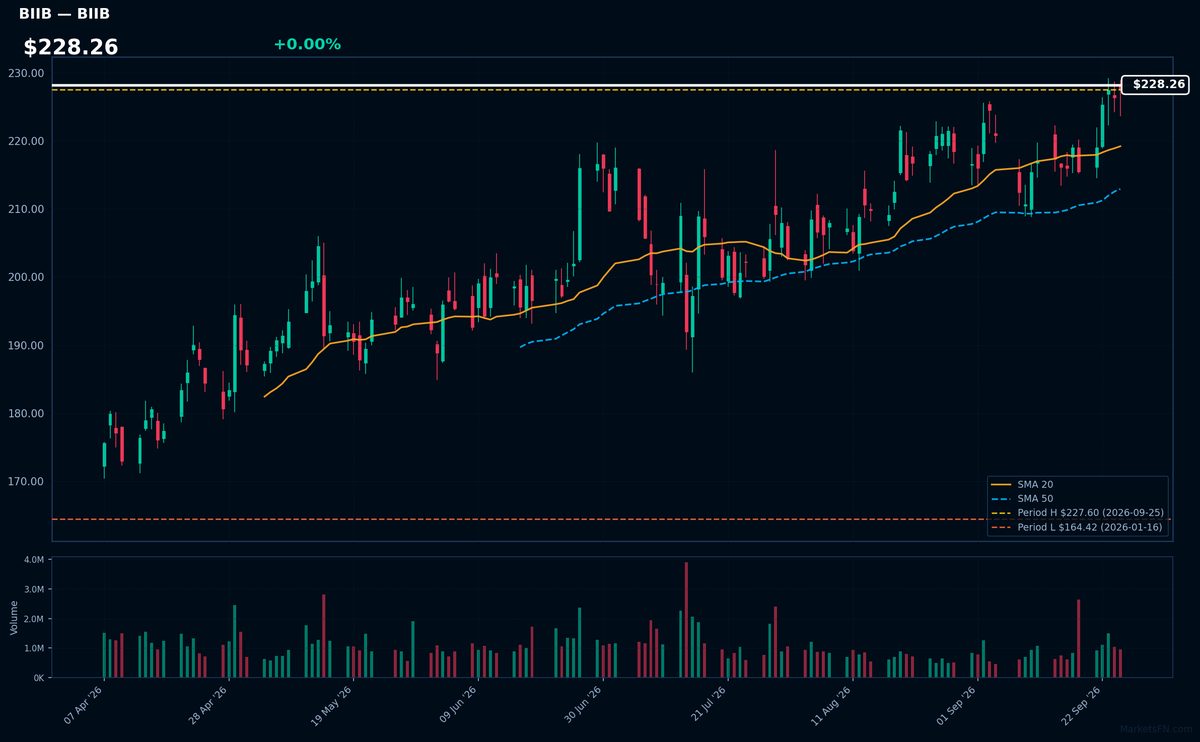
BIIB | Biogen Inc | Healthcare | Price Last: $227.60 | % Realized: +27.99% | RSI: 63.4 | % above MA200: +17.2% | Trend: Above MA20, MA50, MA200
Biogen Inc is a biotechnology company that develops treatments for neurological and neurodegenerative diseases. Investors should care because its therapies for conditions like multiple sclerosis have significant market potential and the company's pipeline impacts its growth prospects.
Biogen Inc's current technical situation indicates momentum, with an RSI(14) of 63.4 and a bullish MA alignment (price > MA20 > MA50 > MA200), suggesting a sustained uptrend. The stock is near its 2026 YTD high, 0.0% below, indicating a potential breakout.
Related headlines
- Stoke Therapeutics and Biogen Present Long-Term Clinical Data that Support the Disease-Modifying Potential of Zorevunersen, an Investigational Medicine for the Treatment of Dravet Syndrome, at the 16th European Epilepsy Congress (EEC)
- Stoke Therapeutics and Biogen to present four-year zorevunersen data at epilepsy congress
- Stoke Therapeutics and Biogen Announce Presentations of Clinical Data from Studies of Zorevunersen, an Investigational Medicine for the Treatment of Dravet Syndrome, at the 16th European Epilepsy Congress (EEC)
- Wolfe Research upgrades Biogen, AbbVie on pipeline strength and valuation
📉 Nearest to 2026 Low
Sectors represented: Communication Services (3), Utilities (2)
| Ticker | Company | Sector | Price Last | % Realized | 2026 YTD Low Date | RSI | % above MA200 | Trend |
|---|---|---|---|---|---|---|---|---|
| CMCSA | Comcast Corp | Communication Services | $21.91 | -20.86% | 2026-09-25 | 25.9 | -18.2% | Below MA20, MA50, MA200 |
| CHTR | Charter Communications Inc | Communication Services | $112.91 | -46.05% | 2026-09-25 | 29.4 | -36.2% | Below MA20, MA50, MA200 |
| TTD | Trade Desk Inc | Communication Services | $12.60 | -66.56% | 2026-09-25 | 30.9 | -45.5% | Below MA20, MA50, MA200 |
| XEL | Xcel Energy, Inc | Utilities | $69.80 | -6.53% | 2026-09-24 | 26.2 | -10.7% | Below MA20, MA50, MA200 |
| EXC | Exelon Corp | Utilities | $40.34 | -8.15% | 2026-09-24 | 23.4 | -11.7% | Below MA20, MA50, MA200 |
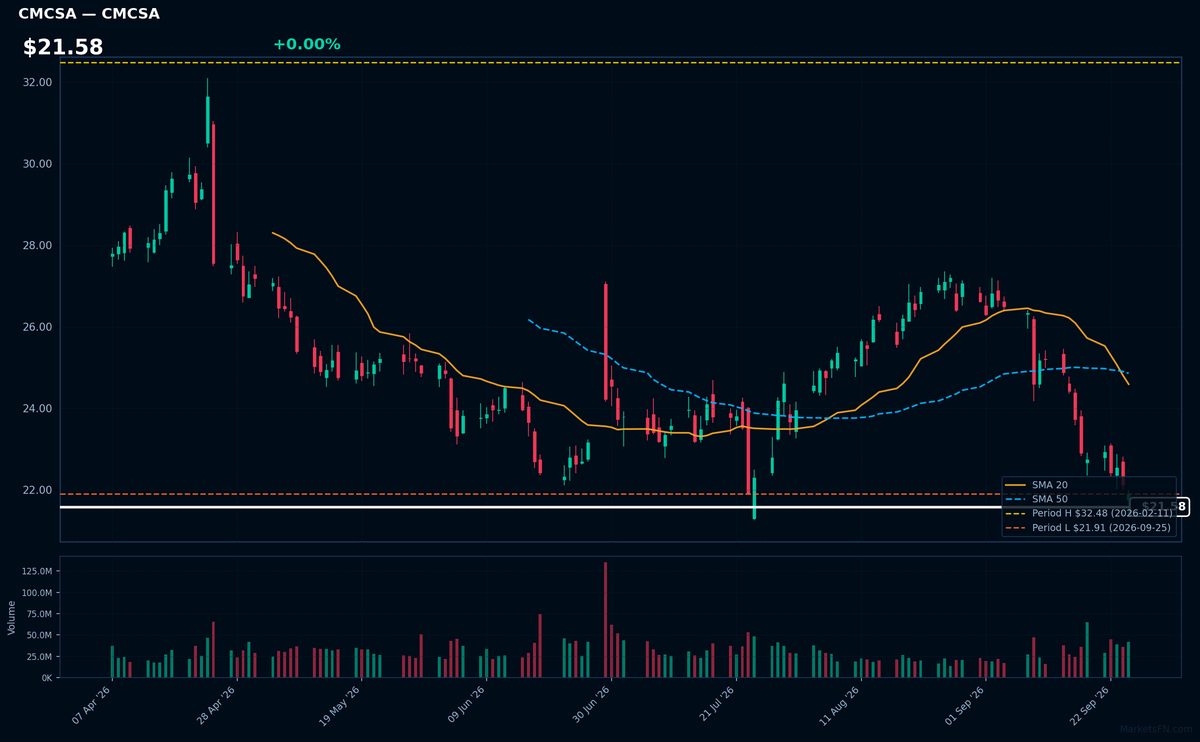
CMCSA | Comcast Corp | Communication Services | Price Last: $21.91 | % Realized: -20.86% | RSI: 25.9 | % above MA200: -18.2% | Trend: Below MA20, MA50, MA200
Comcast Corp is a media and telecommunications conglomerate providing cable television, internet, and phone services, as well as owning NBCUniversal, a major media company with film, television, and theme park assets, making it a significant player in both consumer connectivity and entertainment content.
Comcast Corp's current technical situation indicates a warning sign with an RSI(14) of 25.9, suggesting oversold conditions, and a bearish MA alignment (price < MA20 < MA50 < MA200), confirming a sustained downtrend, with the stock testing major support at its 2026 YTD low.
Related headlines
- Comcast Completes Washington County, Pennsylvania Expansion Connecting Thousands to High-Speed Internet for the First Time
- KeyBanc Revamps Comcast Stock Price Target for Rest of 2026
- KeyBanc gets bearish on Comcast as broadband competition intensifies
- Comcast Stock Is Downgraded to Sell. Why the Trouble Runs Deep.
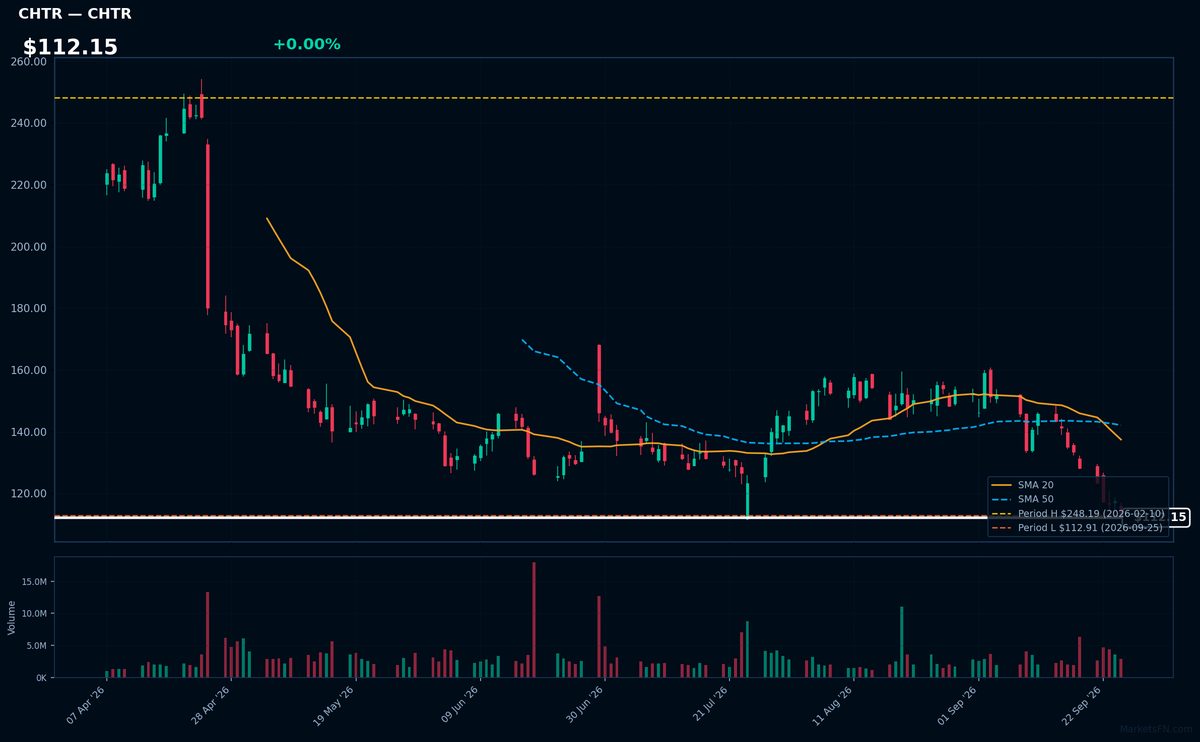
CHTR | Charter Communications Inc | Communication Services | Price Last: $112.91 | % Realized: -46.05% | RSI: 29.4 | % above MA200: -36.2% | Trend: Below MA20, MA50, MA200
Charter Communications Inc (CHTR) is a broadband connectivity company providing cable television, internet, and telephone services to residential and commercial customers. Investors care about its performance as it reflects the demand for high-speed internet and streaming services.
CHTR's technicals indicate a sustained downtrend with price ($112.15) below MA20, MA50, and MA200. The RSI(14) is 29.4, nearing oversold territory, and the stock is testing its 2026 YTD low, having fallen -46.0% YTD, suggesting a potential warning sign.
Related headlines
- An 8-Day Losing Streak Has Charter Communications Stock Down 20%
- Charter Communications Inc. Cl A stock underperforms Tuesday when compared to competitors
- Charter Declares Quarterly Cash Dividend on Series A Cumulative Redeemable Preferred Stock
- Comcast and Charter Stocks Bounce Back After Broadband Warning Sparked Selloff
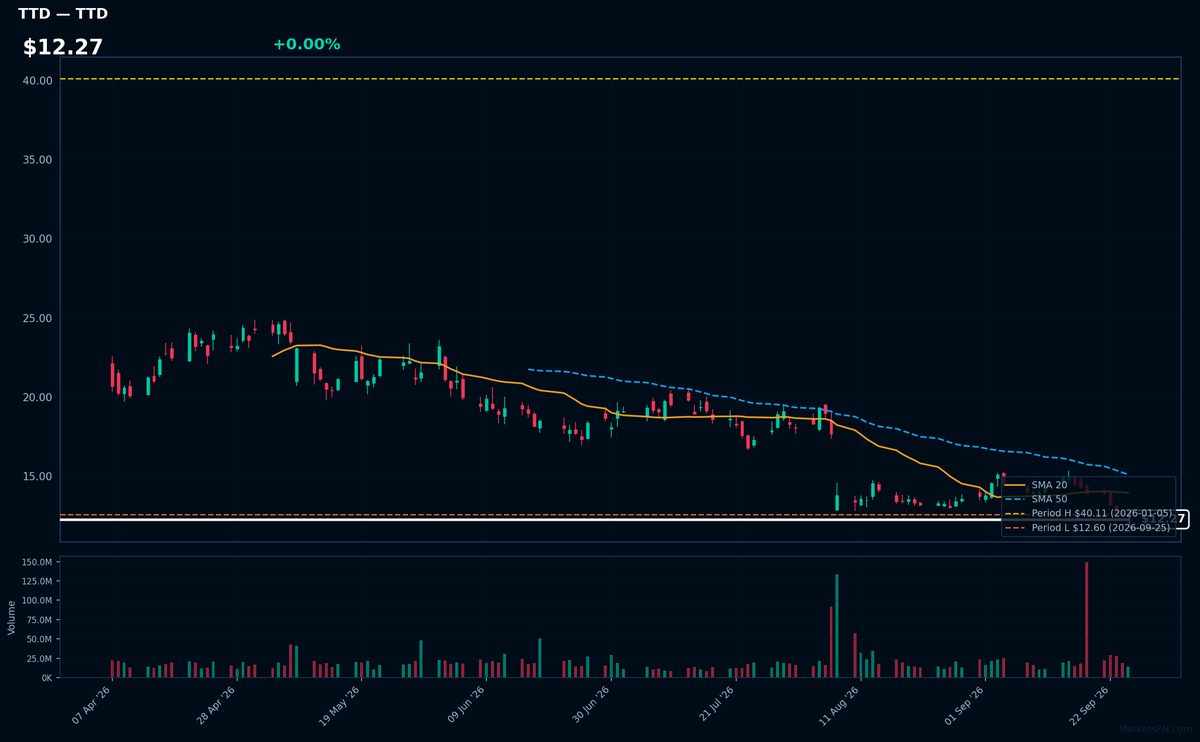
TTD | Trade Desk Inc | Communication Services | Price Last: $12.60 | % Realized: -66.56% | RSI: 30.9 | % above MA200: -45.5% | Trend: Below MA20, MA50, MA200
Trade Desk Inc operates a demand-side platform enabling advertisers to manage digital ad campaigns across various channels and formats. Investors should care because its performance reflects the digital advertising market's health and its competitive positioning within it.
The stock is in a sustained downtrend with price ($12.27) below all MAs (MA20, MA50, MA200), RSI(14) at 30.9, and is 0.0% above its 2026 YTD low, indicating a potential support test and warning sign.
Related headlines
- OptimizeRx Partners With The Trade Desk To Widen Its Healthcare Ad Network
- The Trade Desk Trades Above Wall Streets Average Target. Heres What the Cost Cuts Change
- TTD Showered Owners With Cash. The Stock Still Lagged The Market
- TTD Stock In Focus: Morningstar Sees Market Share Shrinking As Amazon, Google And Meta Ramp Up Ad Competition
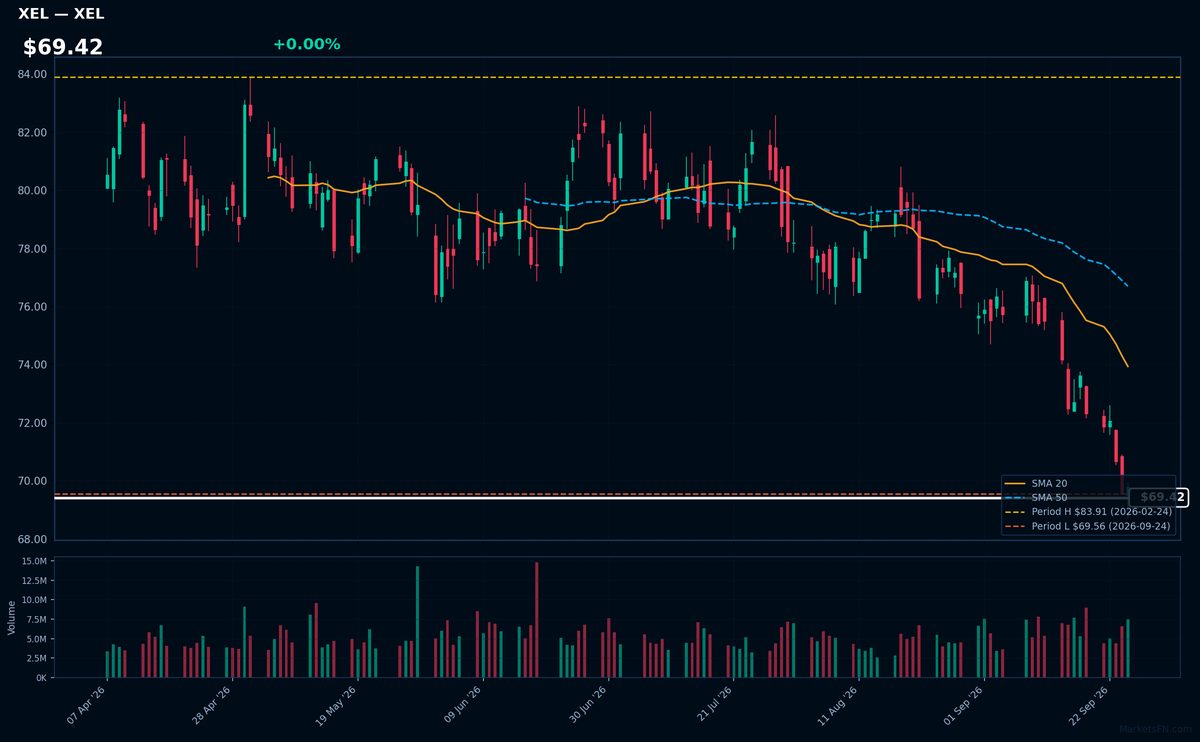
XEL | Xcel Energy, Inc | Utilities | Price Last: $69.80 | % Realized: -6.53% | RSI: 26.2 | % above MA200: -10.7% | Trend: Below MA20, MA50, MA200
Xcel Energy, Inc is a major electric and natural gas utility company serving 3.4 million customers across eight states, generating and distributing electricity from a diverse mix of sources including wind, solar, and natural gas, making it relevant to investors seeking stable, regulated energy exposure.
Xcel Energy's current technical situation is bearish, with an RSI(14) of 26.2 indicating oversold conditions, and a sustained downtrend as price ($69.42) remains below MA20, MA50, and MA200, with the stock testing major support 0.3% above its 2026 YTD low.
Related headlines
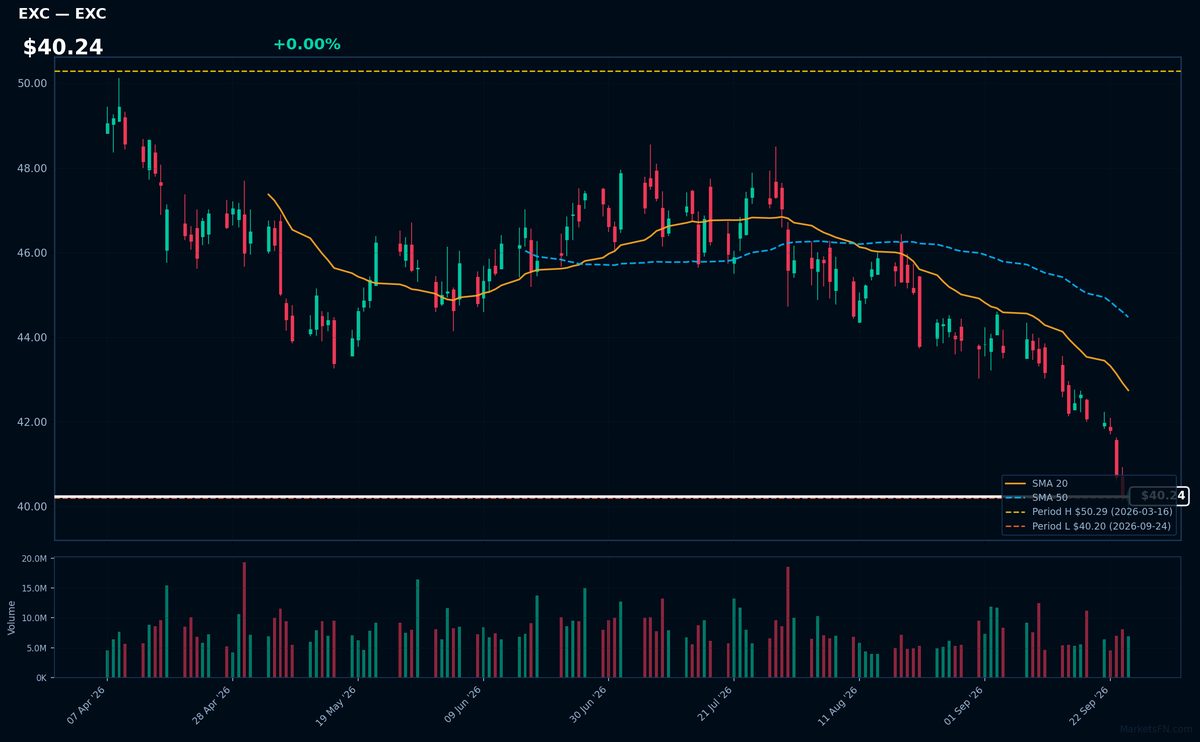
EXC | Exelon Corp | Utilities | Price Last: $40.34 | % Realized: -8.15% | RSI: 23.4 | % above MA200: -11.7% | Trend: Below MA20, MA50, MA200
Exelon Corp is a utility company that generates and distributes electricity, operating nuclear, natural gas, and renewable energy facilities. Investors should care about its stable cash flows and regulatory environment, which impact its dividend sustainability and long-term growth prospects.
Exelon Corp's technical situation is bearish, with an RSI(14) of 23.4 indicating oversold conditions. The sustained downtrend is evident as the price ($40.24) remains below MA20, MA50, and MA200, with the stock testing major support 0.3% above its 2026 YTD low.
Related headlines
Market Commentary
The Nasdaq 100 stocks listed are currently trading near their 2026 year-to-date (YTD) extremes, with some at their highs and others at their lows. Specifically, MSFT, AAPL, AMD, WBD, and BIIB are at their 2026 YTD highs, while CMCSA, CHTR, and TTD are at their 2026 YTD lows, with XEL and EXC marginally above their lows.
The technology sector themes driving these moves include the performance of major tech players and the overall market sentiment. The fact that MSFT, AAPL, and AMD are at their YTD highs suggests strong investor confidence in these tech giants. Conversely, CMCSA and CHTR being at their YTD lows may indicate concerns in the telecom and media sectors.
Investors and traders should watch the macro conditions and sector-specific news that could impact these stocks. As these stocks are near their YTD extremes, any significant deviation from their current levels could be driven by changes in market sentiment or unexpected news. Monitoring the performance of these stocks and the overall Nasdaq 100 index will be crucial in understanding the direction of the technology sector in 2026.
Methodology: All 101 Nasdaq 100 constituents screened. Close prices downloaded from 2026-01-01. Period high = highest close since Jan 1 2026; period low = lowest close since Jan 1 2026. Distance = (current price / period extreme − 1) × 100. Technical indicators computed on up to 1 year of daily OHLCV data.
Disclaimer: For informational purposes only. Not investment advice. Past performance is not indicative of future results.