Nasdaq 100 2026 YTD Highs & Lows Radar: Crowdstrike (CRWD), T-Mobile US (TMUS) and more
MarketsFN Team

Nasdaq 100 2026 YTD Highs & Lows Radar: Crowdstrike (CRWD), T-Mobile US (TMUS) and more
Screening all 101 Nasdaq 100 constituents for stocks nearest to their 2026 year-to-date high and their 2026 YTD low. Data as of October 02, 2026. % Realized = total return since Jan 1 2026.
Legend: RSI > 70 = overbought · RSI < 30 = oversold · Green % Realized = positive YTD return · Red = negative.
📈 Nearest to 2026 High
Sectors represented: Technology (4), Communication Services (1)
| Ticker | Company | Sector | Price Last | % Realized | 2026 YTD High Date | RSI | % above MA200 | Trend |
|---|---|---|---|---|---|---|---|---|
| CRWD | Crowdstrike Holdings Inc | Technology | $266.09 | +134.66% | 2026-10-01 | 69.0 | +73.3% | Above MA20, MA50, MA200 |
| WBD | Warner Bros. Discovery Inc | Communication Services | $30.95 | +8.56% | 2026-09-30 | 75.4 | +11.8% | Above MA20, MA50, MA200 |
| FTNT | Fortinet Inc | Technology | $178.72 | +129.48% | 2026-09-30 | 65.1 | +50.7% | Above MA20, MA50, MA200 |
| PANW | Palo Alto Networks Inc | Technology | $396.25 | +120.91% | 2026-09-30 | 63.4 | +58.3% | Above MA20, MA50, MA200 |
| PLTR | Palantir Technologies Inc | Technology | $190.04 | +13.21% | 2026-09-24 | 65.0 | +24.9% | Above MA20, MA50, MA200 |
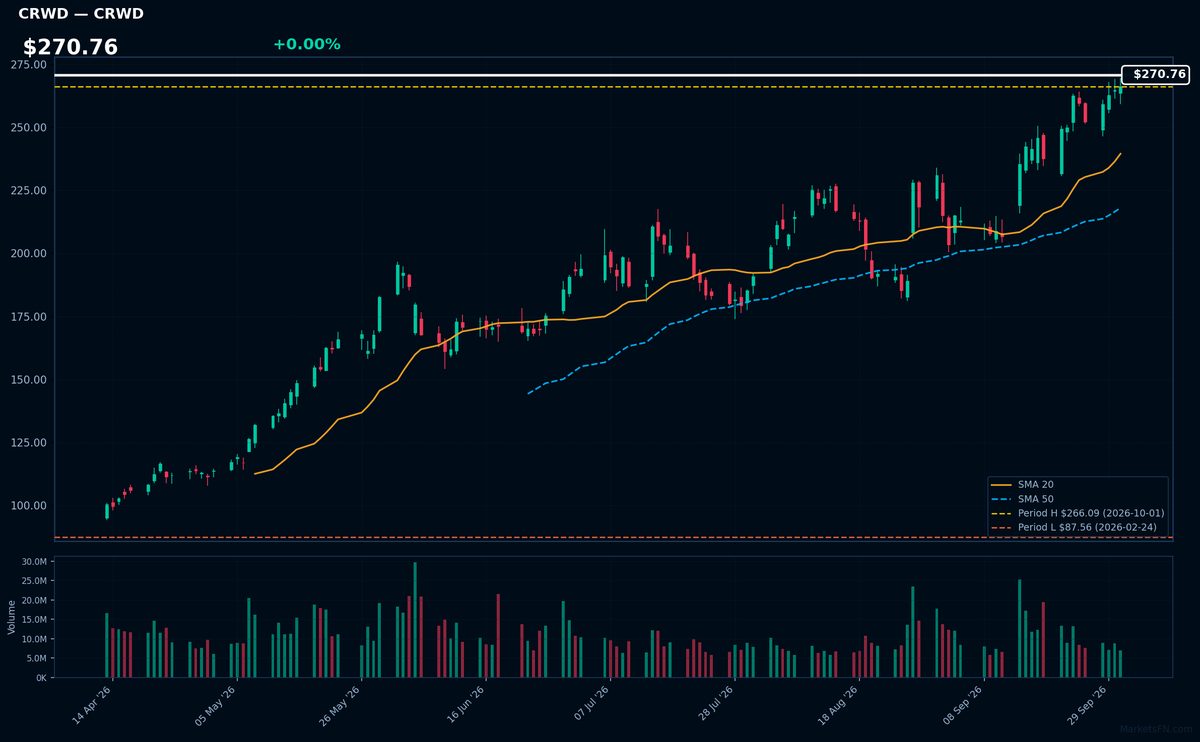
CRWD | Crowdstrike Holdings Inc | Technology | Price Last: $266.09 | % Realized: +134.66% | RSI: 69.0 | % above MA200: +73.3% | Trend: Above MA20, MA50, MA200
Crowdstrike Holdings Inc provides cloud-native endpoint protection and threat intelligence. Investors should care because the company is capturing critical cybersecurity spend as enterprises migrate from legacy antivirus to AI-driven, scalable security platforms to prevent data breaches.
Momentum is strongly bullish with a 134.7% return over the 2026 YTD period. Price > MA20 > MA50 > MA200 indicates a sustained uptrend. With an RSI(14) of 69.0 and the stock 0.0% below its 2026 YTD high, it is positioned for a potential breakout.
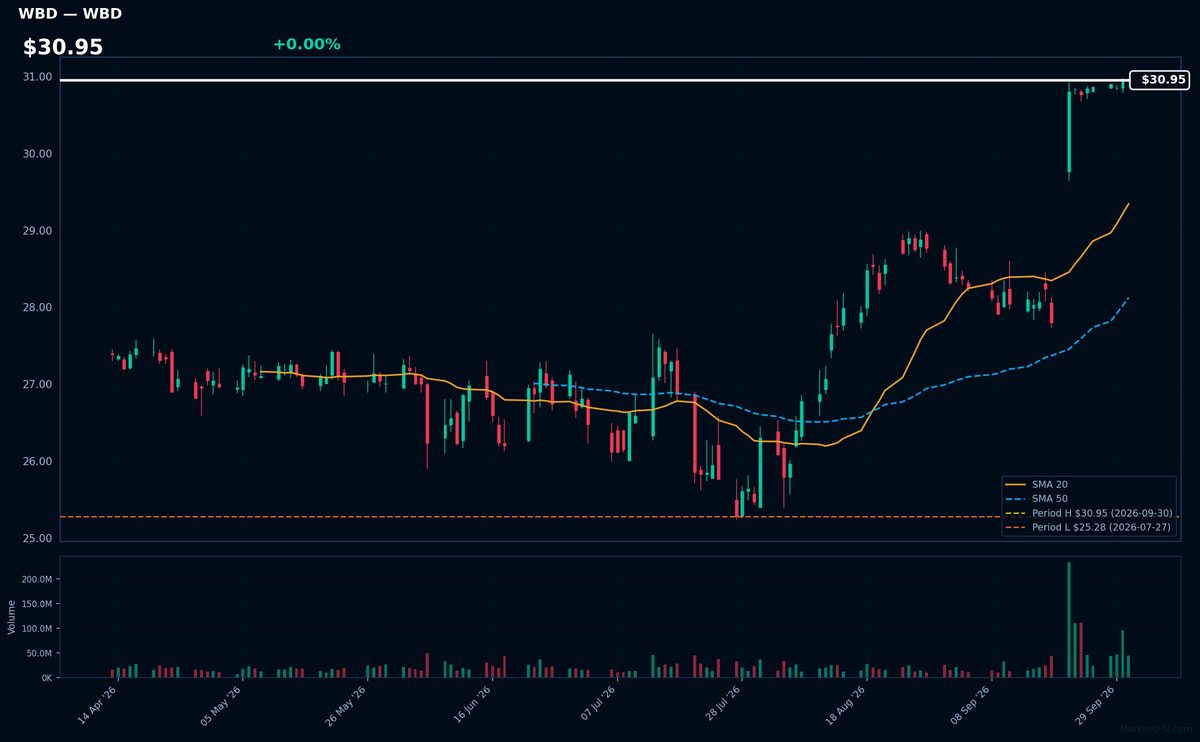
WBD | Warner Bros. Discovery Inc | Communication Services | Price Last: $30.95 | % Realized: +8.56% | RSI: 75.4 | % above MA200: +11.8% | Trend: Above MA20, MA50, MA200
Warner Bros. Discovery Inc operates as a global media and entertainment powerhouse, controlling a massive library of intellectual property and distribution networks. Investors care because the company's ability to monetize content across streaming and linear platforms drives its valuation and market influence.
The stock shows strong momentum with a bullish MA alignment (price > MA20 > MA50 > MA200) and an 8.6% return over 2026 YTD. However, an RSI(14) of 75.4 suggests overbought conditions as the price sits 0.0% below its 2026 YTD high.
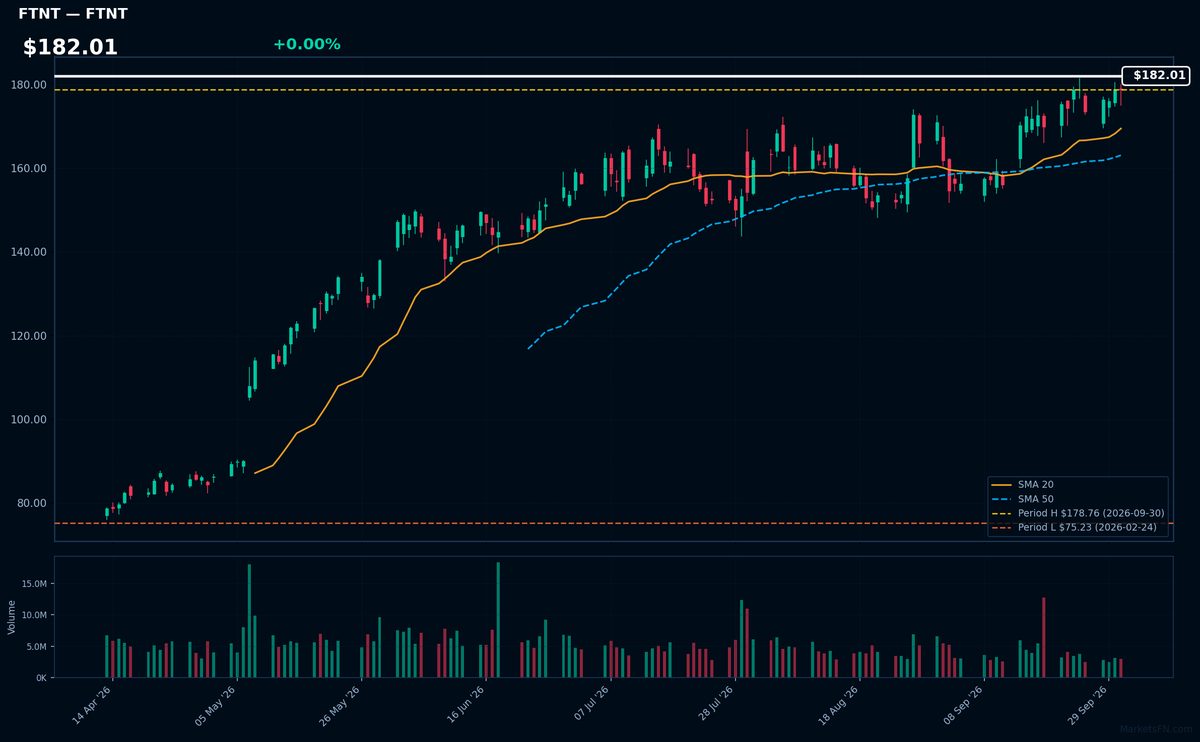
FTNT | Fortinet Inc | Technology | Price Last: $178.72 | % Realized: +129.48% | RSI: 65.1 | % above MA200: +50.7% | Trend: Above MA20, MA50, MA200
Fortinet Inc provides cybersecurity solutions designed to protect digital assets. Investors should care because the company is demonstrating significant growth, evidenced by a 129.5% return over the 2026 YTD period.
The stock shows strong momentum with a bullish MA alignment (price > MA20 > MA50 > MA200) and an RSI(14) of 65.1. Trading at $182.01, it is 0.0% below its 2026 YTD high, signaling a potential breakout.
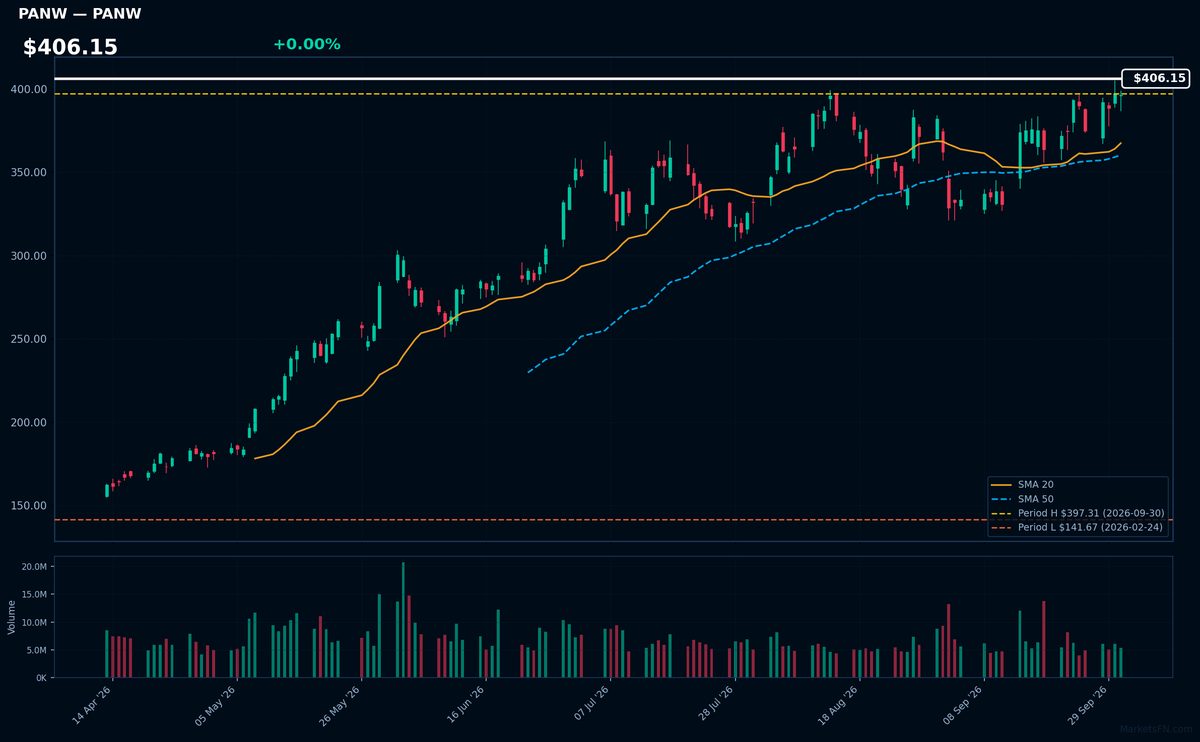
PANW | Palo Alto Networks Inc | Technology | Price Last: $396.25 | % Realized: +120.91% | RSI: 63.4 | % above MA200: +58.3% | Trend: Above MA20, MA50, MA200
Palo Alto Networks Inc provides cybersecurity solutions to protect enterprise networks. Investors should care because the company is currently experiencing a sustained uptrend, delivering a 120.9% return over the 2026 YTD period.
Momentum is strong with a bullish MA alignment (price > MA20 > MA50 > MA200) and an RSI(14) of 63.4. Trading at $406.15, the stock is 0.3% below its 2026 YTD high, signaling a potential breakout.
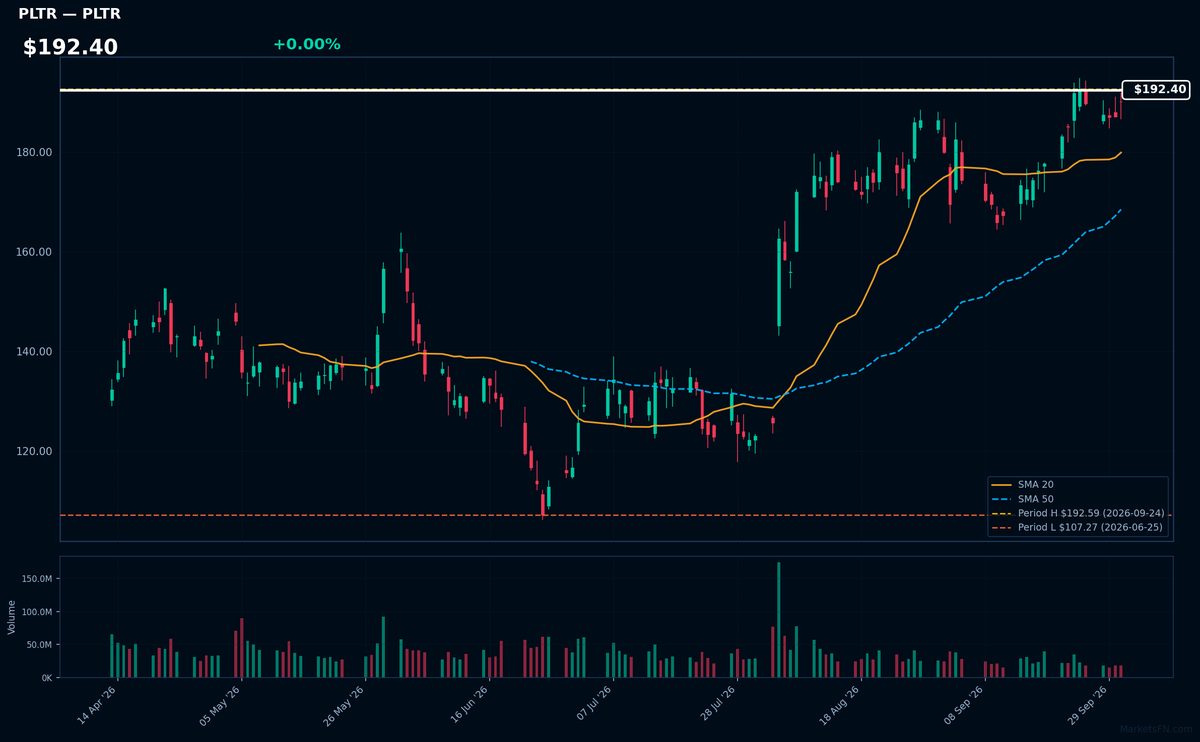
PLTR | Palantir Technologies Inc | Technology | Price Last: $190.04 | % Realized: +13.21% | RSI: 65.0 | % above MA200: +24.9% | Trend: Above MA20, MA50, MA200
Palantir Technologies Inc provides data integration and analytics platforms that enable organizations to unify fragmented data sources for operational decision-making. Investors care because the company transforms raw data into actionable intelligence, driving efficiency and strategic advantages across government and commercial sectors.
Momentum is strong with a bullish MA alignment (price > MA20 > MA50 > MA200) and a 13.2% 2026 YTD return. With an RSI(14) of 65.0 and the price 1.3% below its 2026 YTD high, the stock is positioned near a potential breakout level.
📉 Nearest to 2026 Low
Sectors represented: Communication Services (3), Consumer Defensive (1), Consumer Cyclical (1)
| Ticker | Company | Sector | Price Last | % Realized | 2026 YTD Low Date | RSI | % above MA200 | Trend |
|---|---|---|---|---|---|---|---|---|
| TMUS | T-Mobile US Inc | Communication Services | $161.73 | -18.96% | 2026-10-01 | 36.9 | -15.4% | Below MA20, MA50, MA200 |
| PEP | PepsiCo Inc | Consumer Defensive | $125.60 | -11.69% | 2026-10-01 | 26.5 | -14.7% | Below MA20, MA50, MA200 |
| APP | Applovin Corp | Communication Services | $281.31 | -54.50% | 2026-10-01 | 29.6 | -38.3% | Below MA20, MA50, MA200 |
| LULU | Lululemon Athletica inc | Consumer Cyclical | $95.86 | -54.53% | 2026-10-01 | 34.6 | -33.9% | Below MA20, MA50, MA200 |
| NFLX | Netflix Inc | Communication Services | $67.85 | -25.43% | 2026-07-20 | 32.0 | -19.3% | Below MA20, MA50, MA200 |
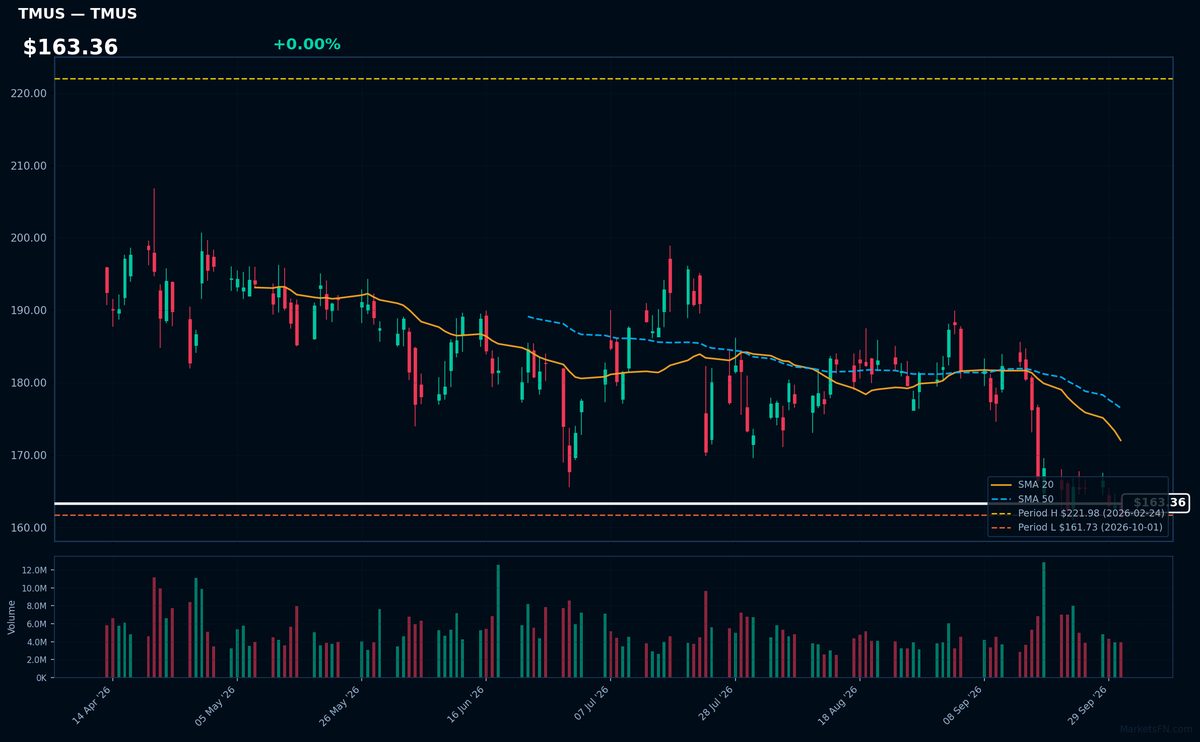
TMUS | T-Mobile US Inc | Communication Services | Price Last: $161.73 | % Realized: -18.96% | RSI: 36.9 | % above MA200: -15.4% | Trend: Below MA20, MA50, MA200
T-Mobile US Inc is a major wireless carrier providing mobile voice and data services. Investors should care as it competes for market share in the critical telecommunications infrastructure sector, impacting its ability to maintain long-term subscriber growth and pricing power.
The technicals signal a warning sign. TMUS is in a sustained downtrend with a bearish MA alignment (price < MA20 < MA50 < MA200) and an RSI(14) of 36.9. The stock is 0.0% above its 2026 YTD low, following a -19.0% return over that period.
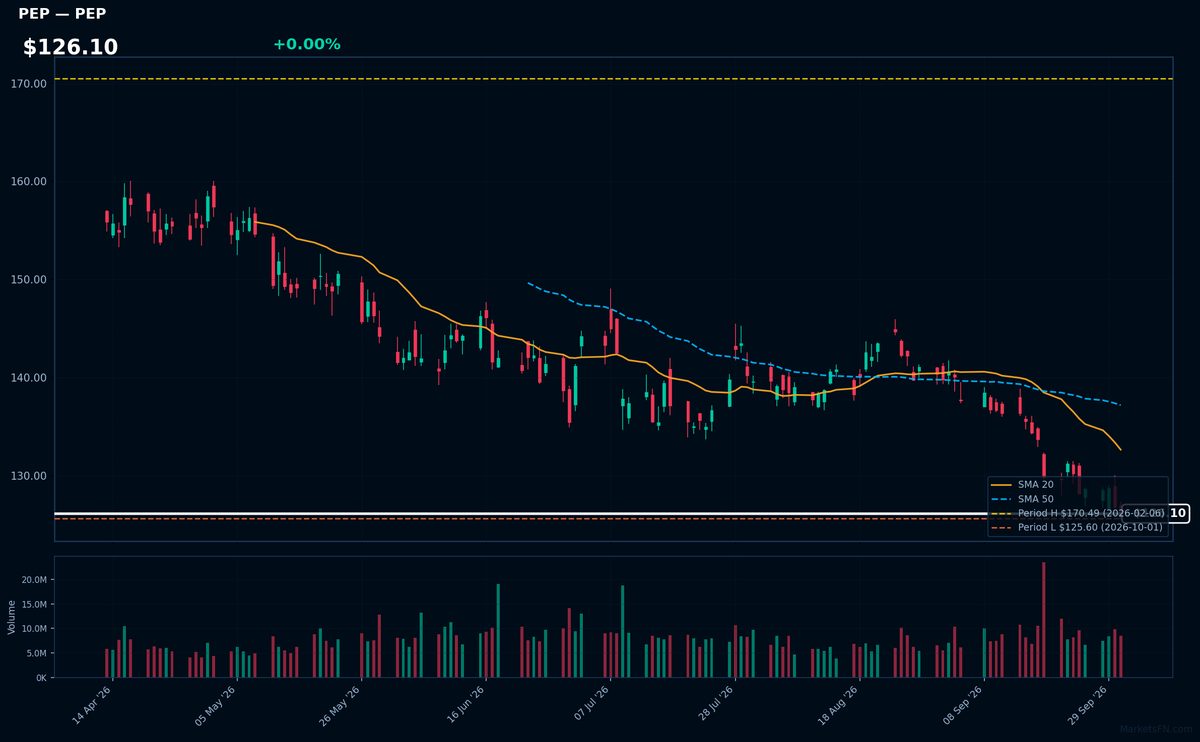
PEP | PepsiCo Inc | Consumer Defensive | Price Last: $125.60 | % Realized: -11.69% | RSI: 26.5 | % above MA200: -14.7% | Trend: Below MA20, MA50, MA200
PepsiCo Inc is a global leader in convenient foods and beverages, managing a diversified portfolio of snacks and drinks. Investors care because of its scale and ability to maintain market presence across multiple consumer categories.
The technicals signal a warning sign. Price is in a sustained downtrend with a bearish MA alignment (price < MA20 < MA50 < MA200). With an RSI(14) of 26.5 and a -11.7% 2026 YTD return, the stock is testing major support.
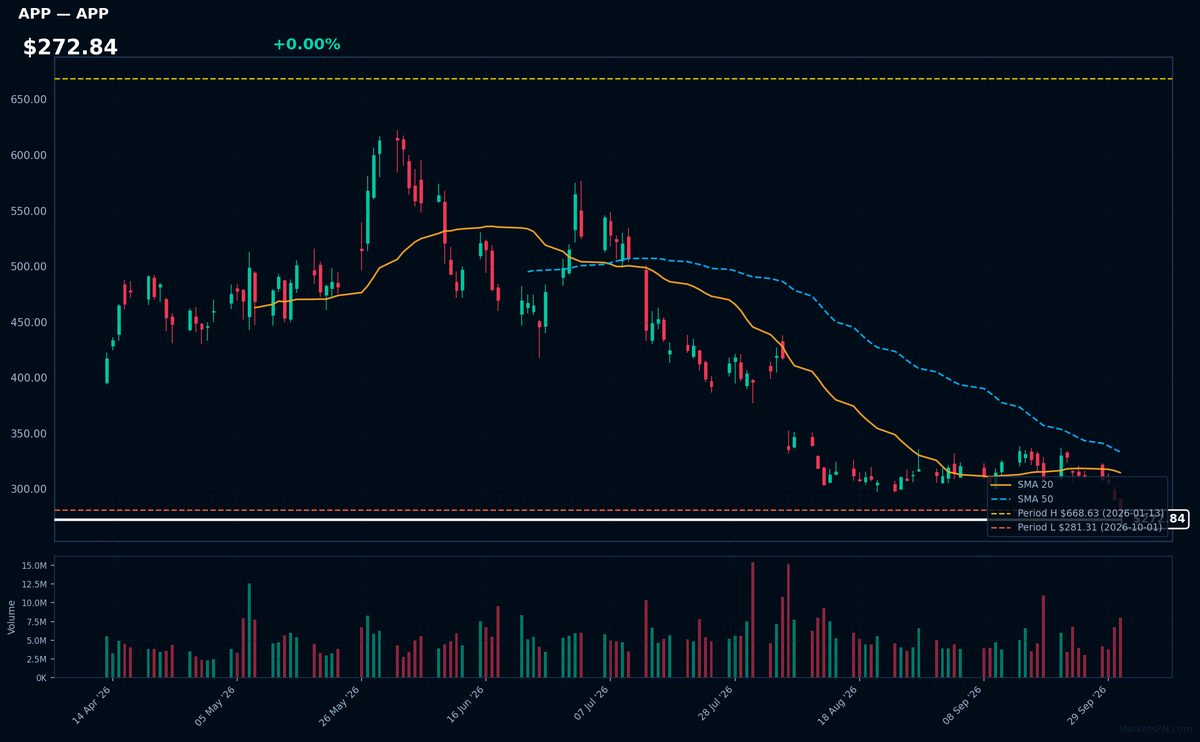
APP | Applovin Corp | Communication Services | Price Last: $281.31 | % Realized: -54.50% | RSI: 29.6 | % above MA200: -38.3% | Trend: Below MA20, MA50, MA200
Applovin Corp operates a software platform that leverages AI to optimize mobile advertising and app monetization. Investors should care because the company controls the critical intersection of user acquisition and revenue generation for mobile developers, making it a key play on the programmatic ad market.
The technicals signal a severe warning sign. Applovin is in a sustained downtrend with bearish MA alignment (price < MA20 < MA50 < MA200) and an RSI(14) of 29.6. With a -54.5% return over 2026 YTD, the stock is testing major support at 0.0% above its 2026 YTD low.
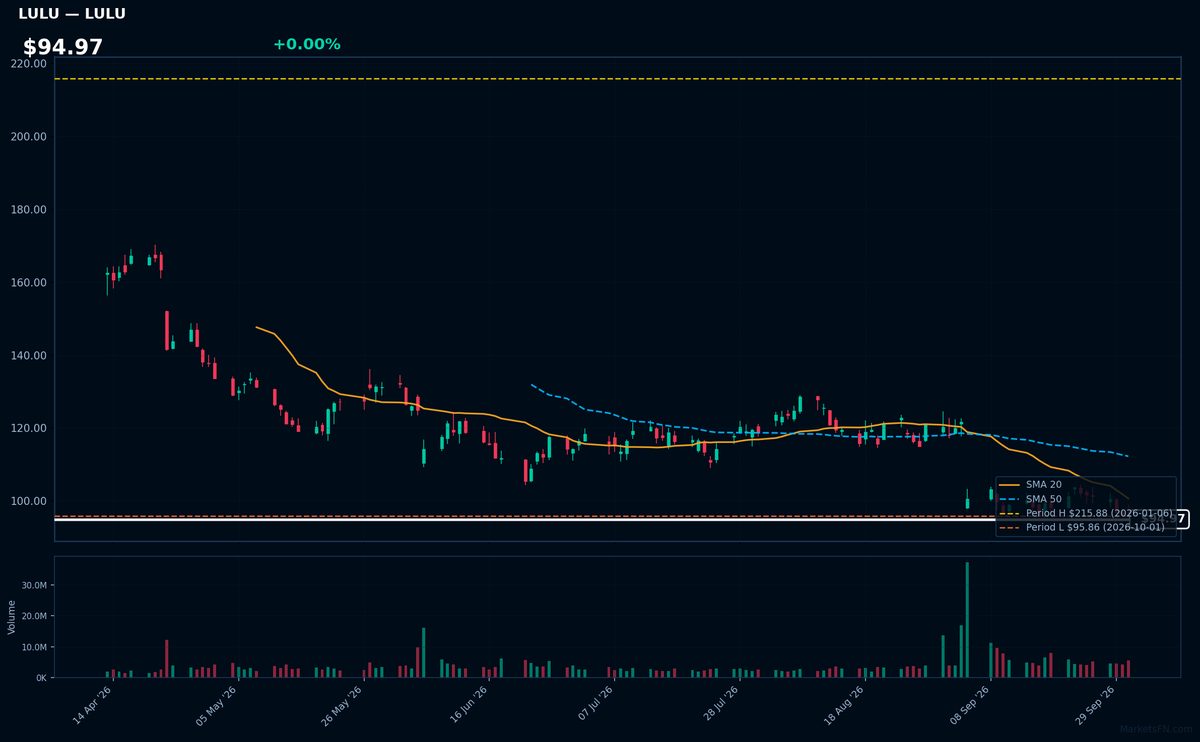
LULU | Lululemon Athletica inc | Consumer Cyclical | Price Last: $95.86 | % Realized: -54.53% | RSI: 34.6 | % above MA200: -33.9% | Trend: Below MA20, MA50, MA200
Lululemon Athletica inc is a premium athletic apparel retailer. Investors should care about its performance as it reflects consumer spending on high-end fitness wear and the company's ability to maintain brand premium and market share.
Lululemon's current technical situation is bearish, with an RSI(14) of 34.6 indicating oversold conditions, and a sustained downtrend as price ($94.97) remains below MA20, MA50, and MA200, with the stock testing major support at its 2026 YTD low.
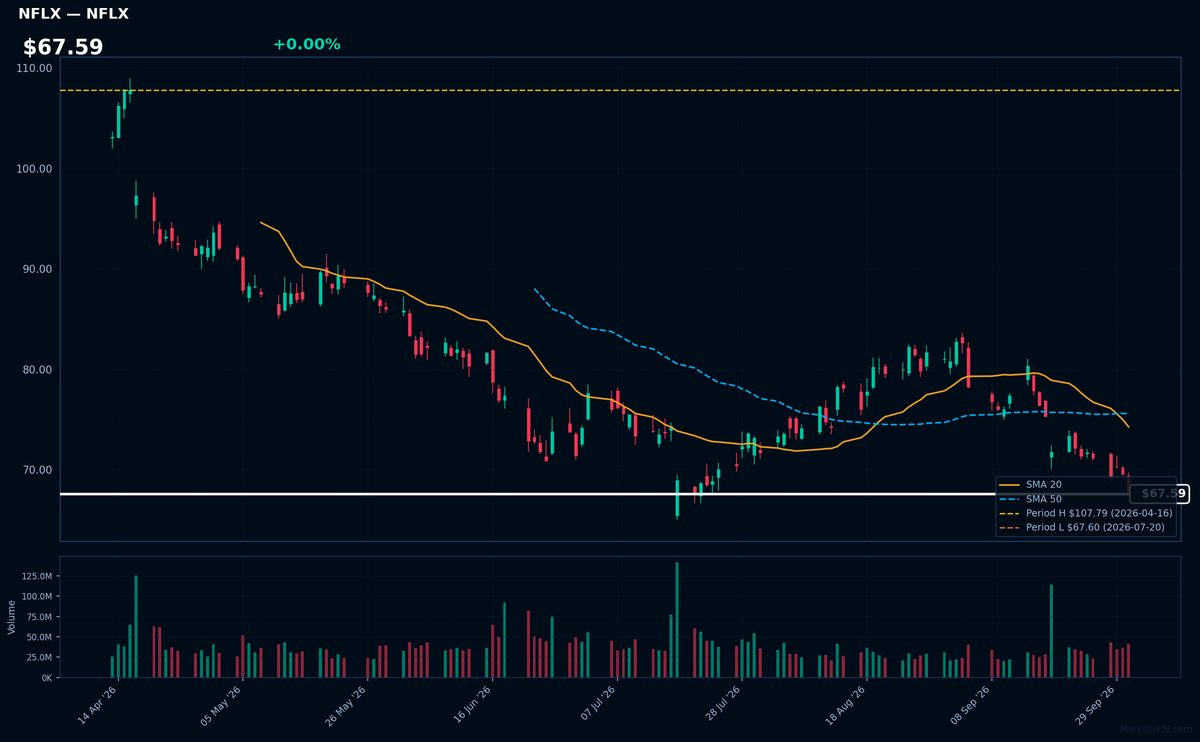
NFLX | Netflix Inc | Communication Services | Price Last: $67.85 | % Realized: -25.43% | RSI: 32.0 | % above MA200: -19.3% | Trend: Below MA20, MA50, MA200
Netflix Inc operates a global streaming service and content production engine. Investors should care because the company controls a massive library of original intellectual property and a scalable subscription model that defines the modern digital entertainment landscape.
The technicals signal a warning sign. NFLX is in a sustained downtrend with bearish MA alignment (price < MA20 < MA50 < MA200) and an RSI(14) of 32.0. With a -25.4% 2026 YTD return, the stock is only 0.4% above its 2026 YTD low.
Market Commentary
The current positioning of Nasdaq 100 components reveals a stark divergence in momentum. Cybersecurity leaders such as CRWD (0.0% from high), FTNT (-0.0% from high), and PANW (-0.3% from high), alongside PLTR (-1.3% from high) and WBD (0.0% from high), are trading at or near their 2026 highs. Conversely, stocks like TMUS, PEP, APP, and LULU are sitting at their 2026 lows (+0.0% above low), with NFLX trailing slightly at +0.4% above its low.
This distribution suggests a strong thematic rotation into cybersecurity and data analytics, driving the strength seen in Crowdstrike, Fortinet, and Palo Alto Networks. Meanwhile, the proximity of Netflix and Lululemon to their 2026 lows indicates significant headwinds or a lack of catalyst for consumer-facing and entertainment platforms relative to the broader tech index.
Investors should monitor whether the momentum in the cybersecurity cluster can sustain these 2026 extremes or if a mean reversion occurs. Traders should specifically watch for any reversal signals in the stocks currently at their lows, such as Applovin Corp and PepsiCo, to determine if the broader market is shifting away from high-growth security plays.
Methodology: All 101 Nasdaq 100 constituents screened. Close prices downloaded from 2026-01-01. Period high = highest close since Jan 1 2026; period low = lowest close since Jan 1 2026. Distance = (current price / period extreme − 1) × 100. Technical indicators computed on up to 1 year of daily OHLCV data.
Disclaimer: For informational purposes only. Not investment advice. Past performance is not indicative of future results.

