Nasdaq 100 2026 YTD Highs & Lows Radar: Crowdstrike (CRWD), Synopsys, (SNPS) and more
MarketsFN Team

Nasdaq 100 2026 YTD Highs & Lows Radar: Crowdstrike (CRWD), Synopsys, (SNPS) and more
Screening all 101 Nasdaq 100 constituents for stocks nearest to their 2026 year-to-date high and their 2026 YTD low. Data as of September 16, 2026. % Realized = total return since Jan 1 2026.
Legend: RSI > 70 = overbought · RSI < 30 = oversold · Green % Realized = positive YTD return · Red = negative.
📈 Nearest to 2026 High
Sectors represented: Technology (4), Energy (1)
| Ticker | Company | Sector | Price Last | % Realized | 2026 YTD High Date | RSI | % above MA200 | Trend |
|---|---|---|---|---|---|---|---|---|
| CRWD | Crowdstrike Holdings Inc | Technology | $242.49 | +113.85% | 2026-09-15 | 63.6 | +66.3% | Above MA20, MA50, MA200 |
| CDW | CDW Corp | Technology | $153.74 | +15.46% | 2026-08-04 | 57.6 | +16.4% | Above MA20, MA50, MA200 |
| FTNT | Fortinet Inc | Technology | $172.37 | +121.33% | 2026-08-27 | 62.7 | +52.5% | Above MA20, MA50, MA200 |
| FANG | Diamondback Energy Inc | Energy | $211.53 | +38.85% | 2026-05-04 | 43.5 | +15.7% | Above MA20, MA50, MA200 |
| TEAM | Atlassian Corporation | Technology | $189.81 | +22.65% | 2026-09-03 | 64.6 | +71.7% | Above MA20, MA50, MA200 |
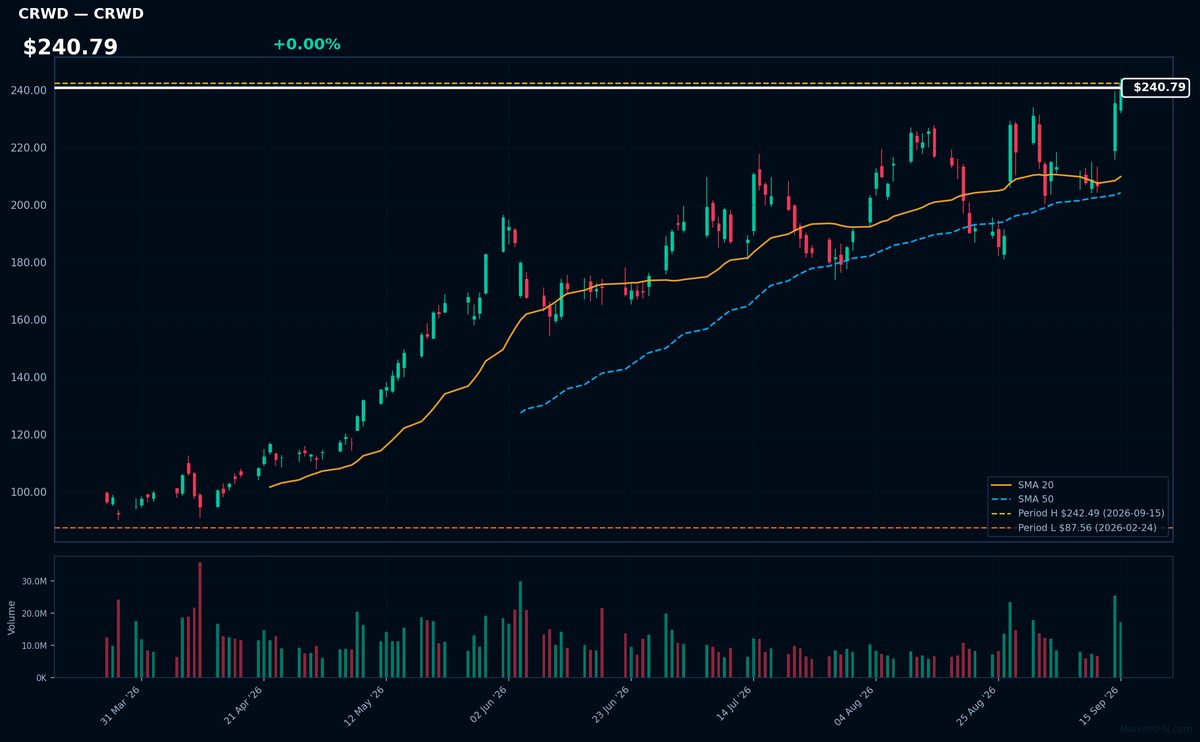
CRWD | Crowdstrike Holdings Inc | Technology | Price Last: $242.49 | % Realized: +113.85% | RSI: 63.6 | % above MA200: +66.3% | Trend: Above MA20, MA50, MA200
Crowdstrike Holdings Inc is a cybersecurity company providing cloud-delivered endpoint and cloud workload protection. Investors should care because its innovative solutions are in high demand, driving growth. Specific details about its products and services are not available in the given data.
Crowdstrike's current technical situation indicates strong momentum: RSI(14) is 63.6, and the stock is in a sustained uptrend with price > MA20 > MA50 > MA200. It's near a potential breakout level, 0.0% below its 2026 YTD high.
Related headlines
- CrowdStrike Named the Only Customers Choice in the 2026 Gartner Peer Insights Voice of the Customer for Identity Threat Detection and Response (ITDR)
- Why Did DELL, CRWD, CVX Stocks Jump To 52-Week Highs Today?
- CRWD, PANW Stocks Extend AI-Fueled Rally As Cybersecurity Bets Outpace Software
- CrowdStrike CEO Warns AI Cyber Threat Is Already Here
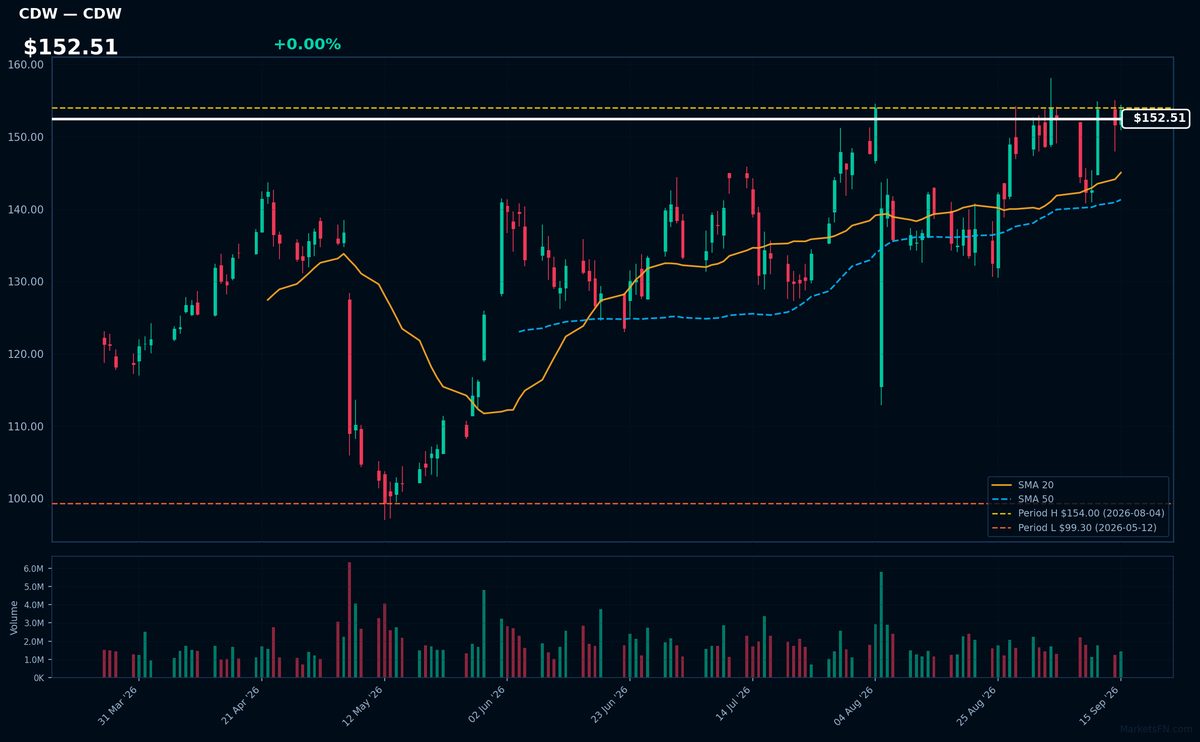
CDW | CDW Corp | Technology | Price Last: $153.74 | % Realized: +15.46% | RSI: 57.6 | % above MA200: +16.4% | Trend: Above MA20, MA50, MA200
CDW Corp is a technology solutions provider. Investors should care because its strong performance indicates demand for IT services and infrastructure, potentially driven by businesses upgrading their technology ecosystems.
CDW Corp's technicals indicate sustained uptrend with price at $152.51, 0.2% below 2026 YTD high, RSI(14) at 57.6, and bullish MA alignment (price > MA20 > MA50 > MA200), suggesting momentum with a potential breakout.
Related headlines
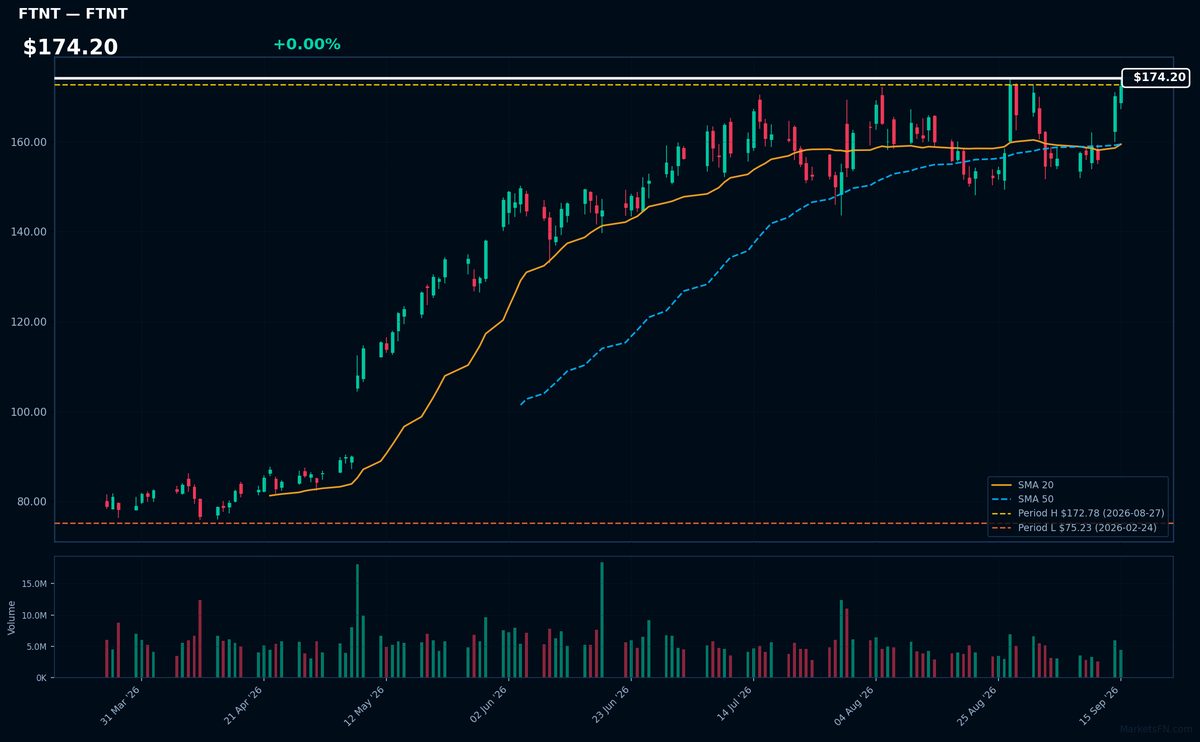
FTNT | Fortinet Inc | Technology | Price Last: $172.37 | % Realized: +121.33% | RSI: 62.7 | % above MA200: +52.5% | Trend: Above MA20, MA50, MA200
Fortinet Inc is a cybersecurity company that provides security solutions such as firewalls and intrusion detection/prevention systems. Investors should care because its products protect networks from cyber threats, a growing concern for businesses and organizations.
Fortinet Inc is in a sustained uptrend with price > MA20 > MA50 > MA200, RSI(14) at 62.7, and is 0.2% below its 2026 YTD high, indicating strong momentum with potential for breakout.
Related headlines
- Fortinet Expands U.S. Presence with New Company-Owned Innovation Hub in New York City
- 2 Top Cybersecurity Stocks to Buy Amid AI Safety Fears: FTNT, QLYS
- Cybersecurity Stocks Jump As Anthropic CEOs AI Slowdown Call Sharpens Focus On Cyber Risks CRWD, PANW, FTNT Buck Market Selloff
- CRWD Stock Leads Wedbushs Cybersecurity Bets: Check Point, Fortinet, Varonis, Telos Downgraded
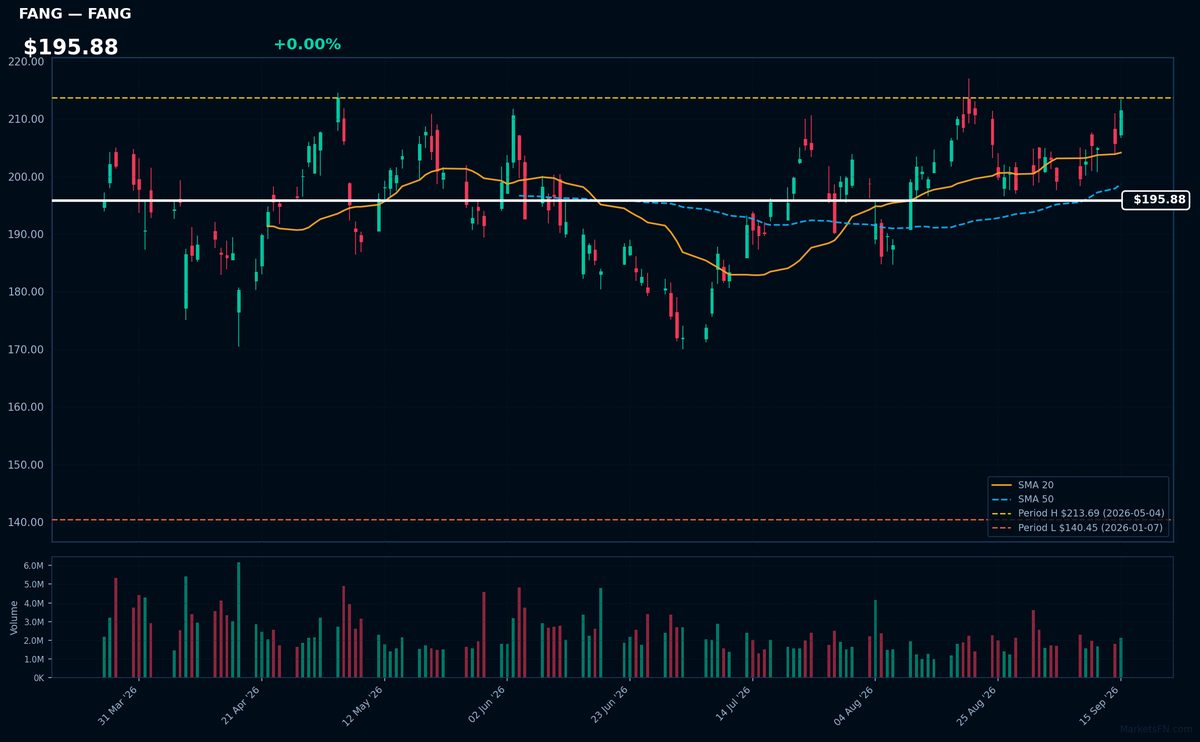
FANG | Diamondback Energy Inc | Energy | Price Last: $211.53 | % Realized: +38.85% | RSI: 43.5 | % above MA200: +15.7% | Trend: Above MA20, MA50, MA200
Diamondback Energy Inc is an oil and gas company. Investors should care because its stock performance reflects energy market trends. The 38.9% 2026 YTD return indicates strong industry demand.
Diamondback Energy Inc's RSI is 43.5, indicating neutral momentum. The stock is below MA20/MA50 but above MA200, showing mixed signals. It's 1.0% below its 2026 YTD high, nearing a potential breakout.
Related headlines
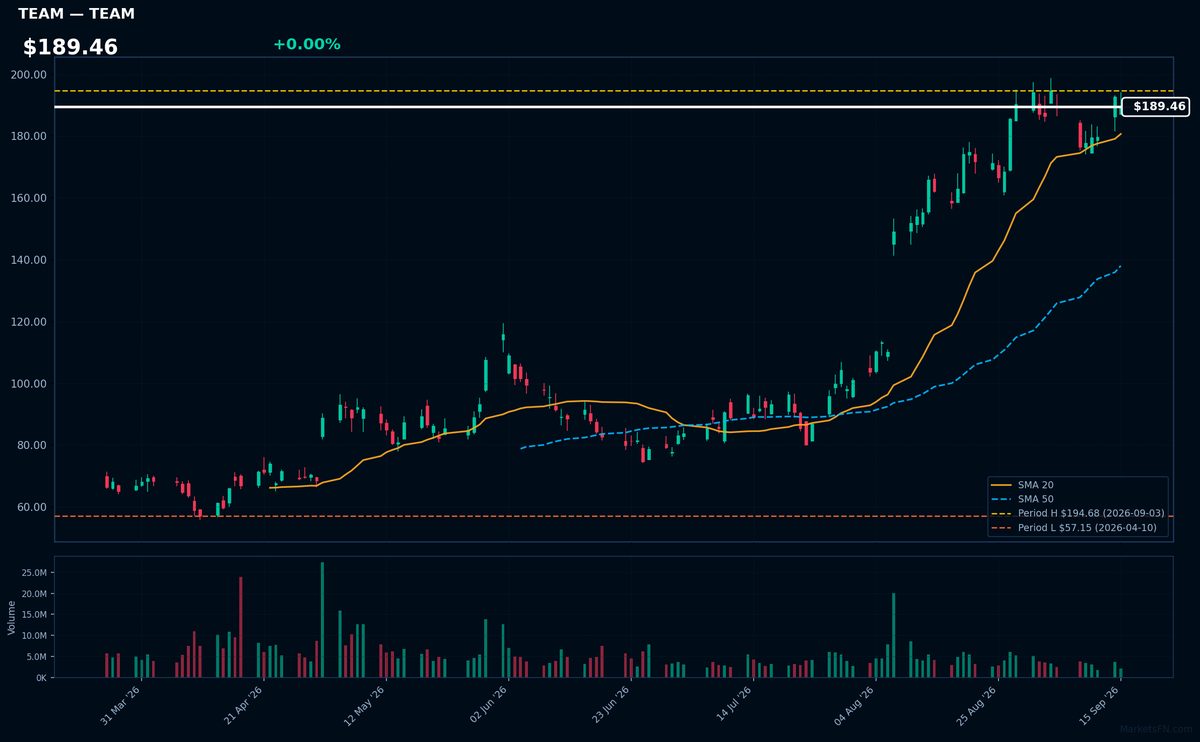
TEAM | Atlassian Corporation | Technology | Price Last: $189.81 | % Realized: +22.65% | RSI: 64.6 | % above MA200: +71.7% | Trend: Above MA20, MA50, MA200
Atlassian Corporation is a software company that provides collaboration and productivity tools like Jira and Trello. Investors should care because its products are widely adopted by enterprises, driving growth and profitability.
Atlassian's technicals indicate sustained uptrend with price > MA20 > MA50 > MA200, RSI(14) at 64.6. Near its 2026 YTD high, 2.5% below, suggesting potential breakout; 22.6% 2026 YTD return reinforces bullish momentum.
Related headlines
- Atlassian Shares Rise 3% as Software Stocks Outperform Chipmakers
- Atlassian Launches System to Coordinate and Accelerate Agentic Engineering
- Why Did SNOW, DELL, TEAM Stocks Surge To 52-Week Highs Today?
- TEAM Stock Heads For Best Month Ever As Software Stocks Swing From SaaSpocalypse To Full Revival In One Month
📉 Nearest to 2026 Low
Sectors represented: Utilities (2), Technology (1), Consumer Defensive (1), Industrials (1)
| Ticker | Company | Sector | Price Last | % Realized | 2026 YTD Low Date | RSI | % above MA200 | Trend |
|---|---|---|---|---|---|---|---|---|
| SNPS | Synopsys, Inc | Technology | $367.70 | -23.46% | 2026-09-15 | 36.7 | -17.7% | Below MA20, MA50, MA200 |
| EXC | Exelon Corp | Utilities | $42.20 | -3.92% | 2026-09-15 | 33.2 | -7.9% | Below MA20, MA50, MA200 |
| XEL | Xcel Energy, Inc | Utilities | $72.49 | -2.93% | 2026-09-15 | 31.7 | -7.6% | Below MA20, MA50, MA200 |
| PEP | PepsiCo Inc | Consumer Defensive | $135.50 | -4.73% | 2026-07-23 | 37.1 | -8.7% | Below MA20, MA50, MA200 |
| HON | Honeywell International Inc | Industrials | $203.44 | -0.97% | 2026-09-14 | 34.8 | -11.5% | Below MA20, MA50, MA200 |
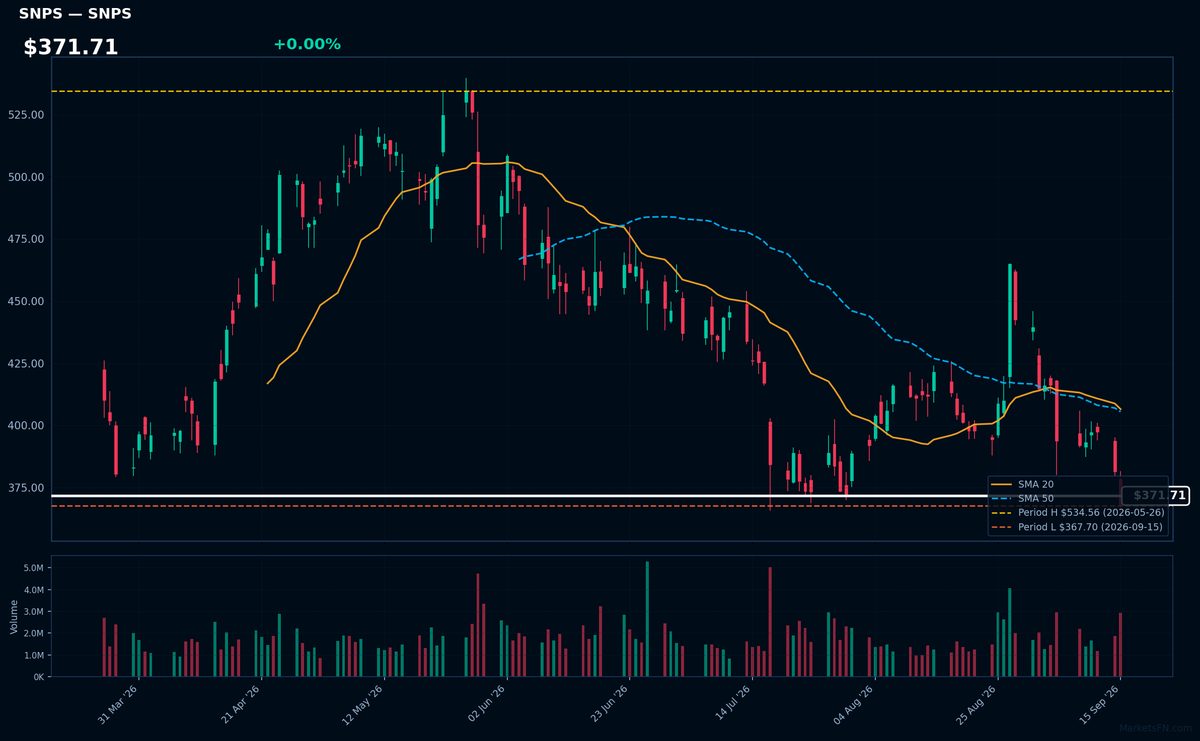
SNPS | Synopsys, Inc | Technology | Price Last: $367.70 | % Realized: -23.46% | RSI: 36.7 | % above MA200: -17.7% | Trend: Below MA20, MA50, MA200
Synopsys, Inc is a software company that provides electronic design automation (EDA) tools and semiconductor intellectual property (IP) to the chip industry, enabling the design and verification of complex semiconductor devices — a crucial role in the tech supply chain.
Synopsys' current technical situation is bearish, with an RSI(14) of 36.7 indicating oversold conditions, and the stock price below MA20, MA50, and MA200, testing major support at its 2026 YTD low.
Related headlines
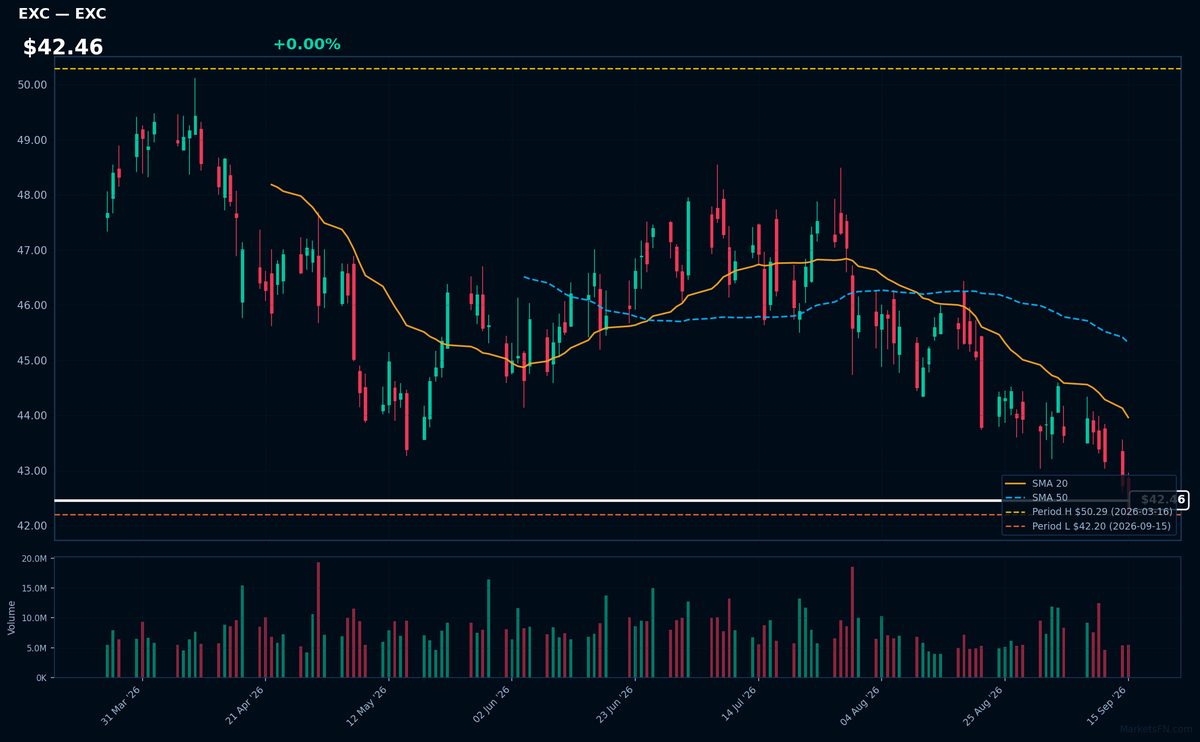
EXC | Exelon Corp | Utilities | Price Last: $42.20 | % Realized: -3.92% | RSI: 33.2 | % above MA200: -7.9% | Trend: Below MA20, MA50, MA200
Exelon Corp is a utility company that generates and distributes electricity, operating nuclear, natural gas, and renewable energy facilities. Investors should care about its stable cash flows and dividend yield, given its role in meeting US energy demands.
Exelon Corp's technical situation is bearish, with an RSI(14) of 33.2 indicating oversold conditions and a sustained downtrend as price ($42.46) remains below MA20, MA50, and MA200. The stock is testing major support at its 2026 YTD low.
Related headlines
- Exelon Announces Key Leadership Position Changes
- Exelon Secures More Than $1 Billion in Customer Protections Through Pioneering Transmission Security Agreements
- Exelon high probability data center load falls 40%
- Exelon Corp (EXC) (Q2 2026) Earnings Call Highlights: Navigating Regulatory Hurdles and Data ...
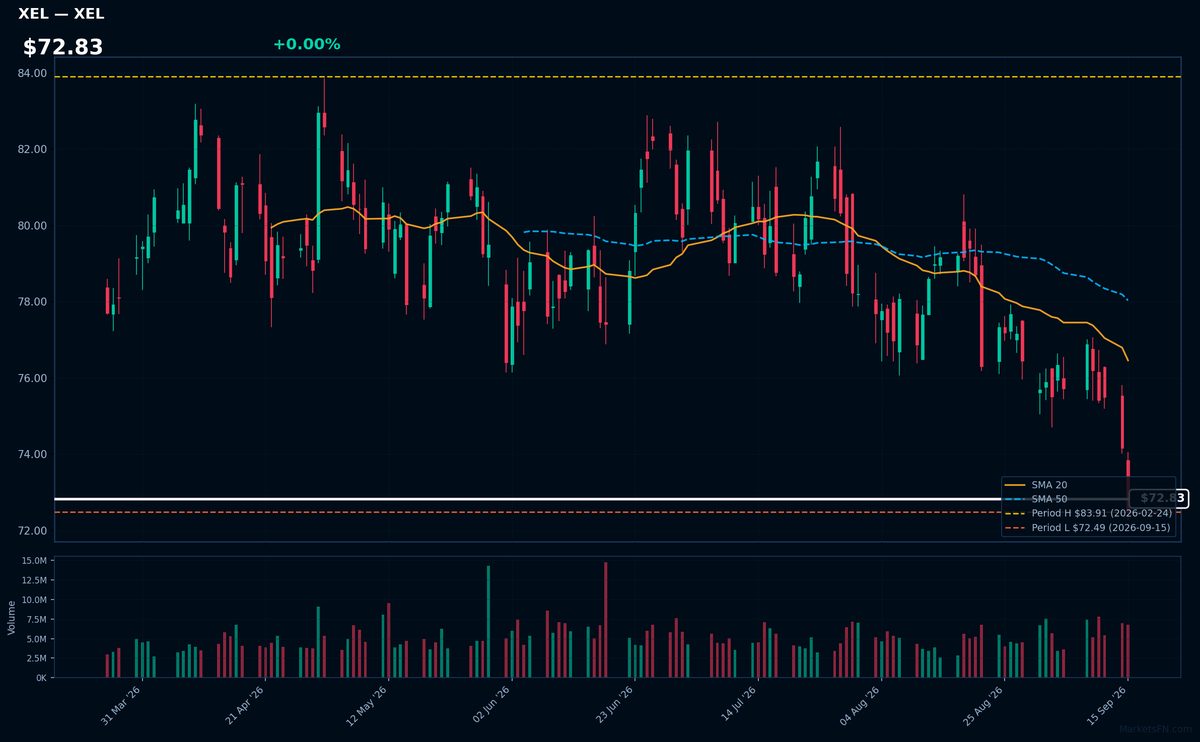
XEL | Xcel Energy, Inc | Utilities | Price Last: $72.49 | % Realized: -2.93% | RSI: 31.7 | % above MA200: -7.6% | Trend: Below MA20, MA50, MA200
Xcel Energy, Inc is a major electric and natural gas utility company serving 3.4 million electricity customers and 2.1 million natural gas customers across eight states, providing essential services and generating steady cash flows, making it attractive to income-focused investors.
XEL's technicals indicate a sustained downtrend with price ($72.83) below MA20, MA50, and MA200, and an RSI(14) of 31.7, nearing oversold territory, as it tests major support at its 2026 YTD low, a warning sign for investors.
Related headlines
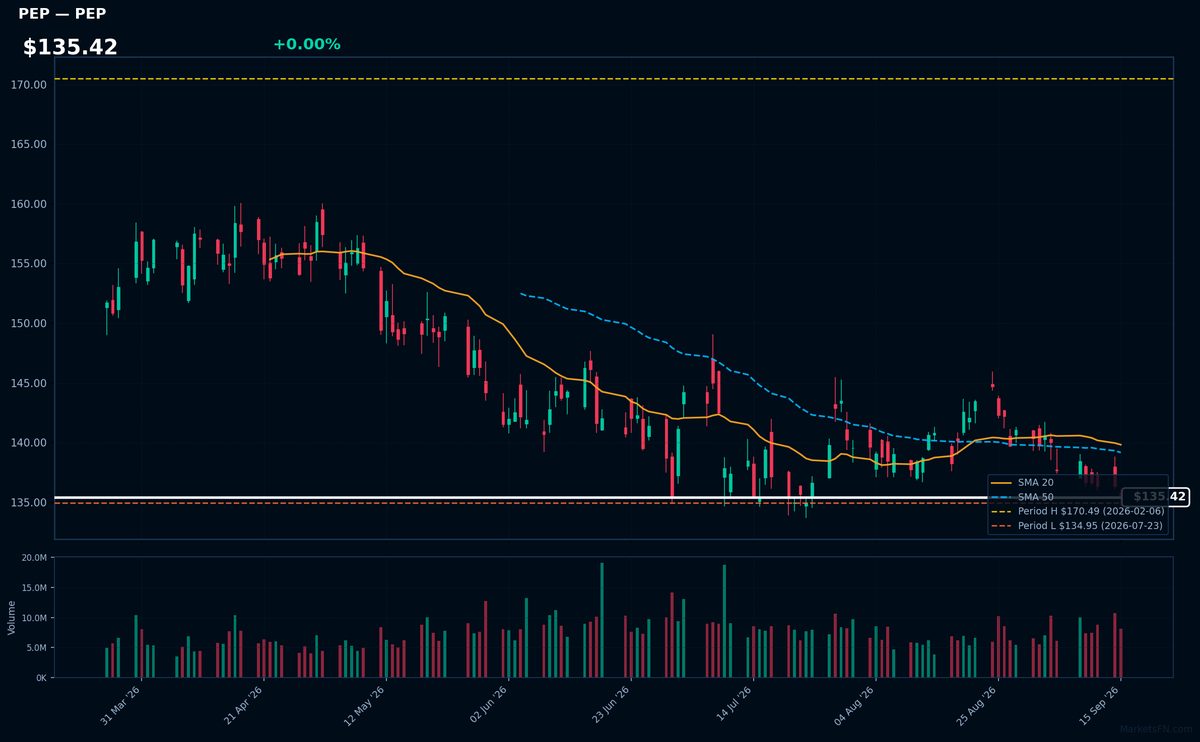
PEP | PepsiCo Inc | Consumer Defensive | Price Last: $135.50 | % Realized: -4.73% | RSI: 37.1 | % above MA200: -8.7% | Trend: Below MA20, MA50, MA200
PepsiCo Inc is a multinational food and beverage corporation with a diverse portfolio of brands, including Pepsi, Lay's, and Gatorade, generating revenue through the sale of beverages and snacks, making it an attractive investment for those seeking stable consumer staples exposure.
PepsiCo's current technical situation indicates a warning sign, with an RSI(14) of 37.1, below MA20, MA50, and MA200, and a price only 0.4% above its 2026 YTD low, suggesting testing of major support levels.
Related headlines
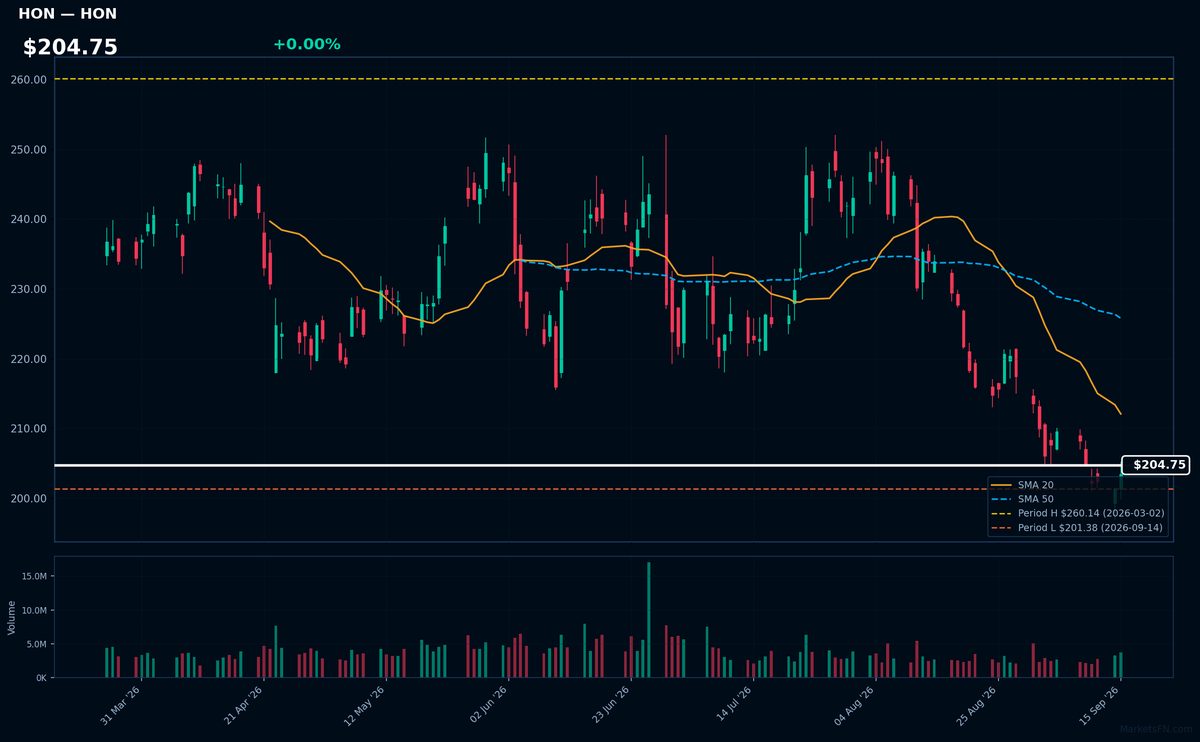
HON | Honeywell International Inc | Industrials | Price Last: $203.44 | % Realized: -0.97% | RSI: 34.8 | % above MA200: -11.5% | Trend: Below MA20, MA50, MA200
Honeywell International Inc is a diversified technology conglomerate that operates in various sectors including aerospace, building technologies, and performance materials. Investors should care due to its broad industrial exposure and innovation-driven growth prospects.
Honeywell's current technical situation indicates a sustained downtrend with price at $204.75, below MA20, MA50, and MA200. The RSI(14) is 34.8, nearing oversold territory, and the stock is 1.0% above its 2026 YTD low, testing major support.
Related headlines
Market Commentary
The provided data indicates that certain Nasdaq 100 stocks are near their 2026 year-to-date (YTD) extremes. Stocks like CRWD, CDW, and FTNT are close to their 2026 highs, with CRWD being exactly at its high. Conversely, SNPS, EXC, and XEL are at their 2026 lows.
The technology sector themes driving these moves may be related to the performance of specific sub-sectors. The stocks near their 2026 highs, such as CRWD and FTNT, are cybersecurity-related companies, potentially indicating a strong demand for security solutions. On the other hand, the stocks at their 2026 lows, like SNPS, are involved in the semiconductor and energy sectors, which may be influenced by broader macroeconomic conditions.
Investors and traders should monitor the factors driving these stocks' performance, such as earnings reports, industry trends, and macroeconomic indicators. Watching how these stocks move relative to their 2026 extremes can provide insights into the overall direction of the technology sector and the broader market. The proximity of these stocks to their YTD extremes may signal potential areas of support or resistance.
Methodology: All 101 Nasdaq 100 constituents screened. Close prices downloaded from 2026-01-01. Period high = highest close since Jan 1 2026; period low = lowest close since Jan 1 2026. Distance = (current price / period extreme − 1) × 100. Technical indicators computed on up to 1 year of daily OHLCV data.
Disclaimer: For informational purposes only. Not investment advice. Past performance is not indicative of future results.

