Nasdaq 100 2026 YTD Highs & Lows Radar: Automatic Data Processing (ADP), Trade Desk (TTD) and more
MarketsFN Team

Nasdaq 100 2026 YTD Highs & Lows Radar: Automatic Data Processing (ADP), Trade Desk (TTD) and more
Screening all 101 Nasdaq 100 constituents for stocks nearest to their 2026 year-to-date high and their 2026 YTD low. Data as of August 24, 2026. % Realized = total return since Jan 1 2026.
Legend: RSI > 70 = overbought · RSI < 30 = oversold · Green % Realized = positive YTD return · Red = negative.
📈 Nearest to 2026 High
Sectors represented: Healthcare (2), Technology (1), Consumer Cyclical (1), Communication Services (1)
| Ticker | Company | Sector | Price Last | % Realized | 2026 YTD High Date | RSI | % above MA200 | Trend |
|---|---|---|---|---|---|---|---|---|
| ADP | Automatic Data Processing Inc | Technology | $280.81 | +11.04% | 2026-08-21 | 67.6 | +19.1% | Above MA20, MA50, MA200 |
| ABNB | Airbnb Inc | Consumer Cyclical | $187.30 | +40.82% | 2026-08-21 | 73.2 | +37.2% | Above MA20, MA50, MA200 |
| EA | Electronic Arts, Inc | Communication Services | $209.70 | +0.38% | 2026-08-04 | — | — | — |
| DXCM | Dexcom Inc | Healthcare | $92.34 | +38.77% | 2026-08-21 | 69.6 | +32.9% | Above MA20, MA50, MA200 |
| AMGN | AMGEN Inc | Healthcare | $439.33 | +34.09% | 2026-08-19 | 73.6 | +24.3% | Above MA20, MA50, MA200 |
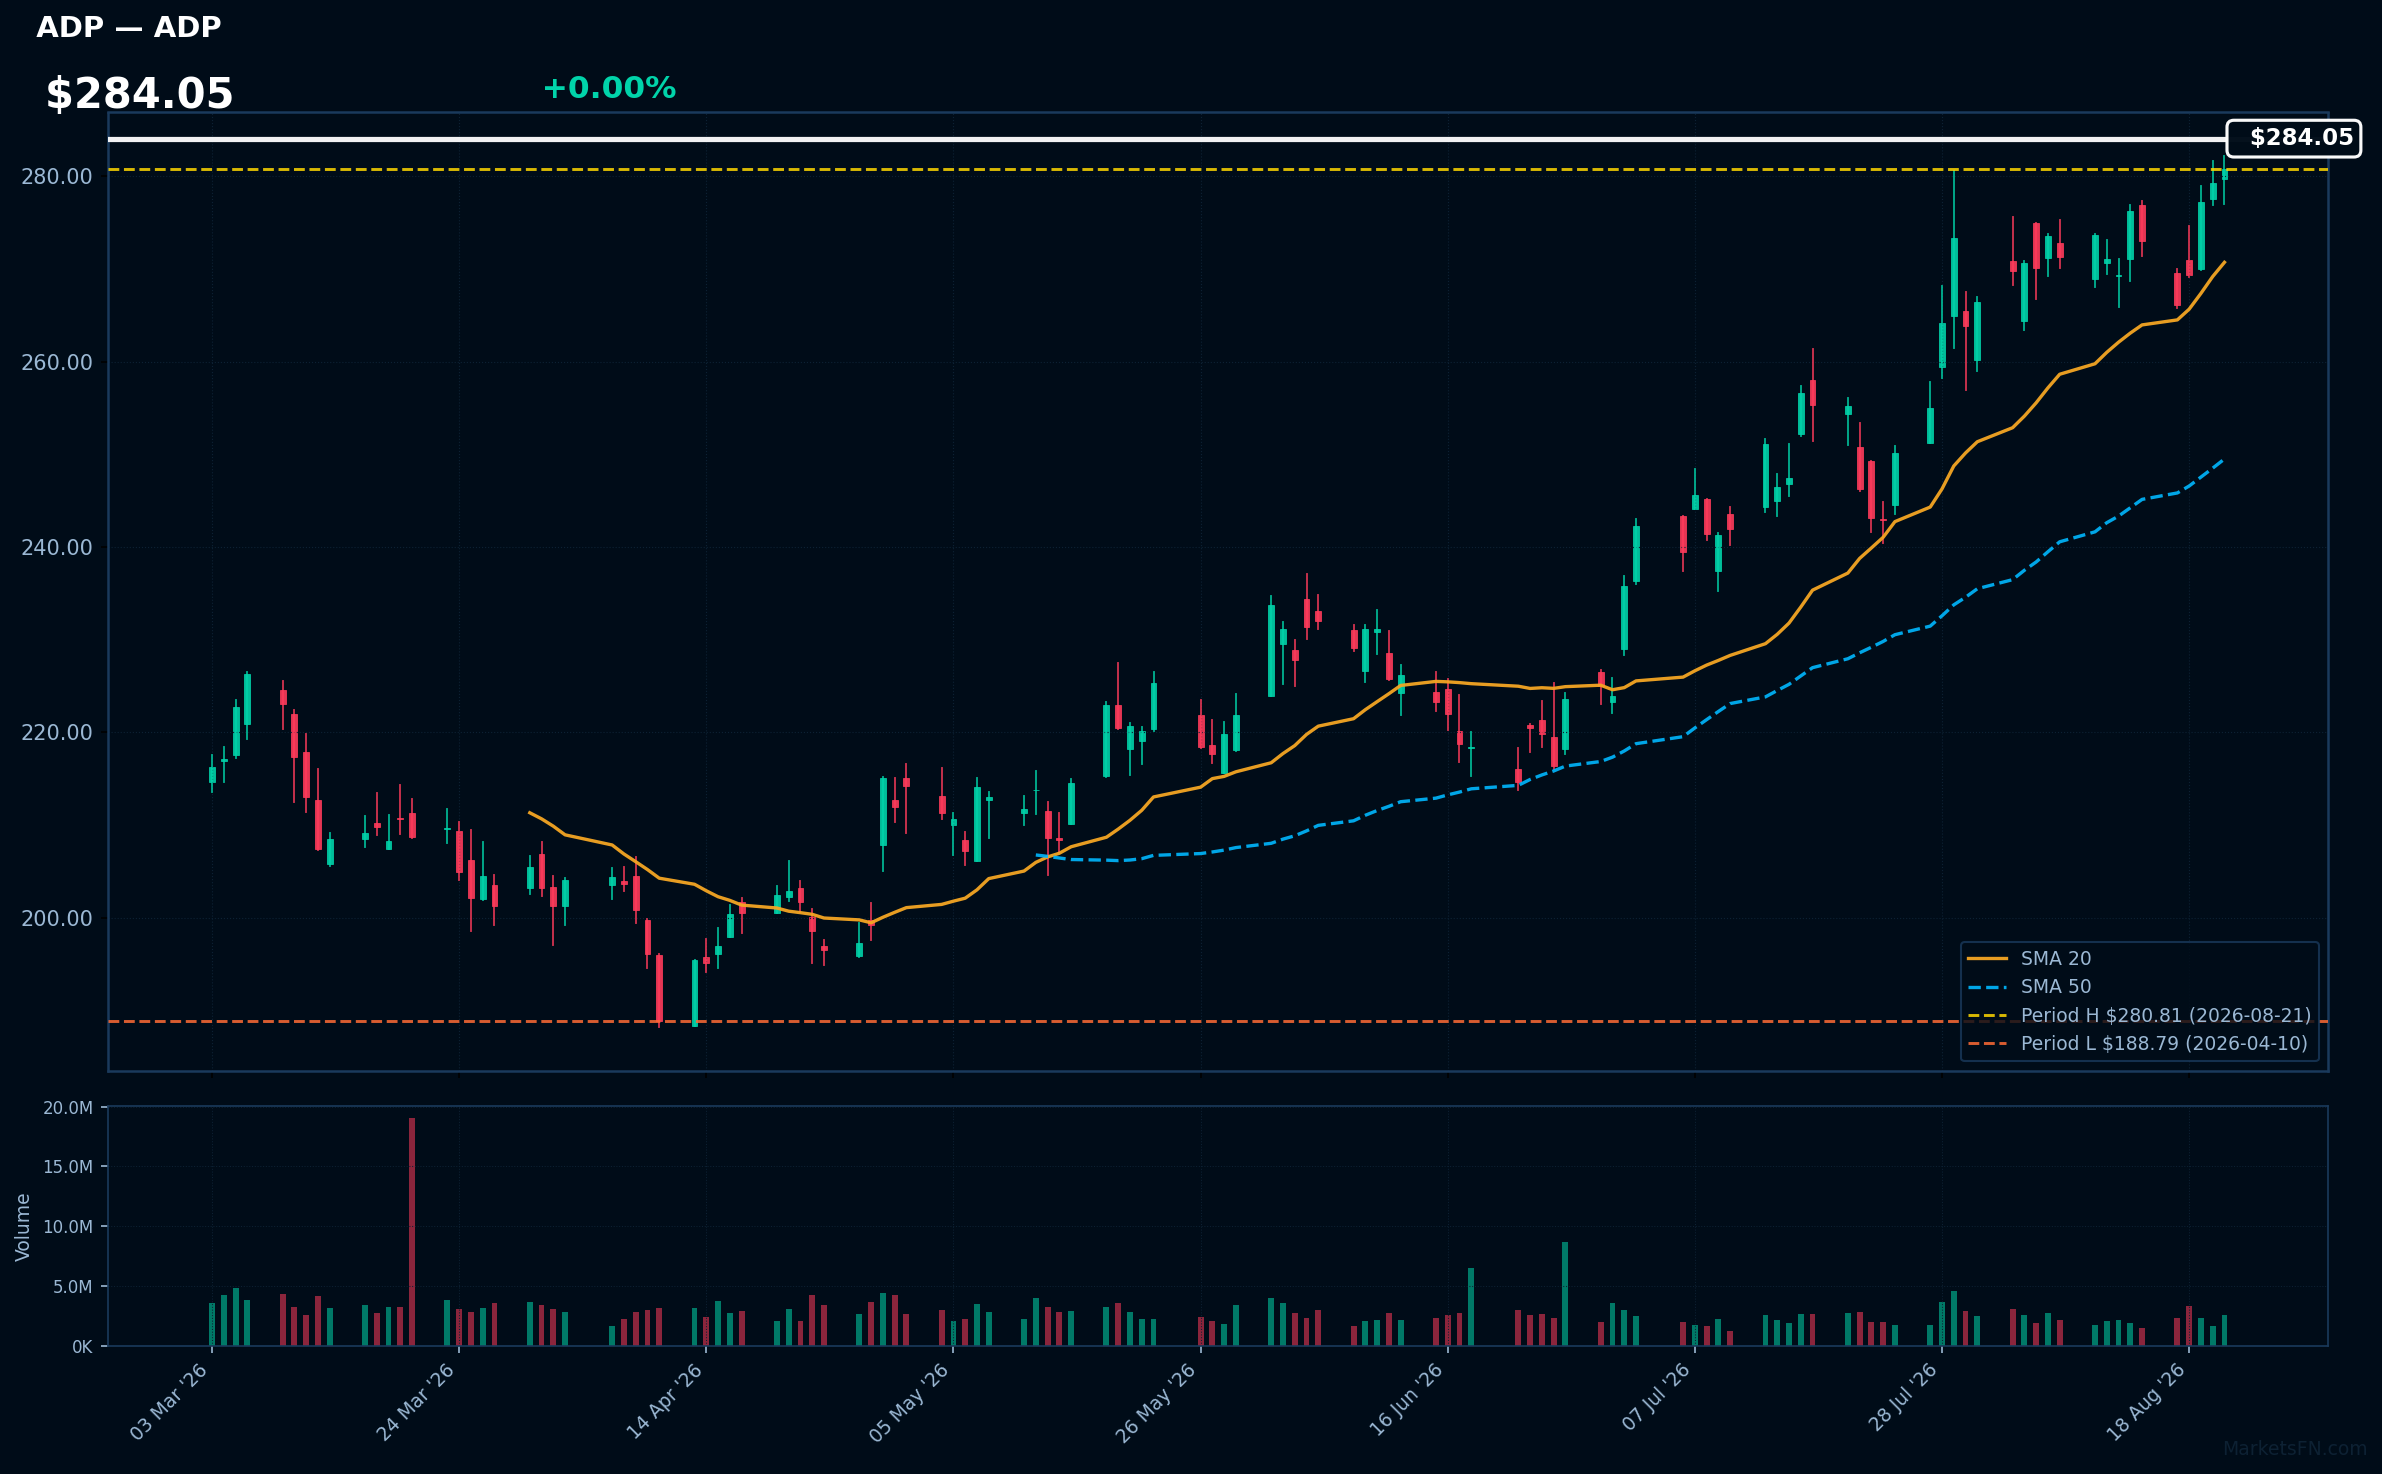
ADP | Automatic Data Processing Inc | Technology | Price Last: $280.81 | % Realized: +11.04% | RSI: 67.6 | % above MA200: +19.1% | Trend: Above MA20, MA50, MA200
Automatic Data Processing Inc (ADP) provides payroll and human capital management solutions, helping businesses streamline workforce management. Investors should care due to its strong market position and consistent demand for its services, which can drive revenue growth and stability.
The current technical situation indicates bullish momentum, with an RSI(14) of 67.6 and a bullish MA alignment: price > MA20 > MA50 > MA200. The stock is also 0.0% below its 2026 YTD high, suggesting a potential breakout.
Related headlines
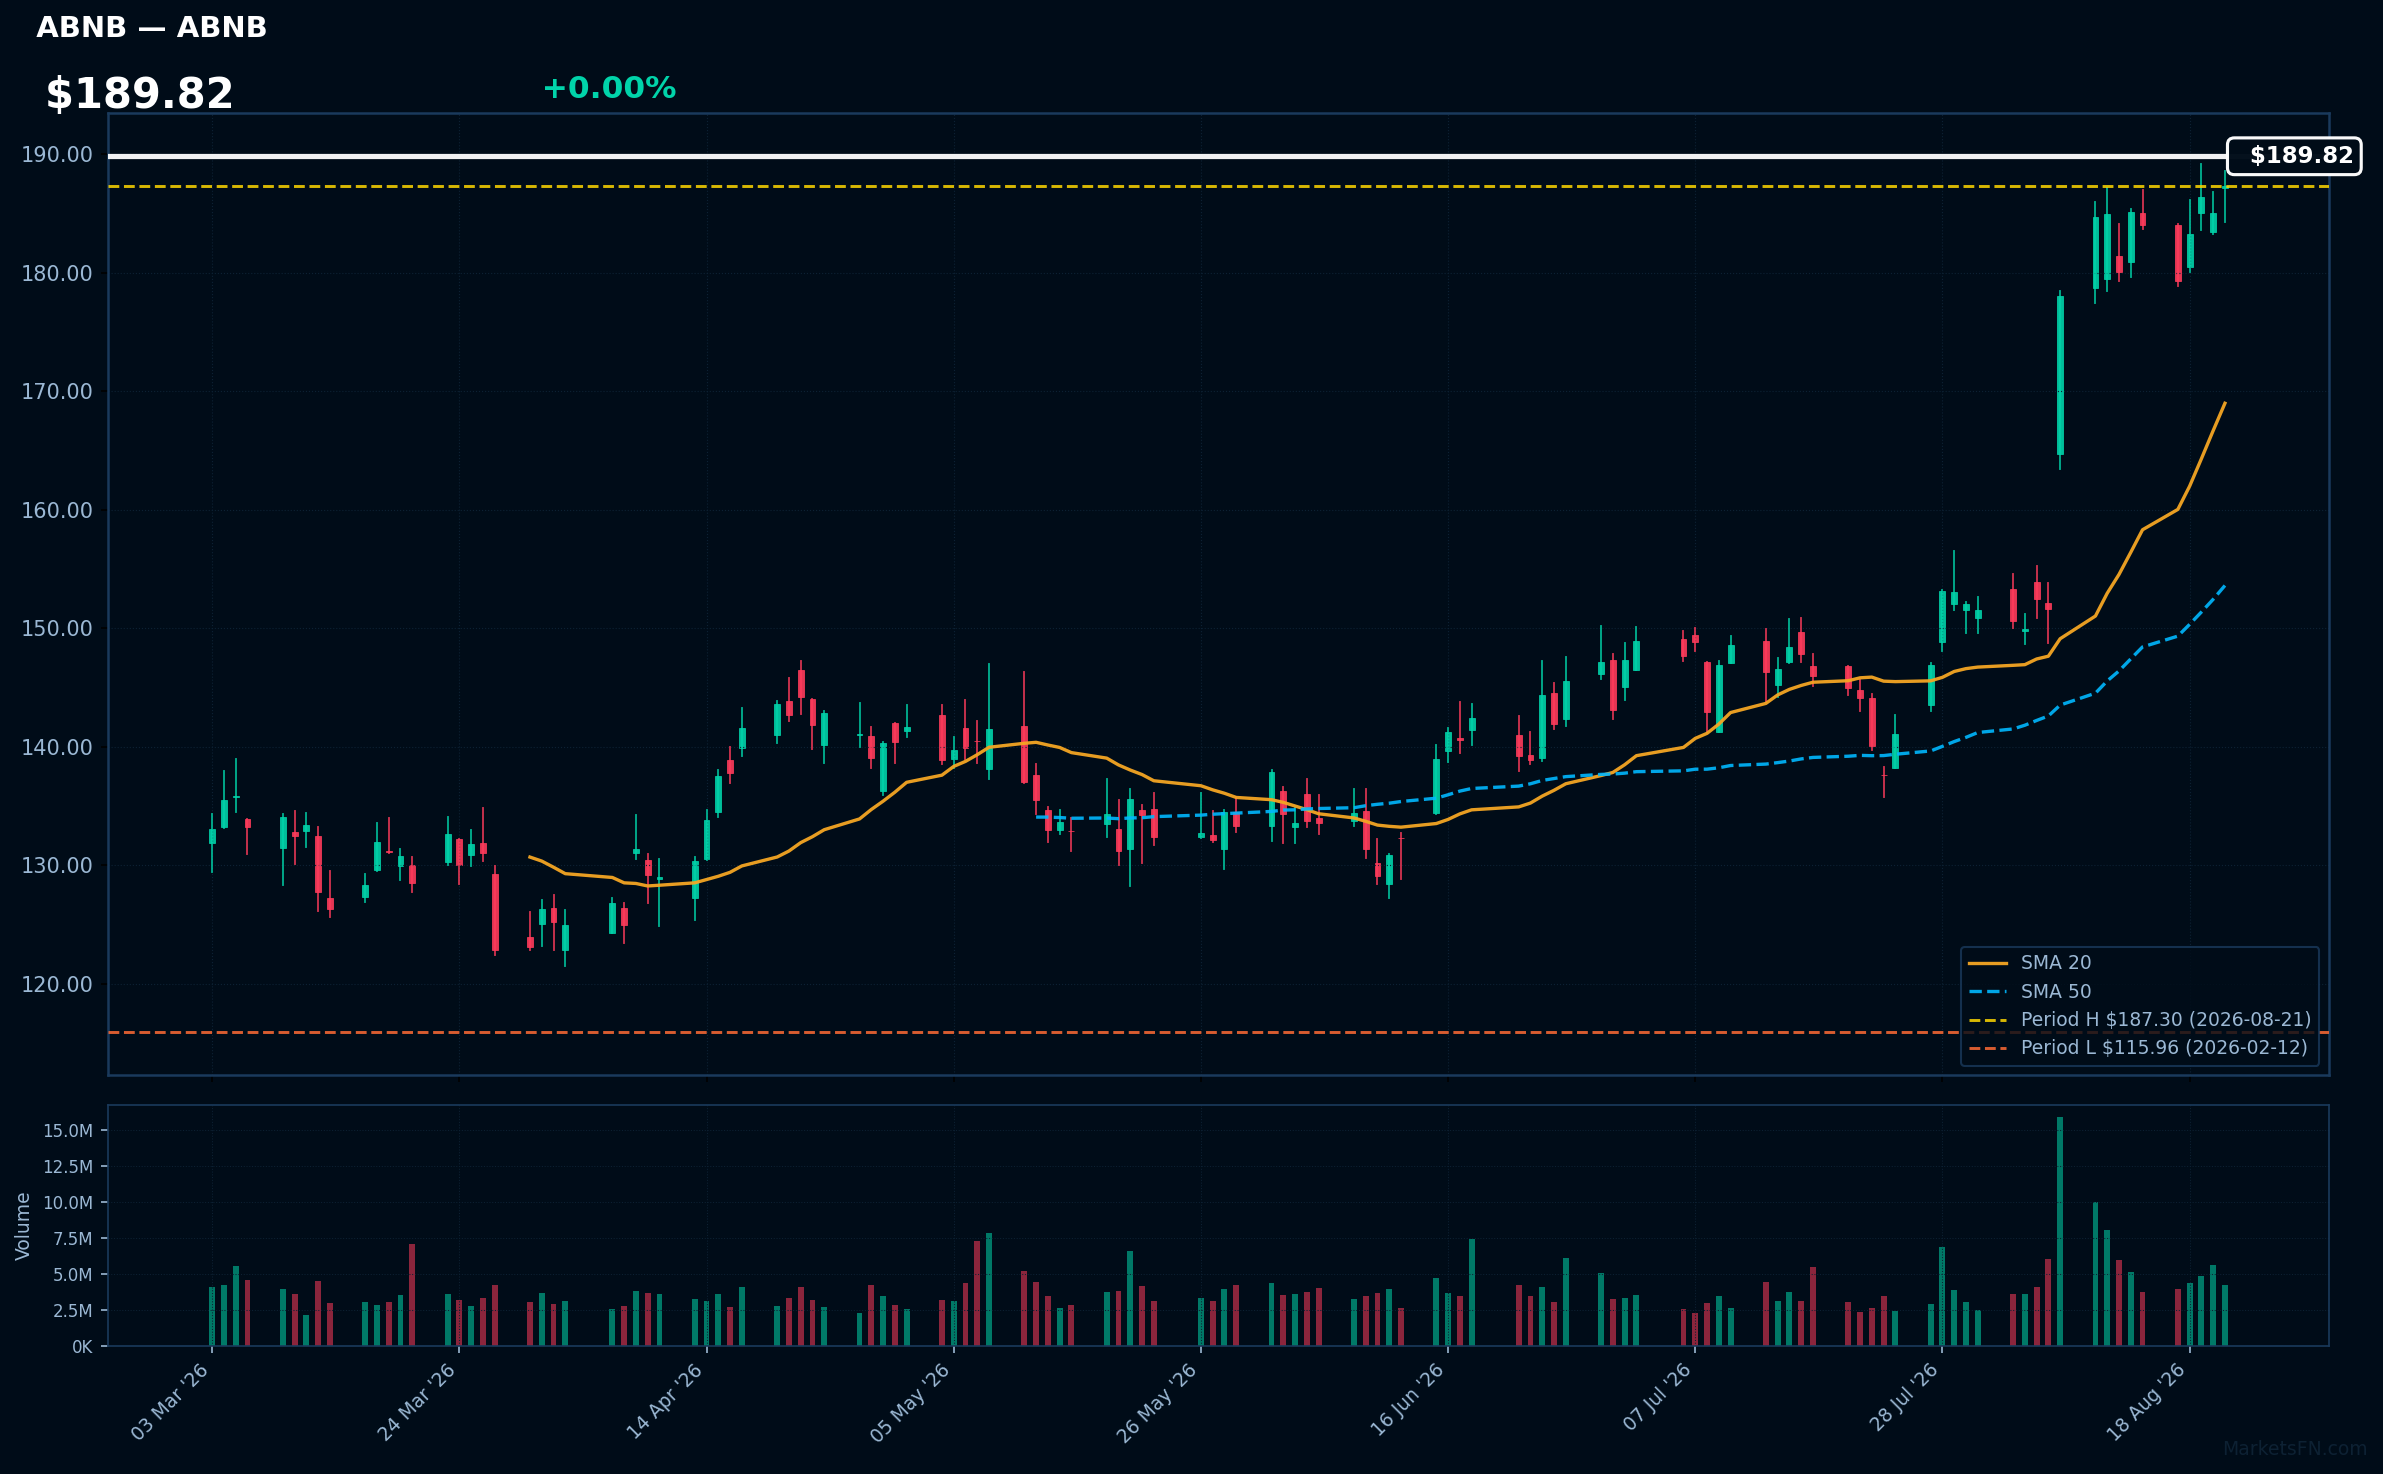
ABNB | Airbnb Inc | Consumer Cyclical | Price Last: $187.30 | % Realized: +40.82% | RSI: 73.2 | % above MA200: +37.2% | Trend: Above MA20, MA50, MA200
Airbnb Inc (ABNB) operates an online marketplace for lodging, primarily homestays for vacation rentals. Investors should care due to its innovative approach to travel accommodation, tapping into the growing demand for unique travel experiences and the potential for revenue growth in the hospitality sector.
The current technical situation indicates strong momentum, with an RSI(14) of 73.2 and a bullish MA alignment: price > MA20 > MA50 > MA200. The stock is also 0.0% below its 2026 YTD high, suggesting a potential breakout.
Related headlines
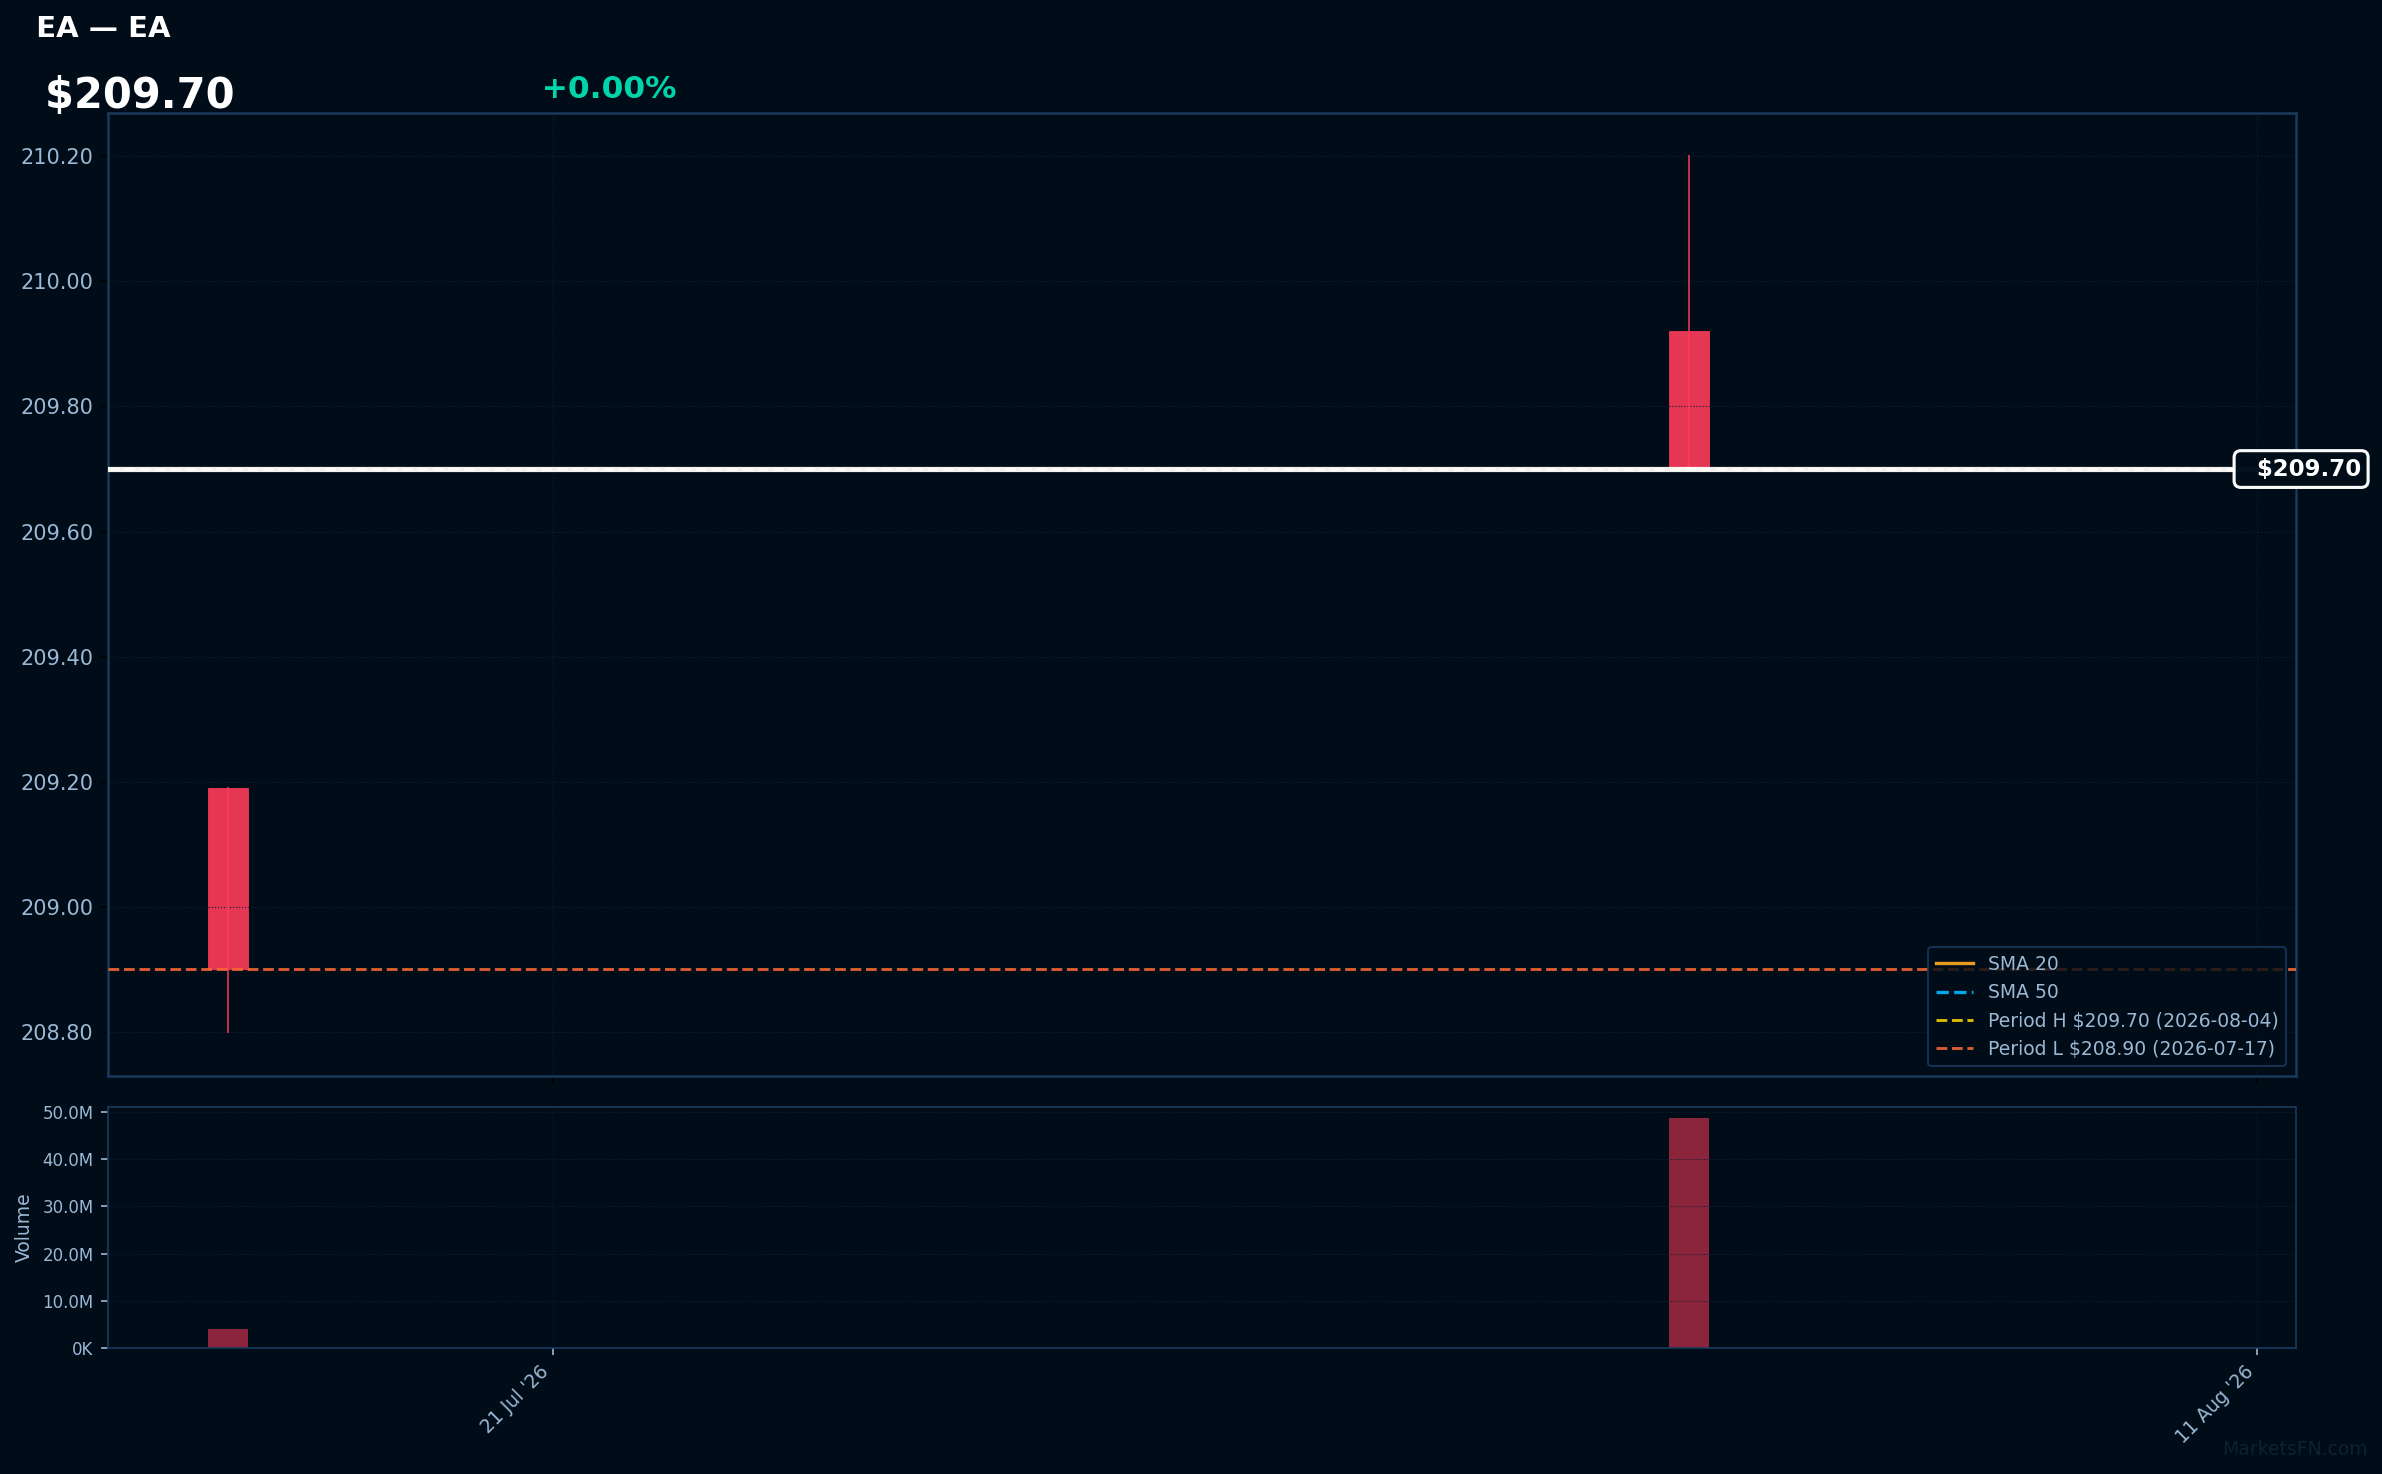
EA | Electronic Arts, Inc | Communication Services | Price Last: $209.70 | % Realized: +0.38% | RSI: — | % above MA200: — | Trend: —
Electronic Arts, Inc. develops and publishes interactive entertainment software, known for franchises like FIFA and The Sims. Investors should care due to its strong market position and potential for growth in the gaming industry, particularly with ongoing trends in digital gaming and esports.
The stock is 0.0% below its 2026 YTD high, indicating a potential breakout level. However, RSI(14) data is N/A and MA data is incomplete, limiting a comprehensive technical analysis.
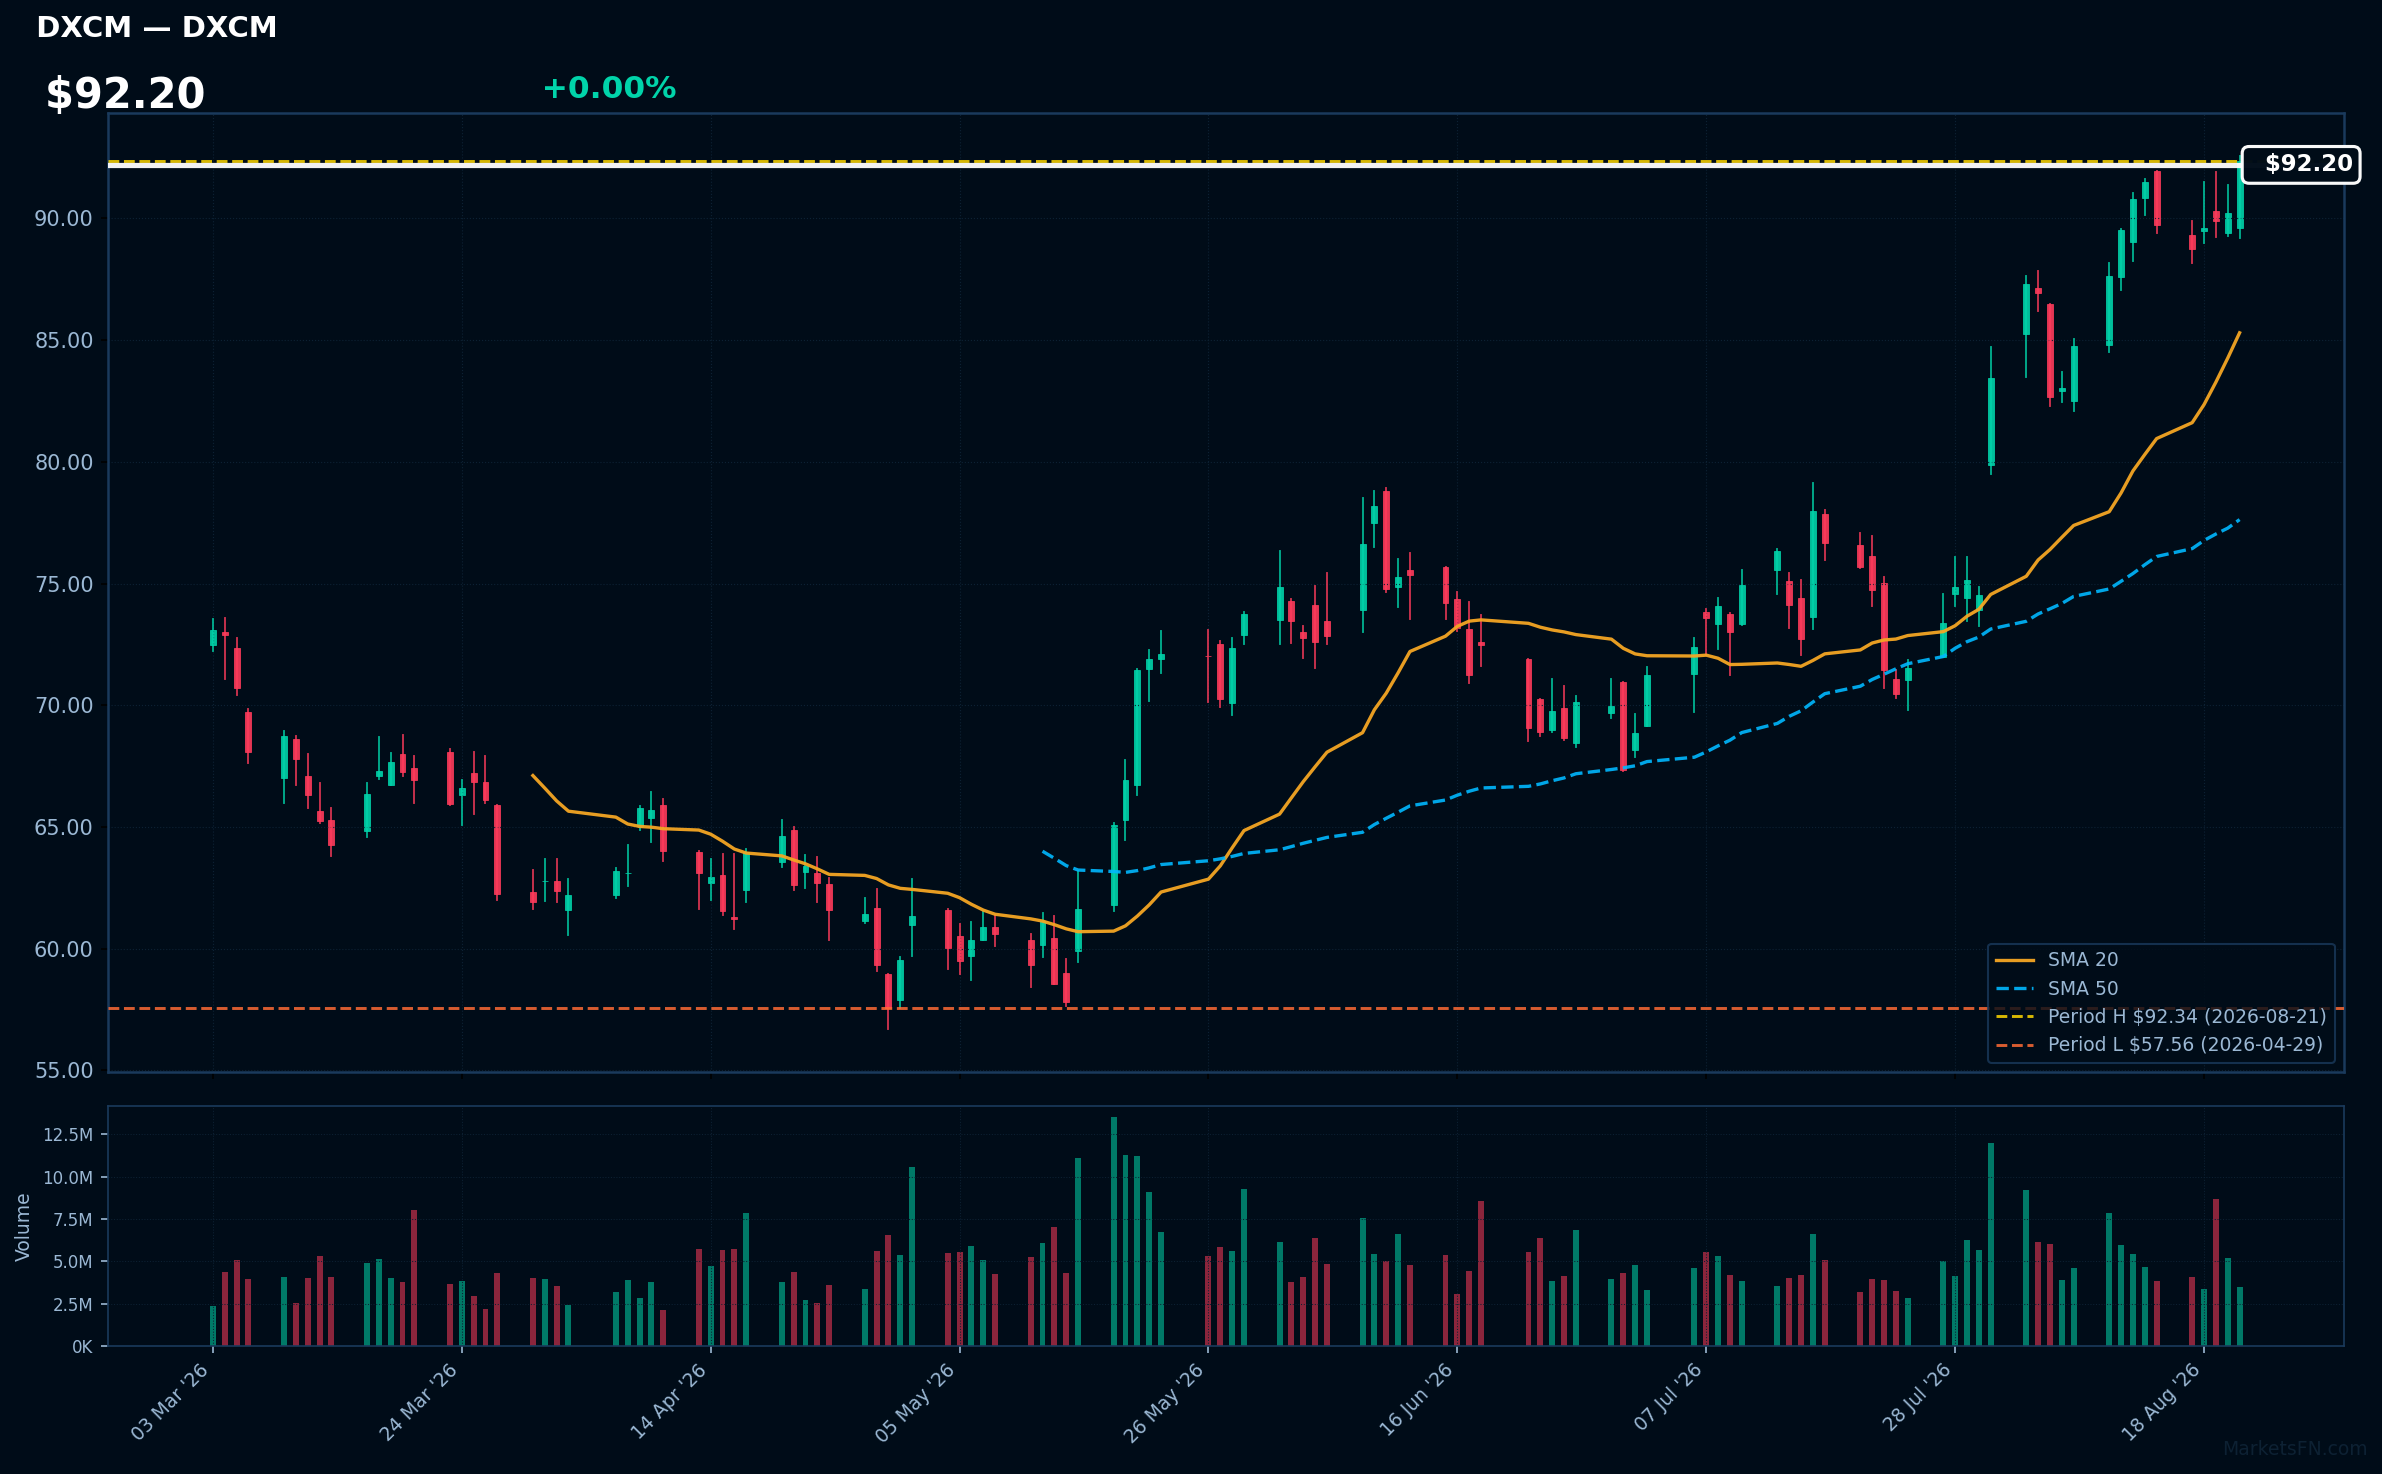
DXCM | Dexcom Inc | Healthcare | Price Last: $92.34 | % Realized: +38.77% | RSI: 69.6 | % above MA200: +32.9% | Trend: Above MA20, MA50, MA200
Dexcom Inc develops continuous glucose monitoring systems for diabetes management, providing real-time data to patients and healthcare providers. Investors should care due to the increasing prevalence of diabetes and the growing demand for innovative health technology solutions.
Dexcom's current RSI is 69.6, indicating strong momentum, while the bullish MA alignment (price > MA20 > MA50 > MA200) suggests a sustained uptrend. The stock is also 0.0% below its 2026 YTD high, indicating potential for a breakout.
Related headlines
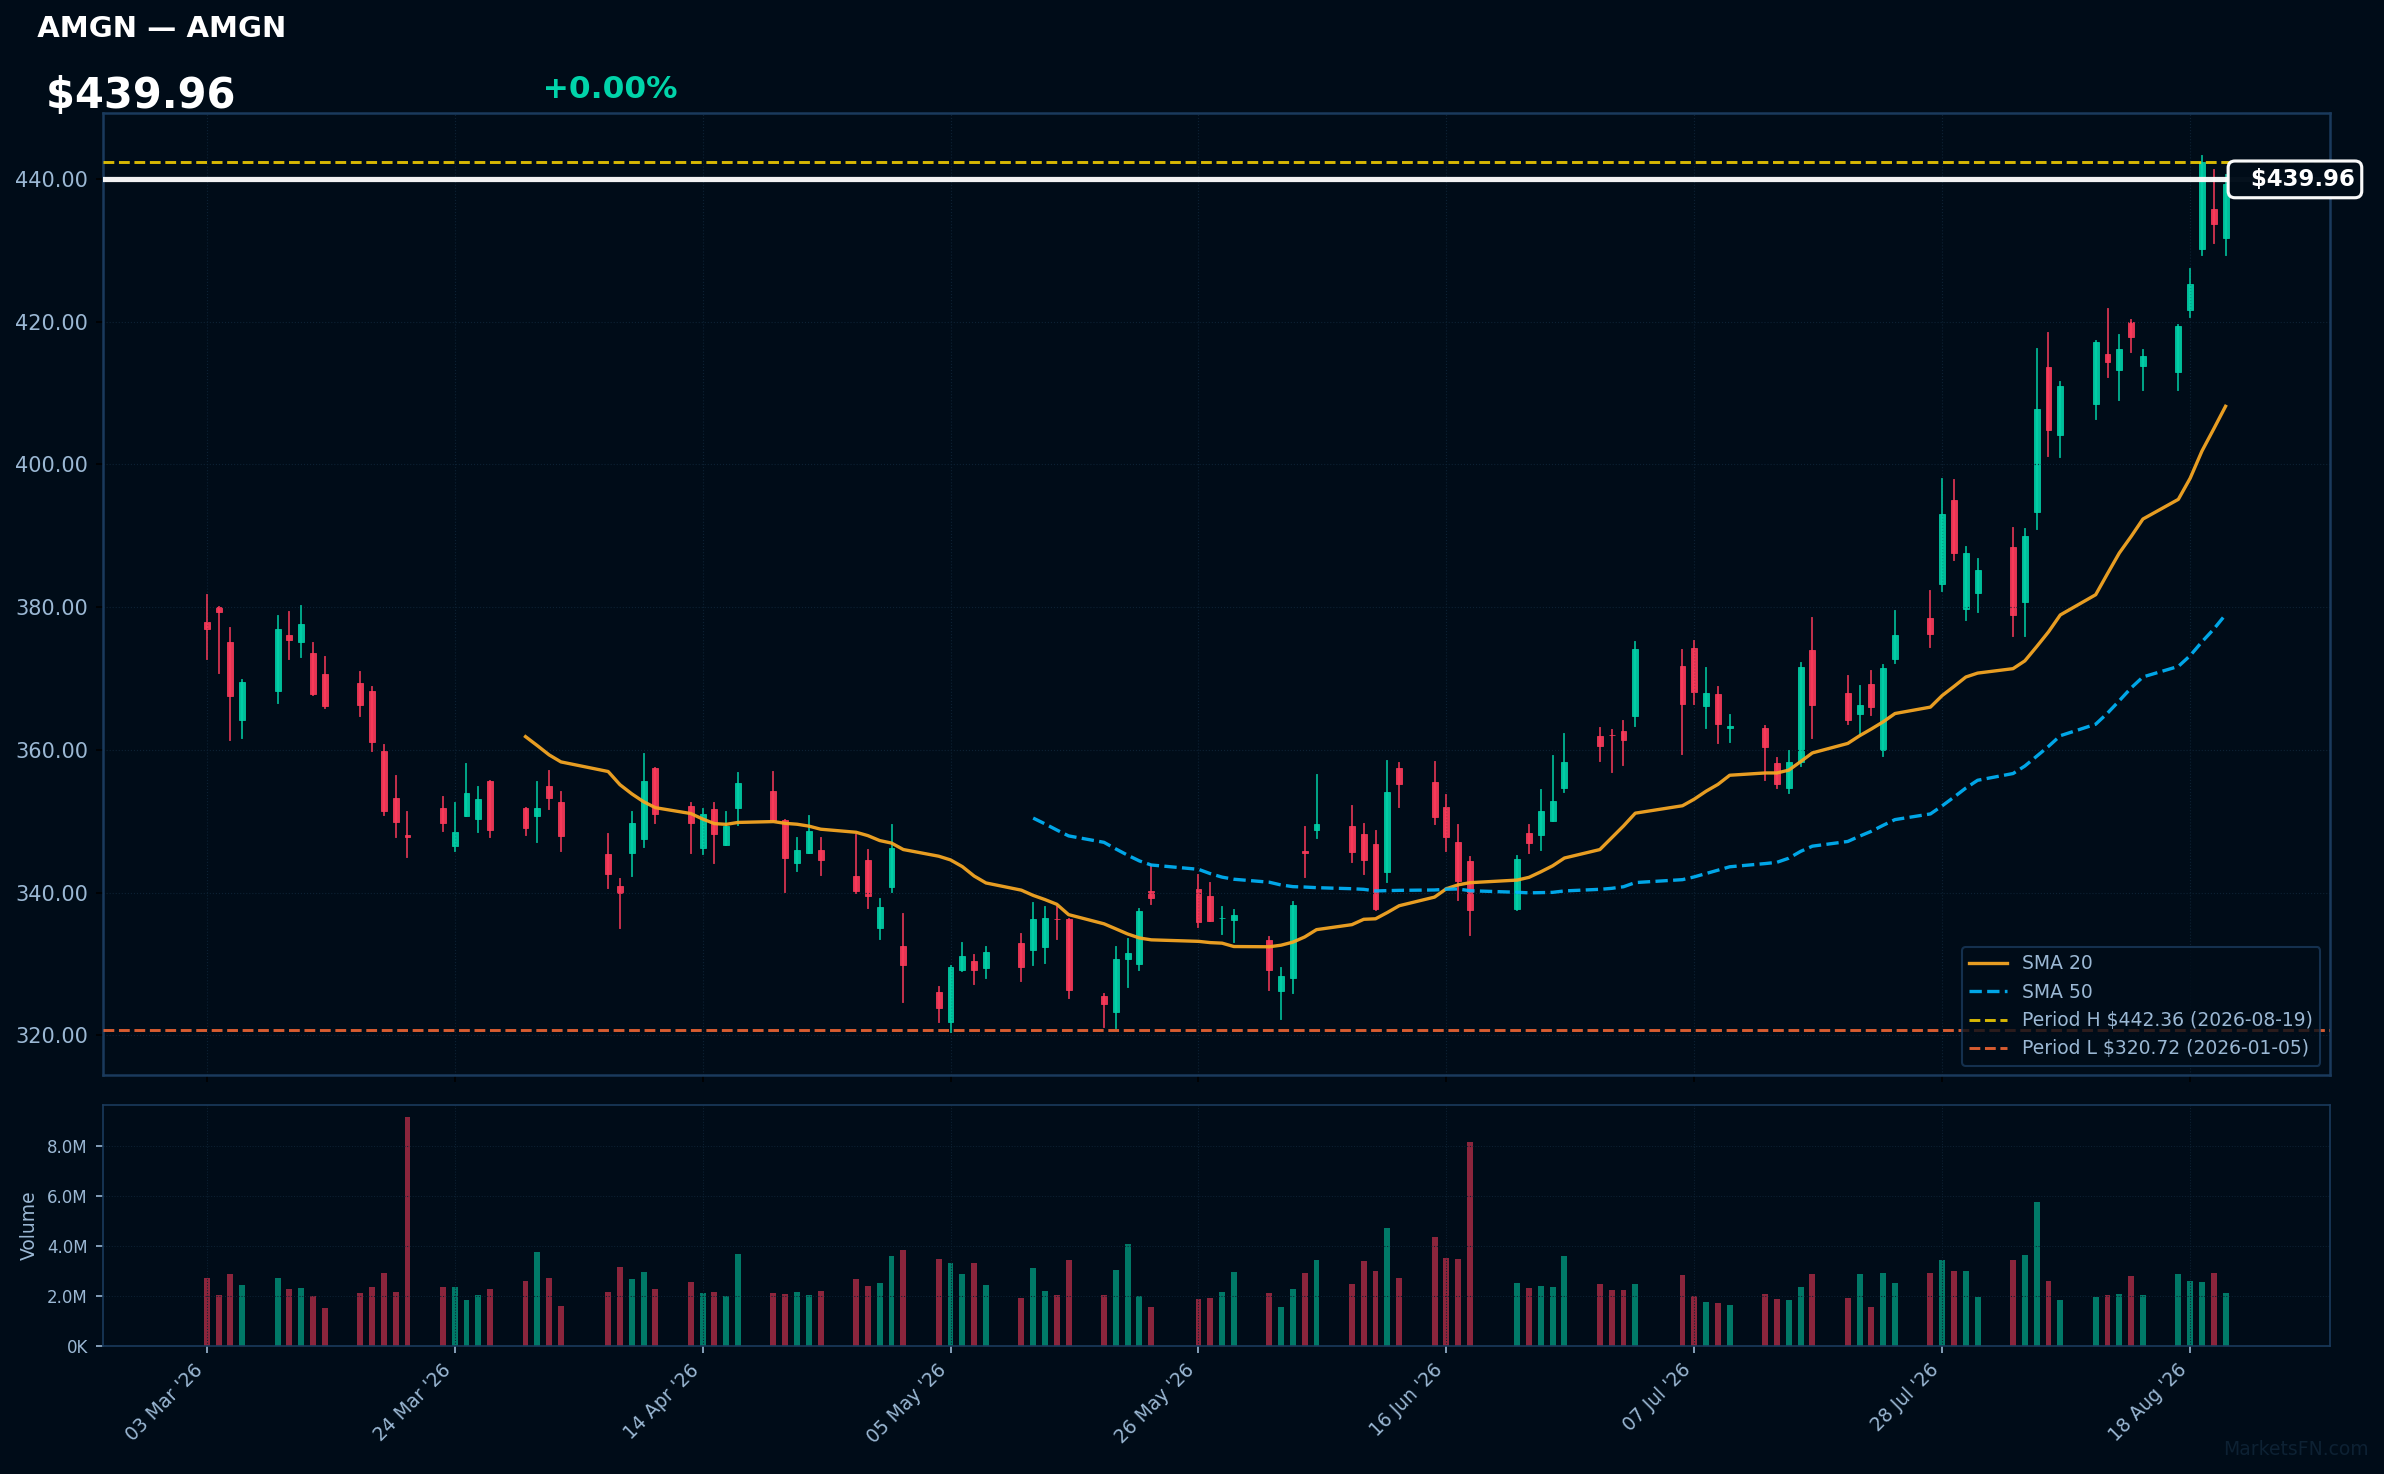
AMGN | AMGEN Inc | Healthcare | Price Last: $439.33 | % Realized: +34.09% | RSI: 73.6 | % above MA200: +24.3% | Trend: Above MA20, MA50, MA200
AMGEN Inc (AMGN) is a biotechnology company focused on developing innovative therapies for serious illnesses, particularly in oncology, nephrology, and inflammation. Investors should care due to its strong pipeline and market position, which can drive future growth and profitability.
AMGN shows bullish momentum with an RSI(14) of 73.6 and a strong MA alignment: price > MA20 > MA50 > MA200. The stock is 0.7% below its 2026 YTD high, indicating a potential breakout.
Related headlines
📉 Nearest to 2026 Low
Sectors represented: Communication Services (3), Utilities (2)
| Ticker | Company | Sector | Price Last | % Realized | 2026 YTD Low Date | RSI | % above MA200 | Trend |
|---|---|---|---|---|---|---|---|---|
| TTD | Trade Desk Inc | Communication Services | $13.18 | -65.02% | 2026-08-21 | 32.0 | -50.0% | Below MA20, MA50, MA200 |
| EA | Electronic Arts, Inc | Communication Services | $209.70 | +0.38% | 2026-07-17 | — | — | — |
| APP | Applovin Corp | Communication Services | $305.77 | -50.55% | 2026-08-12 | 28.5 | -38.7% | Below MA20, MA50, MA200 |
| EXC | Exelon Corp | Utilities | $43.78 | -0.32% | 2026-01-12 | 36.6 | -4.9% | Below MA20, MA50, MA200 |
| XEL | Xcel Energy, Inc | Utilities | $76.30 | +2.17% | 2026-01-07 | 37.2 | -3.2% | Below MA20, MA50, MA200 |
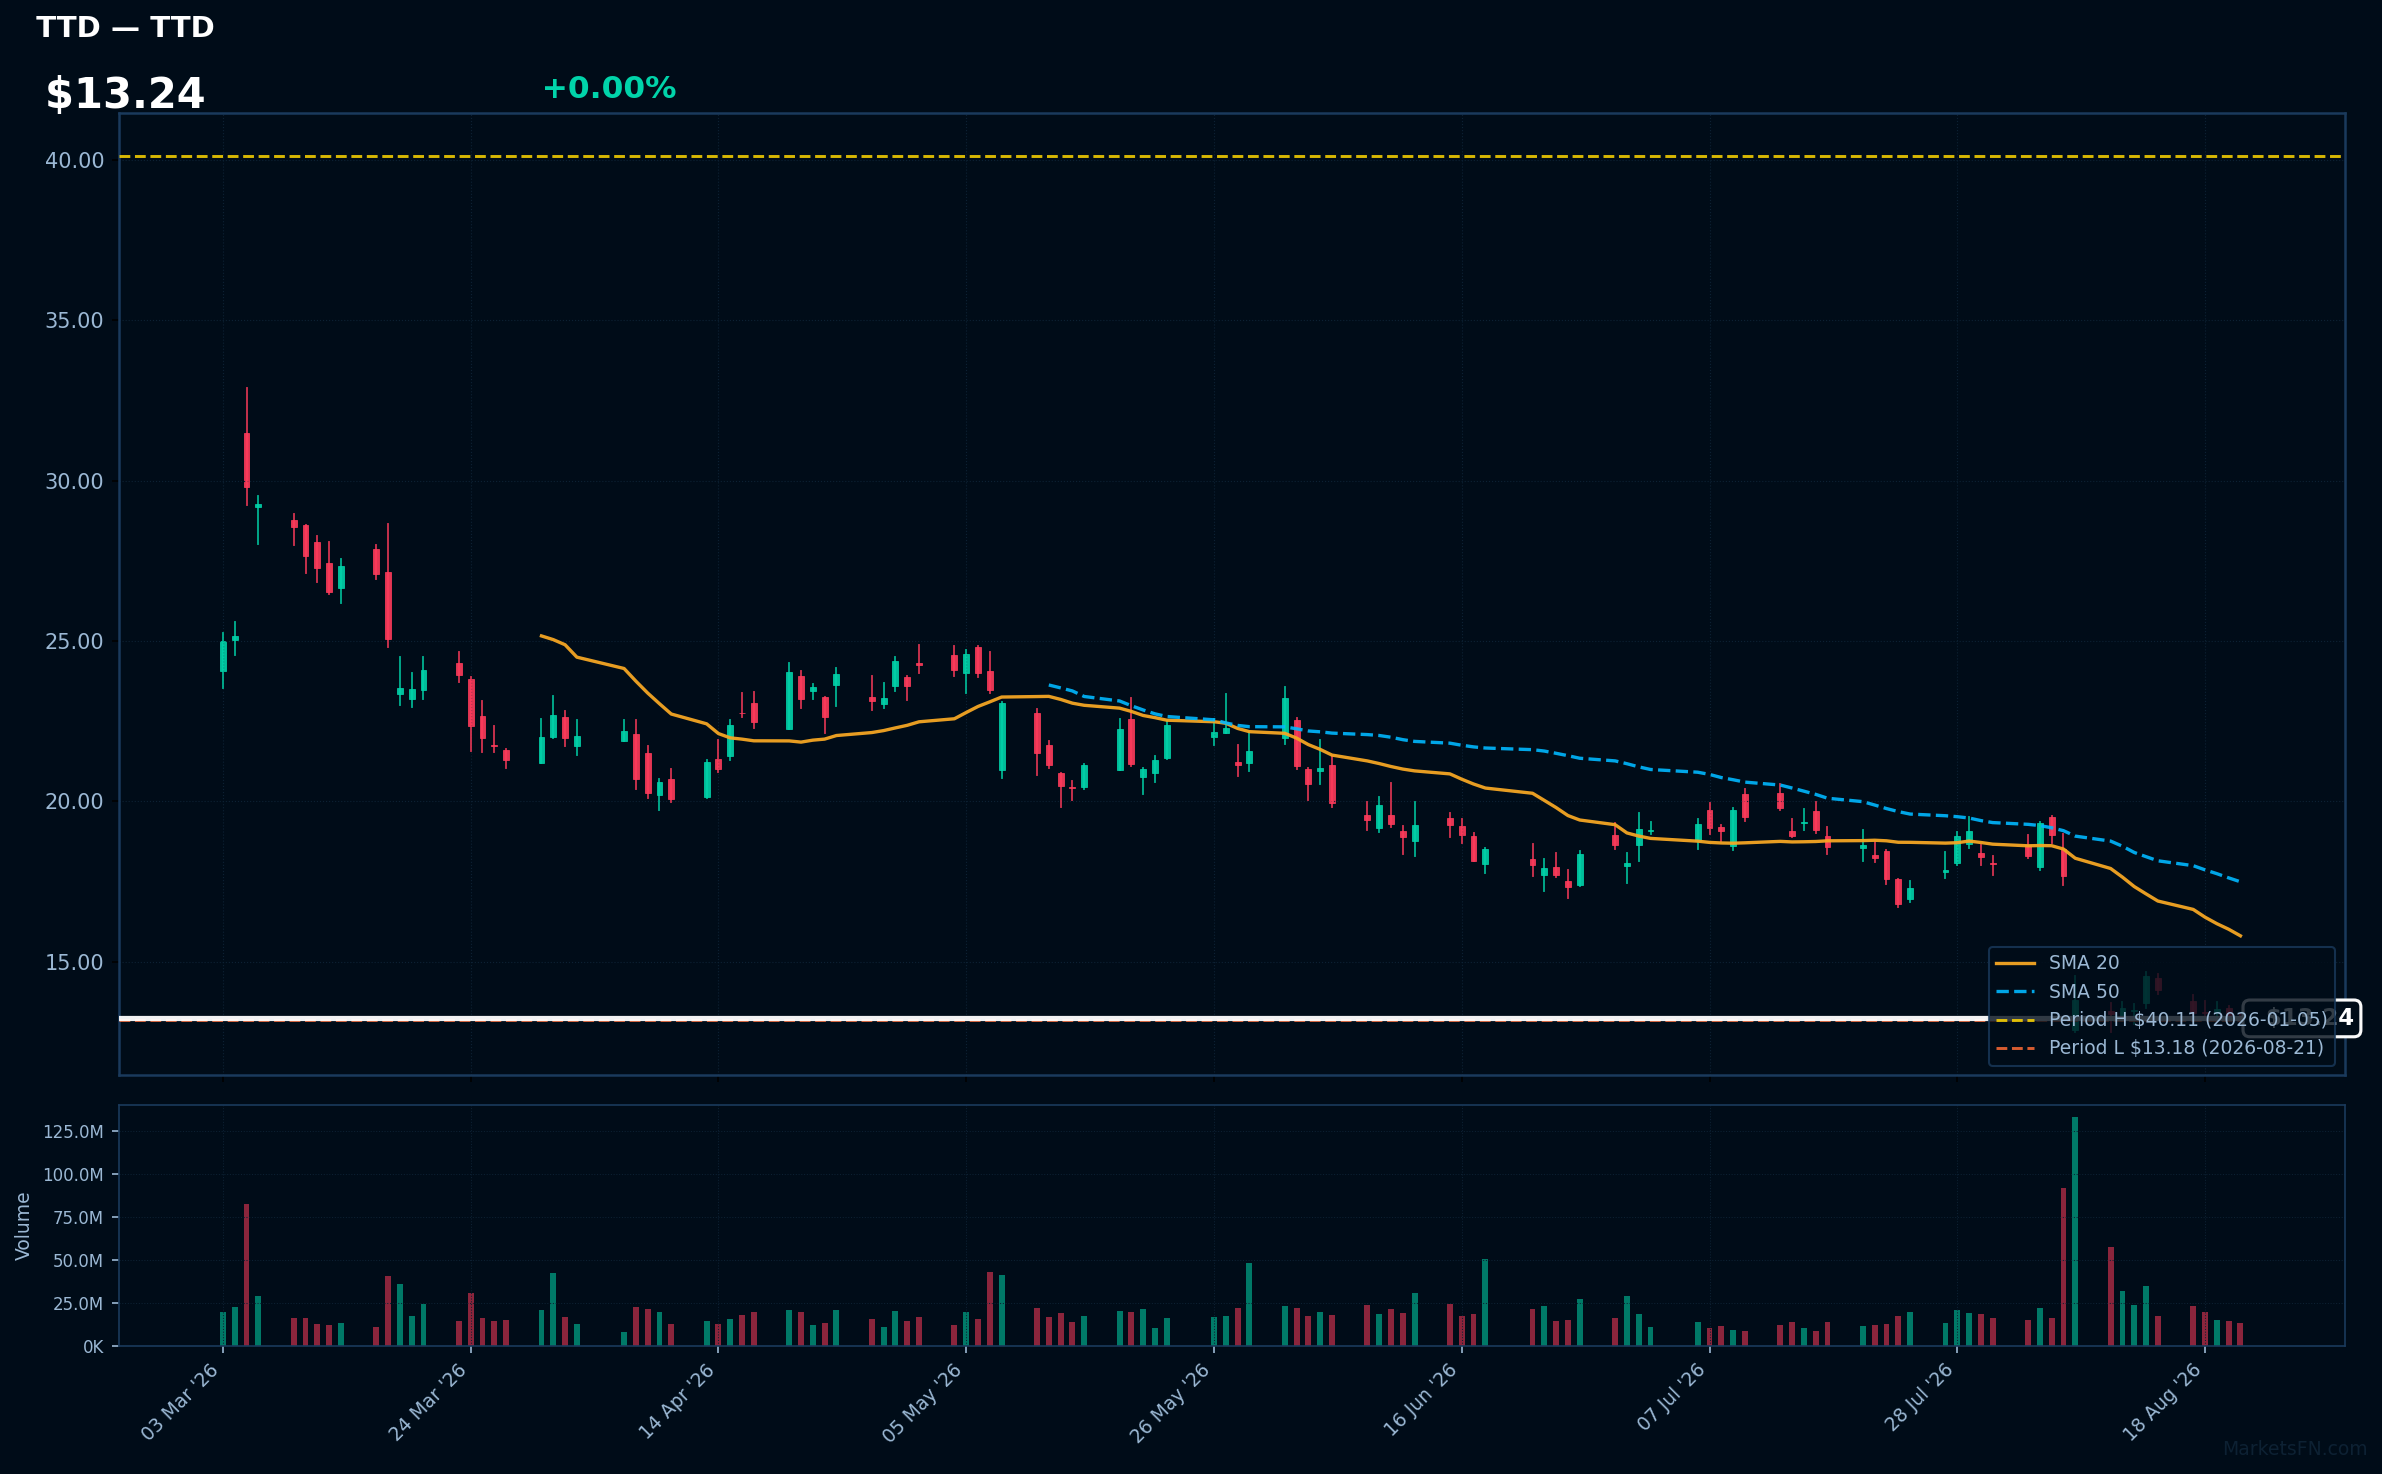
TTD | Trade Desk Inc | Communication Services | Price Last: $13.18 | % Realized: -65.02% | RSI: 32.0 | % above MA200: -50.0% | Trend: Below MA20, MA50, MA200
Trade Desk Inc (TTD) provides a technology platform for digital advertising, enabling advertisers to manage and optimize their campaigns across various channels. Investors should care due to its role in the growing programmatic advertising market, which is crucial for targeting and measuring ad effectiveness.
The current technical situation indicates a bearish trend, with an RSI(14) of 32.0 and a MA alignment showing price < MA20 < MA50 < MA200. The stock is testing major support, being only 0.0% above its 2026 YTD low.
Related headlines
EA | Electronic Arts, Inc | Communication Services | Price Last: $209.70 | % Realized: +0.38% | RSI: — | % above MA200: — | Trend: —
Electronic Arts, Inc. develops and publishes interactive entertainment software, known for franchises like FIFA and The Sims. Investors should care due to its strong market position and potential for growth in the gaming industry, particularly with ongoing trends in digital gaming and esports.
The stock is 0.0% below its 2026 YTD high, indicating a potential breakout level. However, RSI(14) data is N/A and MA data is incomplete, limiting a comprehensive technical analysis.
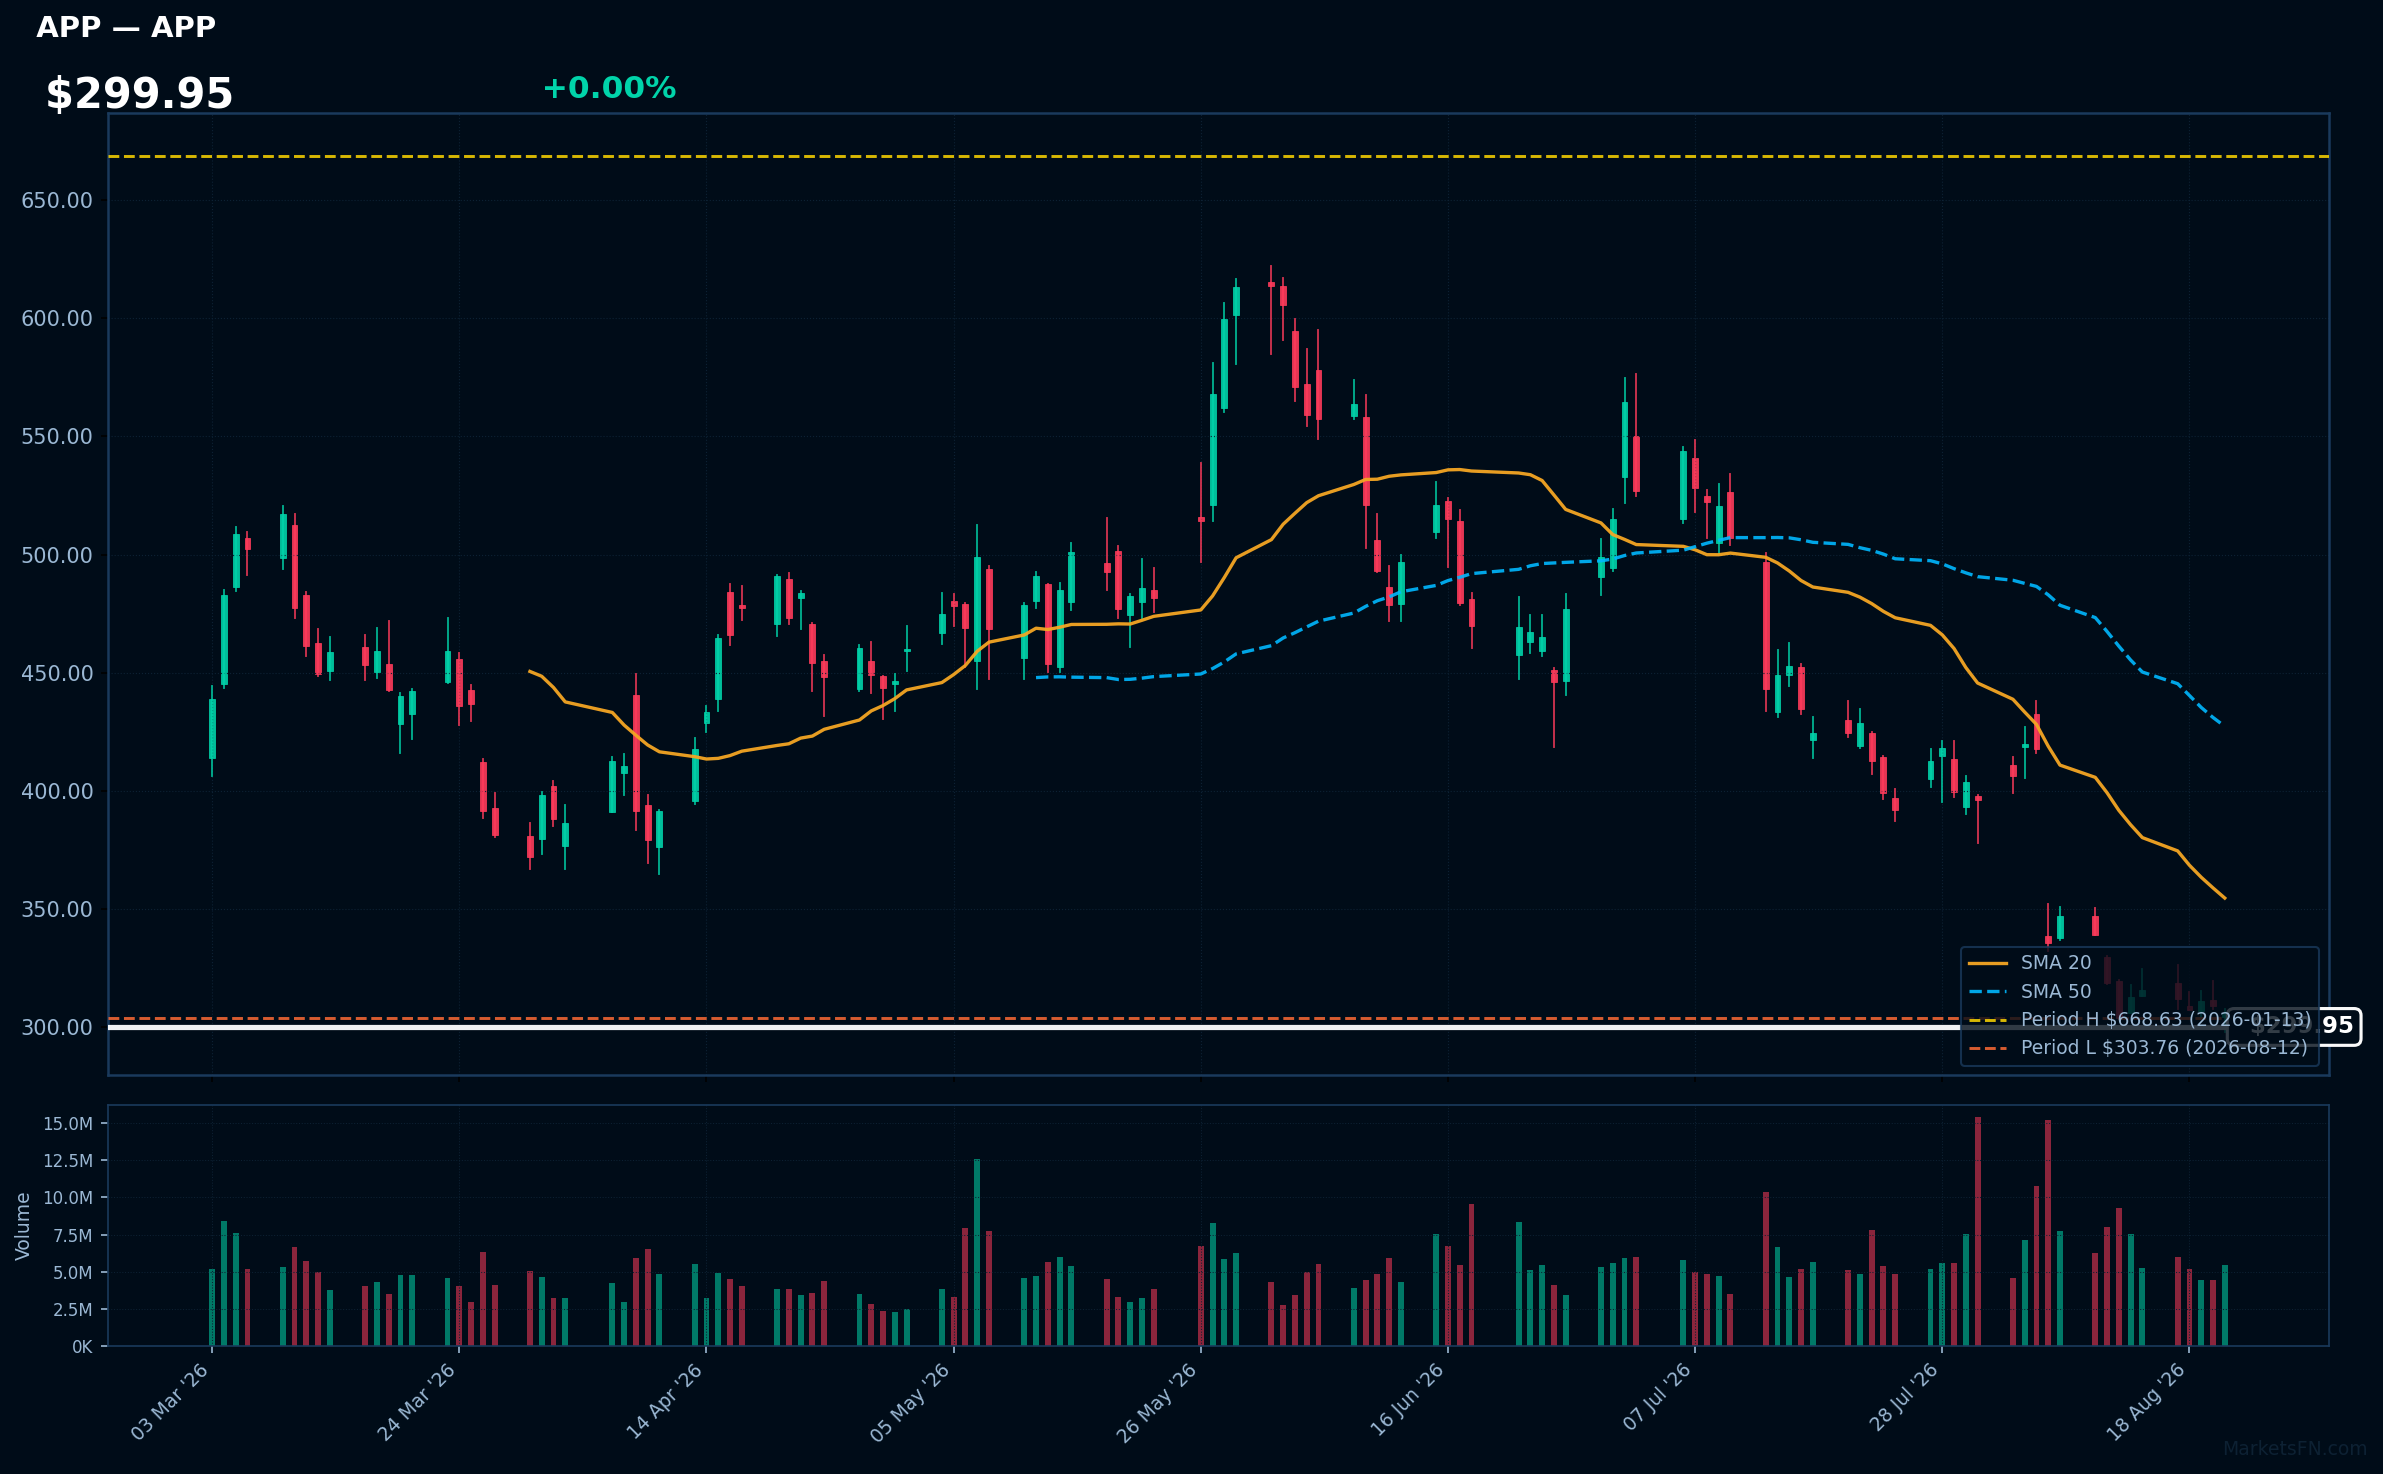
APP | Applovin Corp | Communication Services | Price Last: $305.77 | % Realized: -50.55% | RSI: 28.5 | % above MA200: -38.7% | Trend: Below MA20, MA50, MA200
Applovin Corp (APP) specializes in mobile app marketing and monetization solutions, enabling developers to optimize user acquisition and maximize revenue. Investors should care due to its significant market presence and potential for growth in the expanding mobile app ecosystem.
The current technical situation indicates a bearish trend, with an RSI(14) of 28.5 and a MA alignment of price < MA20 < MA50 < MA200, suggesting sustained downtrend and testing major support just 0.7% above its 2026 YTD low.
Related headlines
- Why Did APP, CMS, MVIS Stocks Plunge To 52-Week Lows Last Week?
- APP Stock Dips Below $300 For First Time In Over A Year Analyst Cuts Target By $60, But Believes Business Remains High Quality
- AppLovin sentiment turns negative as bull case grows harder to find, Jefferies says
- Why Did FVRR, APP, GPRO Stocks Plunge To 52-Week Lows On Wednesday?
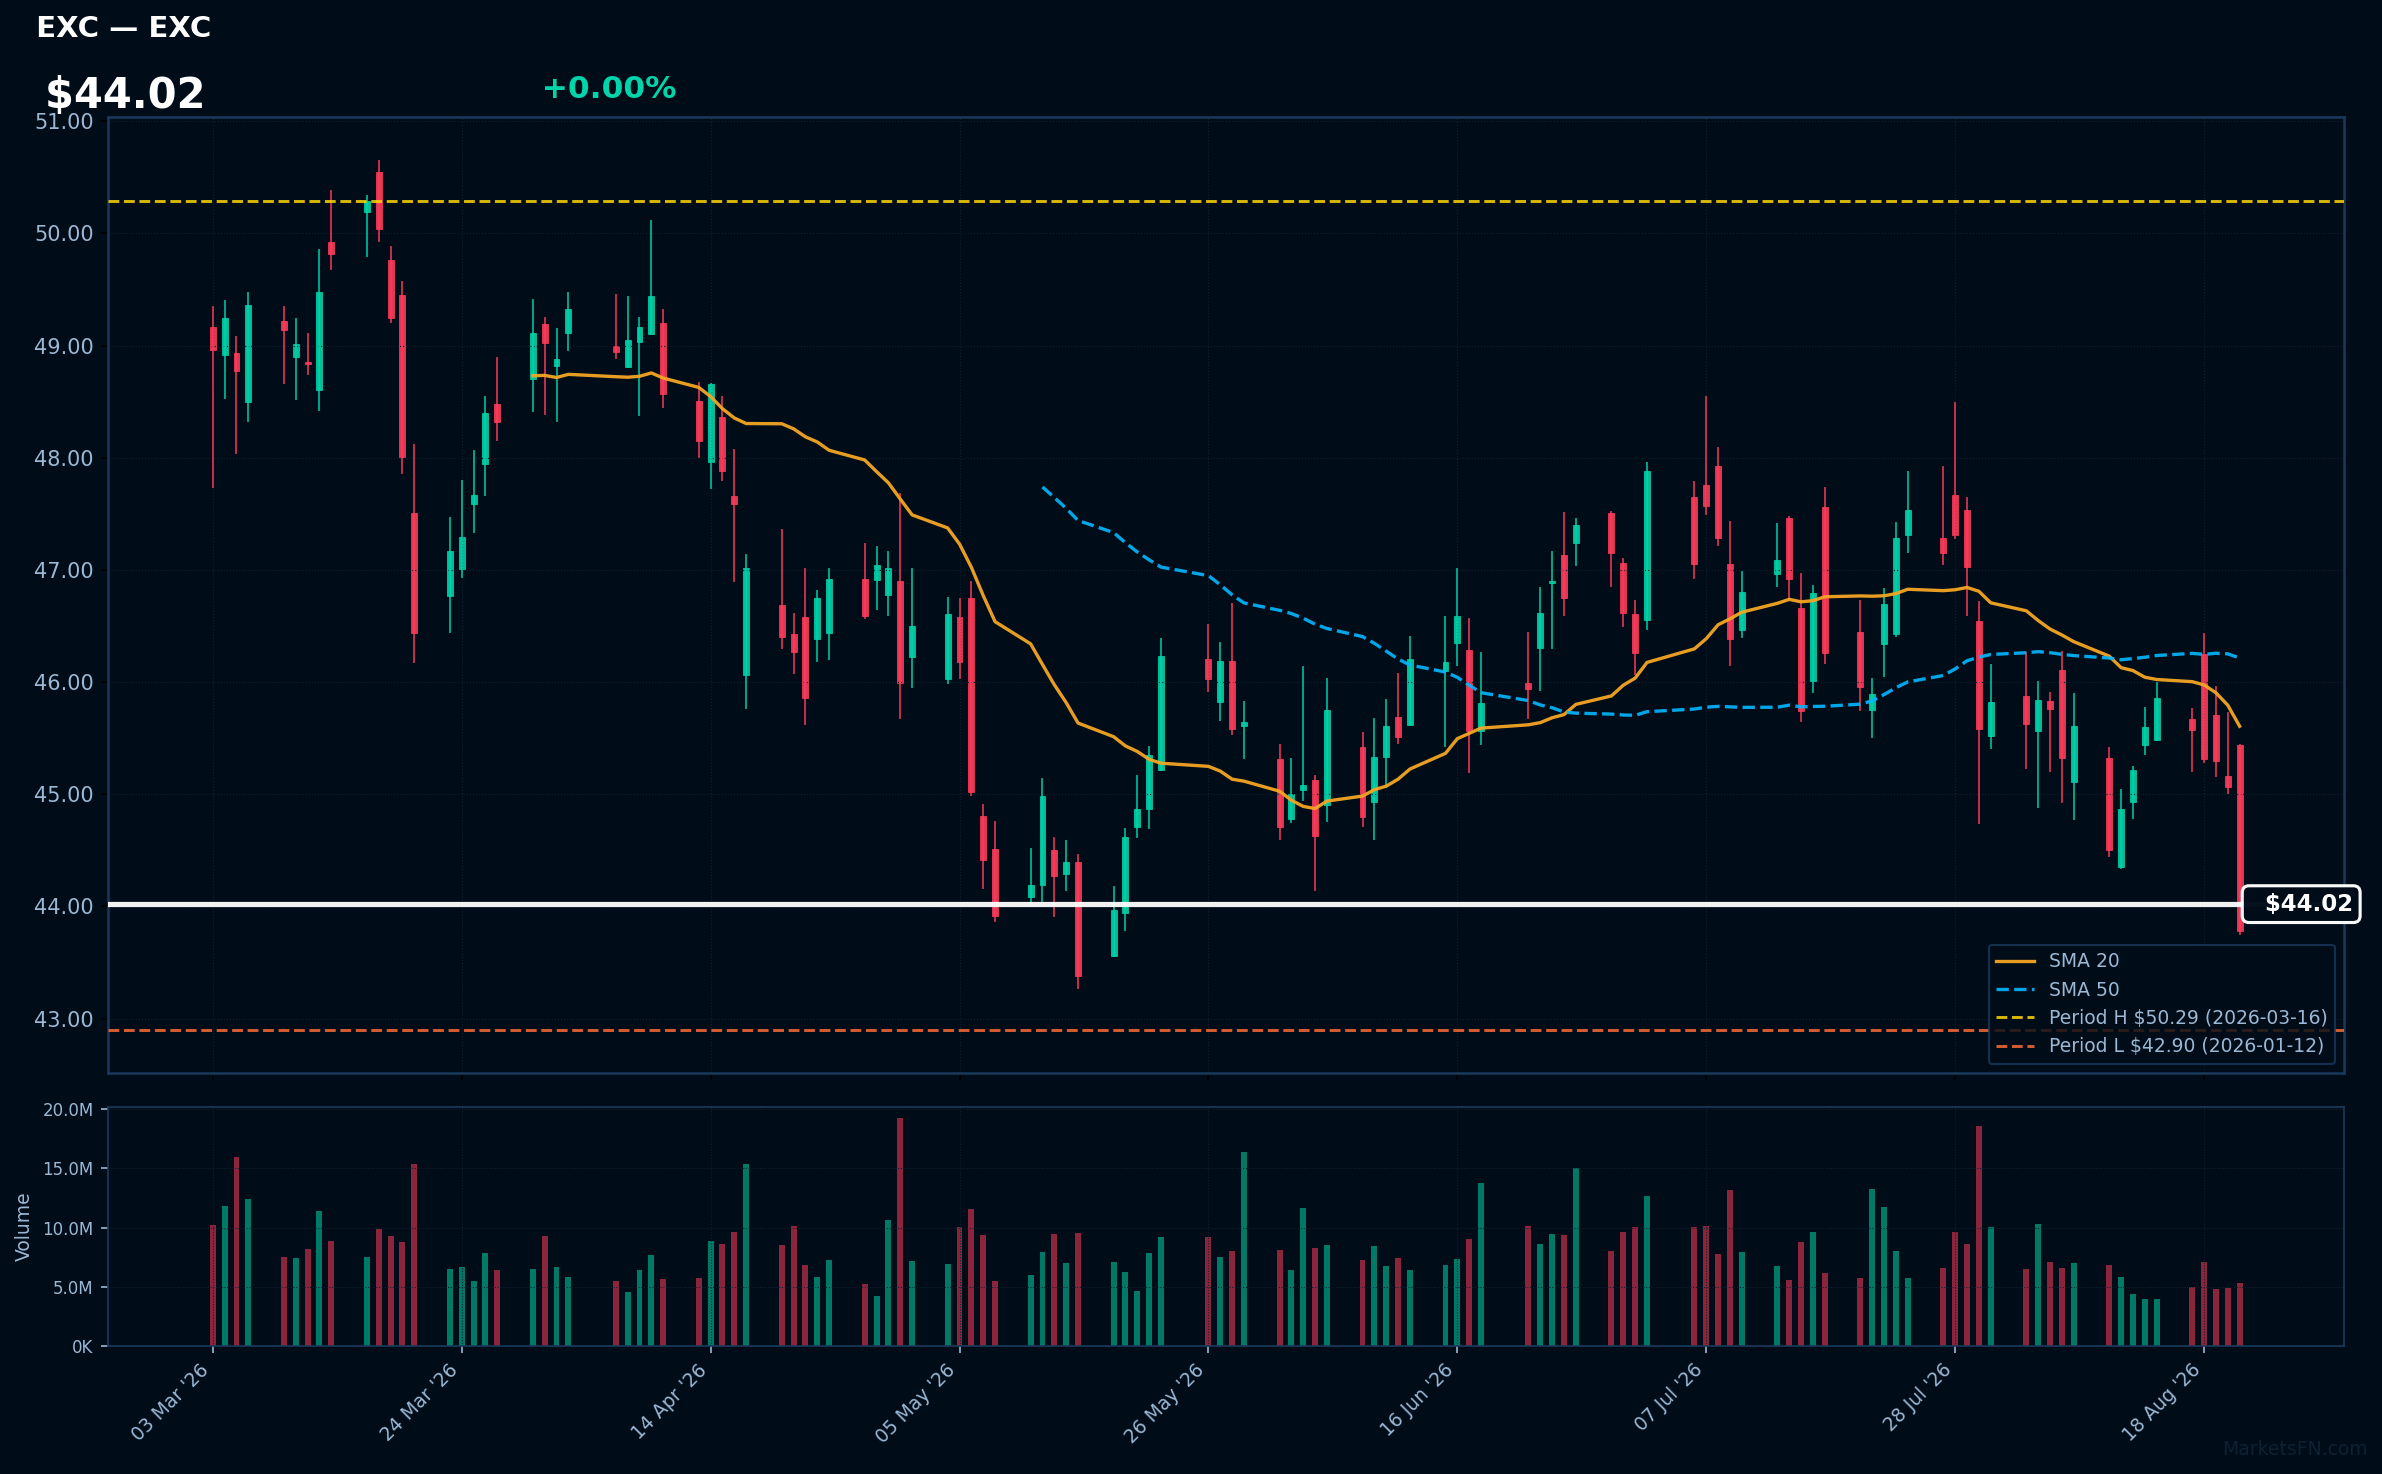
EXC | Exelon Corp | Utilities | Price Last: $43.78 | % Realized: -0.32% | RSI: 36.6 | % above MA200: -4.9% | Trend: Below MA20, MA50, MA200
Exelon Corp (EXC) is a leading energy provider, focusing on nuclear power generation and renewable energy solutions. Investors should care due to its significant role in the transition to clean energy and its potential for stable cash flows in a changing energy landscape.
Currently, EXC shows mixed signals with an RSI(14) of 36.6, indicating potential oversold conditions. The stock is below MA20, MA50, and MA200, suggesting a warning sign as it tests major support, being only 2.1% above its 2026 YTD low.
Related headlines
- Exelon Secures More Than $1 Billion in Customer Protections Through Pioneering Transmission Security Agreements
- Exelon high probability data center load falls 40%
- Exelon Corp (EXC) (Q2 2026) Earnings Call Highlights: Navigating Regulatory Hurdles and Data ...
- Exelon Corporation Q2 2026 Earnings Call Summary
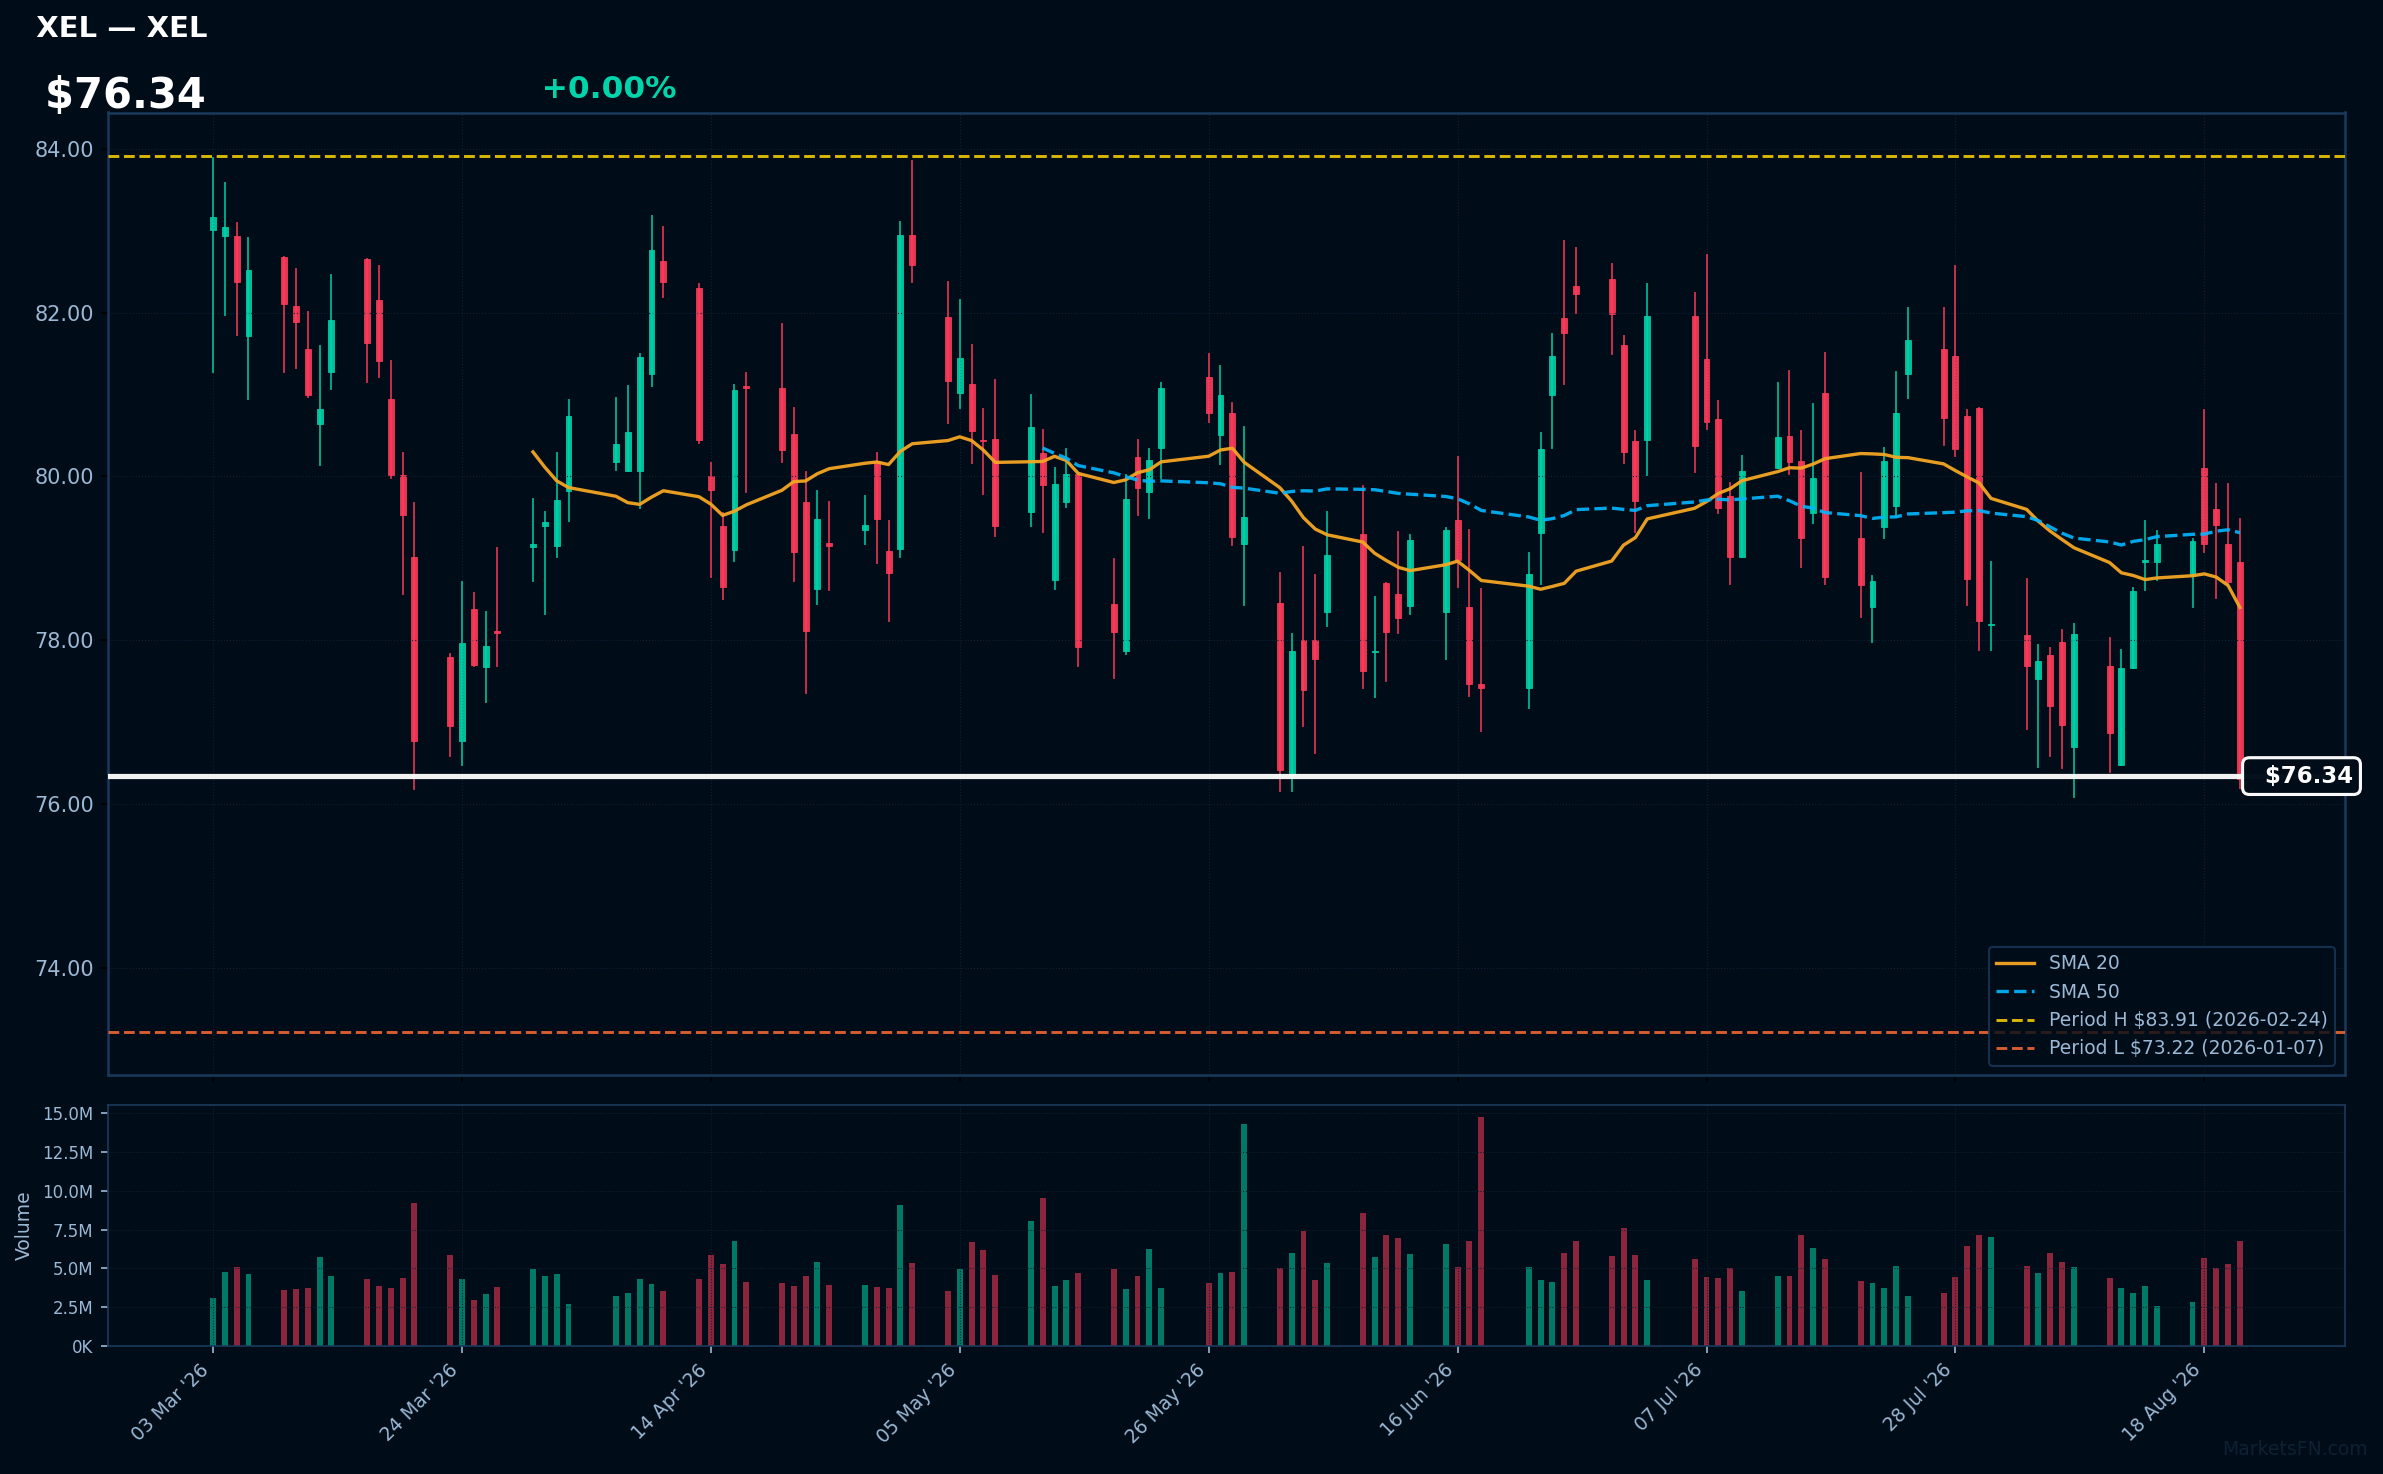
XEL | Xcel Energy, Inc | Utilities | Price Last: $76.30 | % Realized: +2.17% | RSI: 37.2 | % above MA200: -3.2% | Trend: Below MA20, MA50, MA200
Xcel Energy, Inc (XEL) is a utility company providing electricity and natural gas services across eight states. Investors should care due to its focus on renewable energy and commitment to reducing carbon emissions, positioning it well for future regulatory and market trends.
The current technical situation shows mixed signals with an RSI(14) of 37.2, indicating potential weakness. The stock is below MA20/MA50/MA200 and is only 4.2% above its 2026 YTD low, testing major support.
Related headlines
Market Commentary
The proximity of certain Nasdaq 100 stocks to their 2026 year-to-date extremes indicates significant market momentum and investor sentiment. Stocks like ADP, ABNB, EA, and DXCM are at their highs, suggesting strong demand and confidence in their growth prospects. Conversely, stocks near their lows, such as TTD and APP, reflect potential challenges or market corrections, highlighting a divergence in performance within the tech sector.
Current technology sector themes include innovation in digital services and healthcare, as evidenced by the strong performance of companies like DXCM and EA. Macro conditions, such as interest rate fluctuations and inflation concerns, are also influencing investor behavior. The resilience of certain tech stocks amidst these challenges suggests a focus on companies with robust business models and growth potential, even in a volatile economic environment.
Investors and traders should closely monitor earnings reports and guidance from these companies, as they can provide insights into future performance. Additionally, macroeconomic indicators, including inflation rates and Federal Reserve policies, will be crucial in shaping market sentiment. Keeping an eye on the performance of stocks near their highs and lows will help identify potential investment opportunities and risks in the evolving tech landscape.
Methodology: All 101 Nasdaq 100 constituents screened. Close prices downloaded from 2026-01-01. Period high = highest close since Jan 1 2026; period low = lowest close since Jan 1 2026. Distance = (current price / period extreme − 1) × 100. Technical indicators computed on up to 1 year of daily OHLCV data.
Disclaimer: For informational purposes only. Not investment advice. Past performance is not indicative of future results.

