Nasdaq 100 2026 YTD Highs & Lows Radar: Automatic Data Processing (ADP), Netflix (NFLX) and more
MarketsFN Team

Screening all 101 Nasdaq 100 constituents for stocks nearest to their 2026 year-to-date high and their 2026 YTD low. Data as of October 21, 2026. % Realized = total return since Jan 1 2026.
Legend: RSI > 70 = overbought · RSI < 30 = oversold · Green % Realized = positive YTD return · Red = negative.
📈 Nearest to 2026 High
Sectors represented: Technology (2), Consumer Defensive (2), Industrials (1)
| Ticker | Company | Sector | Price Last | % Realized | 2026 YTD High Date | RSI | % above MA200 | Trend |
|---|---|---|---|---|---|---|---|---|
| ADP | Automatic Data Processing Inc | Technology | $292.75 | +15.77% | 2026-10-20 | 72.6 | +22.4% | Above MA20, MA50, MA200 |
| CTAS | Cintas Corporation | Industrials | $217.03 | +17.39% | 2026-10-20 | 70.6 | +14.7% | Above MA20, MA50, MA200 |
| TEAM | Atlassian Corporation | Technology | $221.11 | +42.87% | 2026-10-20 | 68.6 | +91.6% | Above MA20, MA50, MA200 |
| CCEP | Coca-Cola Europacific Partners Plc | Consumer Defensive | $113.41 | +28.57% | 2026-10-20 | 67.6 | +13.6% | Above MA20, MA50, MA200 |
| KDP | Keurig Dr Pepper Inc | Consumer Defensive | $34.63 | +24.88% | 2026-10-20 | 67.8 | +16.4% | Above MA20, MA50, MA200 |
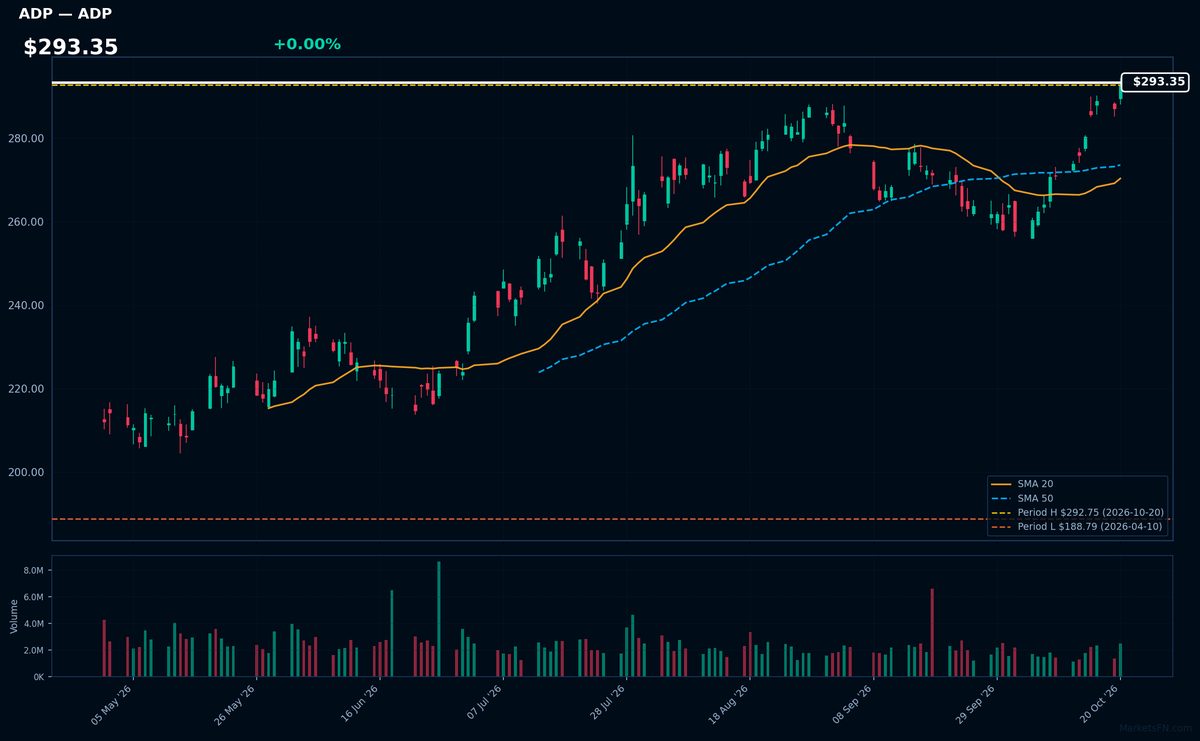
ADP | Automatic Data Processing Inc | Technology | Price Last: $292.75 | % Realized: +15.77% | RSI: 72.6 | % above MA200: +22.4% | Trend: Above MA20, MA50, MA200
ADP provides payroll processing, HR management, and tax filing services to businesses globally. Investors care because its recurring revenue model and essential services create stable cash flows, with performance tied to employment trends and regulatory complexity in workforce management.
ADP trades at $293.35 with an overbought RSI(14) of 72.6 and mixed MA alignment (above MA20/MA50/MA200). The stock is flat versus its 2026 YTD high after a 15.8% rally, suggesting extended momentum that may warrant caution near-term.
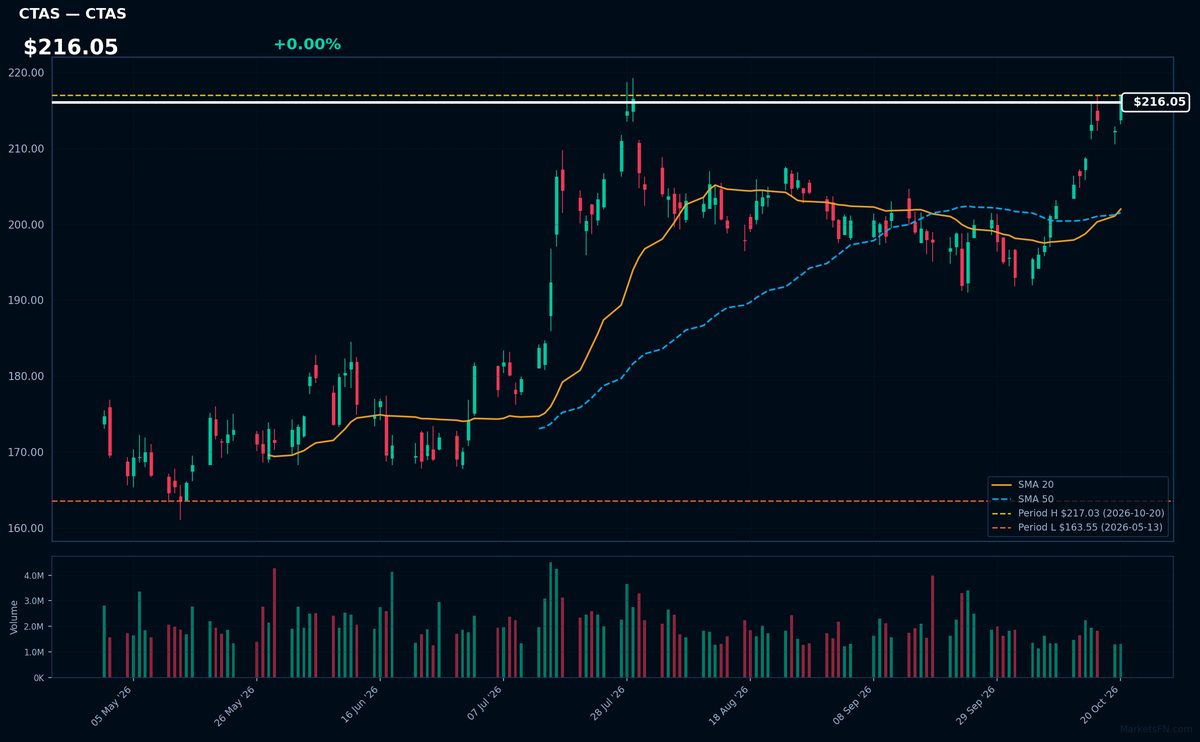
CTAS | Cintas Corporation | Industrials | Price Last: $217.03 | % Realized: +17.39% | RSI: 70.6 | % above MA200: +14.7% | Trend: Above MA20, MA50, MA200
Cintas provides corporate identity uniforms and business services (restroom supplies, safety equipment) to over 1 million businesses. Investors care because its recurring revenue model and essential services drive consistent cash flow through economic cycles.
Technically bullish with price ($216.05) above all key MAs (20/50/200) and RSI(14) at 70.6 (near overbought). YTD +17.4% uptrend tests 2026 highs — momentum confirms strength but warrants caution at extended levels.
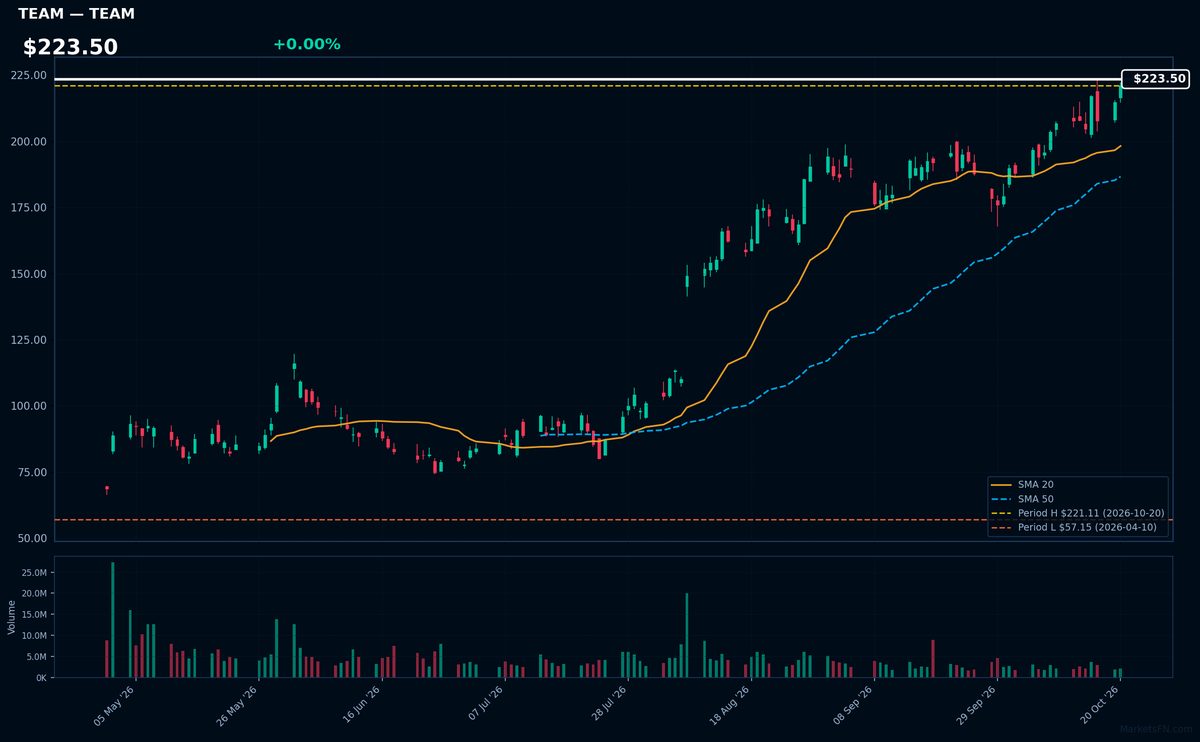
TEAM | Atlassian Corporation | Technology | Price Last: $221.11 | % Realized: +42.87% | RSI: 68.6 | % above MA200: +91.6% | Trend: Above MA20, MA50, MA200
Atlassian provides collaboration software (Jira, Confluence) for agile development teams. Investors care because its tools are mission-critical for software developers, creating sticky enterprise subscriptions with high renewal rates and pricing power in a growing $50B+ market.
TEAM shows bullish momentum: RSI(14) at 68.6 (approaching overbought) with sustained uptrend (price > MA20 > MA50 > MA200). The stock is flat with its 2026 YTD high after rallying 42.9%, suggesting potential breakout energy but elevated near-term risk.
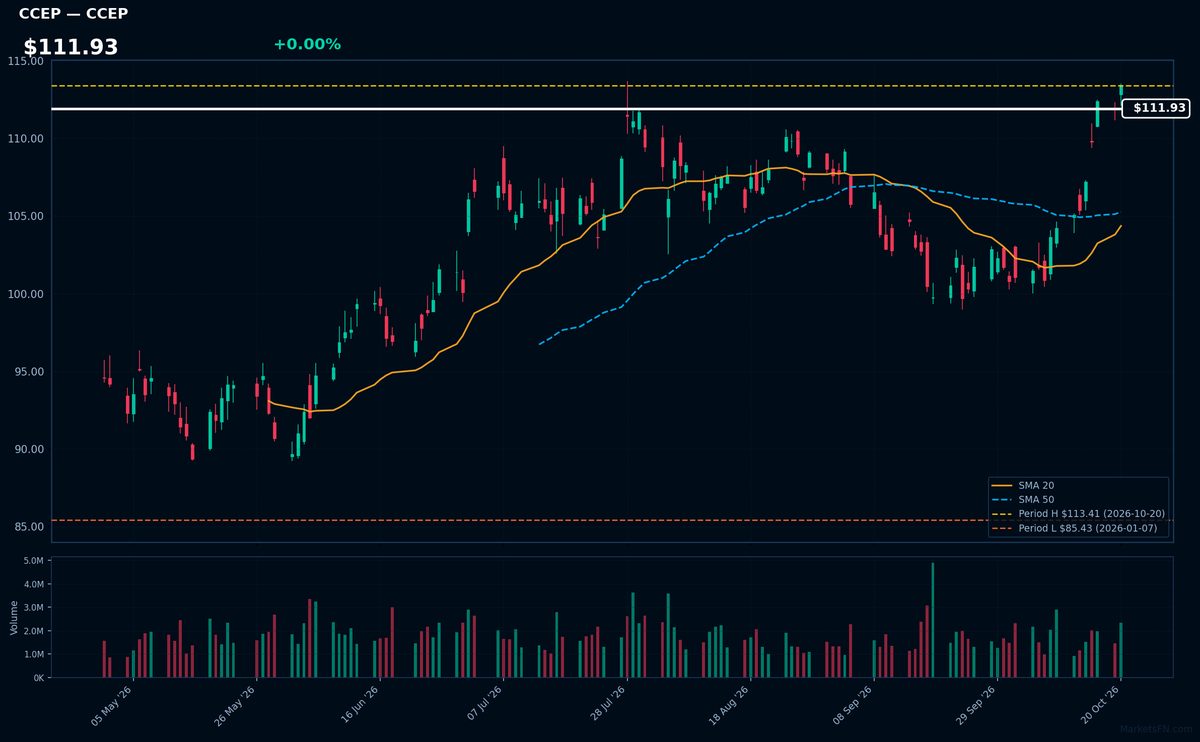
CCEP | Coca-Cola Europacific Partners Plc | Consumer Defensive | Price Last: $113.41 | % Realized: +28.57% | RSI: 67.6 | % above MA200: +13.6% | Trend: Above MA20, MA50, MA200
Coca-Cola Europacific Partners Plc bottles and distributes Coca-Cola products across Europe and Asia-Pacific, operating the world's largest independent Coke franchise. Investors care for its stable cash flows from essential beverage demand and exposure to emerging markets.
At $111.93, CCEP trades 0.0% below its 2026 high with RSI(14) at 67.6 (near overbought) and mixed MA alignment (above MA20/MA50/MA200). The 28.6% YTD surge suggests momentum, but RSI proximity to 70 warrants caution despite breakout potential.
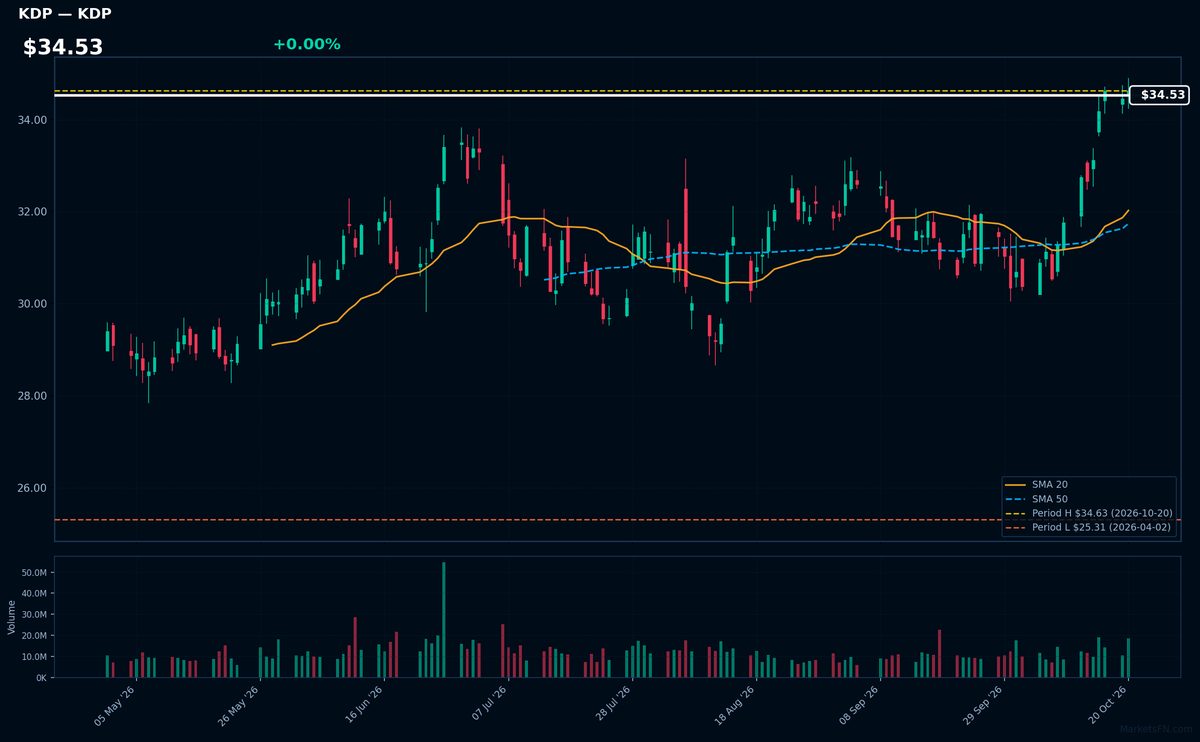
KDP | Keurig Dr Pepper Inc | Consumer Defensive | Price Last: $34.63 | % Realized: +24.88% | RSI: 67.8 | % above MA200: +16.4% | Trend: Above MA20, MA50, MA200
Keurig Dr Pepper Inc manufactures and distributes coffee systems (Keurig) and beverages (Dr Pepper, Snapple). Investors care because its dual-category exposure combines steady coffee demand with high-margin branded soft drinks, creating resilient cash flows in consumer staples.
Technically bullish with RSI(14) at 67.8 and price > MA20 > MA50 > MA200. The 24.9% YTD surge to $34.53 tests 2026 highs, suggesting momentum but nearing overbought territory.
📉 Nearest to 2026 Low
Sectors represented: Industrials (3), Communication Services (2)
| Ticker | Company | Sector | Price Last | % Realized | 2026 YTD Low Date | RSI | % above MA200 | Trend |
|---|---|---|---|---|---|---|---|---|
| NFLX | Netflix Inc | Communication Services | $68.69 | -24.51% | 2026-10-02 | 34.5 | -16.8% | Below MA20, MA50, MA200 |
| PCAR | Paccar Inc | Industrials | $110.07 | -1.34% | 2026-10-07 | 41.8 | -8.7% | Above MA20 · Below MA50, MA200 |
| APP | Applovin Corp | Communication Services | $272.46 | -55.94% | 2026-10-14 | 40.0 | -36.5% | Below MA20, MA50, MA200 |
| HON | Honeywell International Inc | Industrials | $213.32 | +3.84% | 2026-09-14 | 53.8 | -7.5% | Above MA20, MA50 · Below MA200 |
| CPRT | Copart, Inc | Industrials | $27.83 | -26.32% | 2026-10-14 | 46.9 | -14.9% | Above MA20 · Below MA50, MA200 |
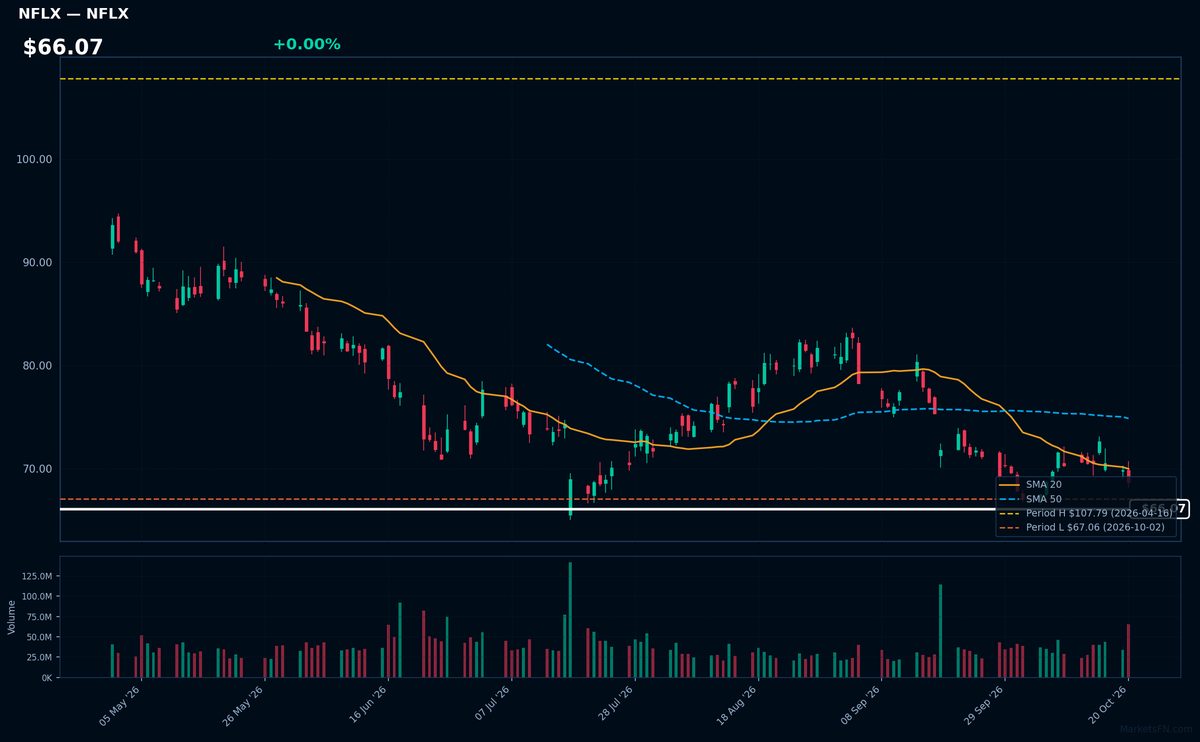
NFLX | Netflix Inc | Communication Services | Price Last: $68.69 | % Realized: -24.51% | RSI: 34.5 | % above MA200: -16.8% | Trend: Below MA20, MA50, MA200
Netflix Inc dominates global streaming with 247M subscribers, pioneering original content while facing intensifying competition. Investors care due to its market leadership, pricing power in entertainment, and high-margin subscription model—though growth is slowing as saturation nears.
NFLX shows severe technical weakness: RSI(14) at 34.5 confirms oversold conditions amid a sustained downtrend (price < MA20 < MA50 < MA200). Trading just 2.4% above 2026 lows after a -24.5% YTD plunge, this tests critical support—a clear warning sign, not momentum.
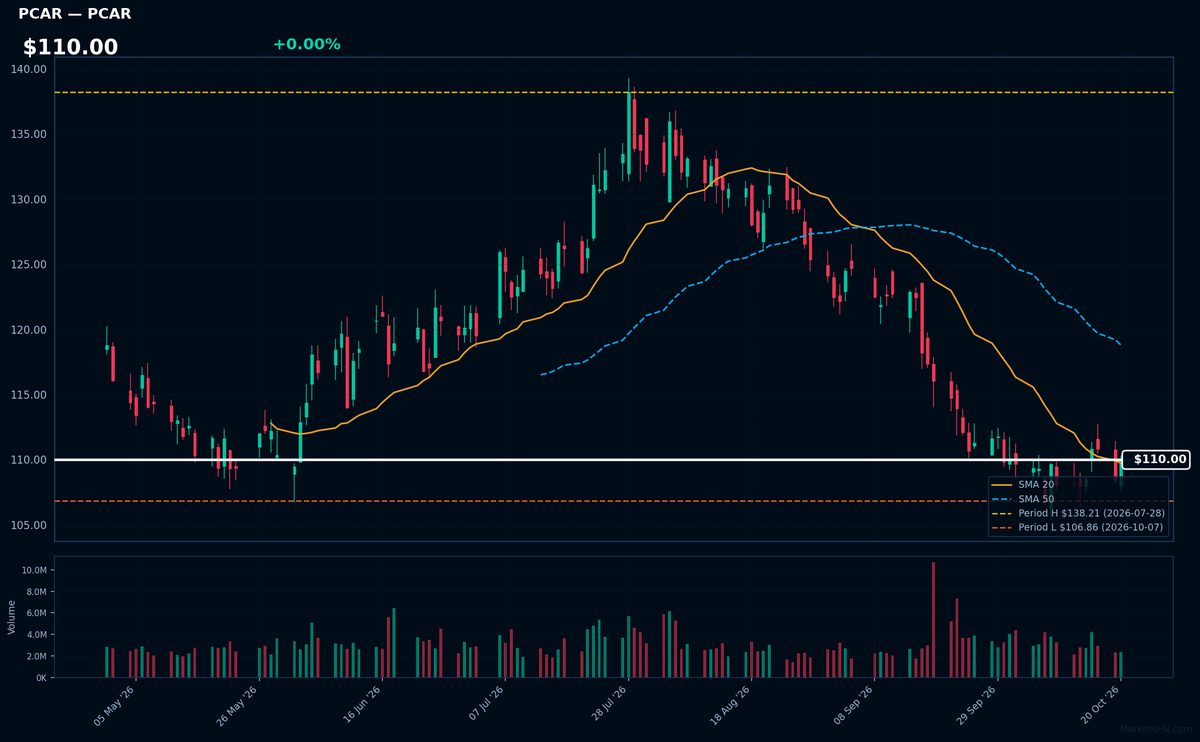
PCAR | Paccar Inc | Industrials | Price Last: $110.07 | % Realized: -1.34% | RSI: 41.8 | % above MA200: -8.7% | Trend: Above MA20 · Below MA50, MA200
Paccar manufactures premium Kenworth and Peterbilt trucks, dominating North American heavy-duty vehicle sales. Investors watch its cyclical exposure to freight demand and replacement cycles, with industry-leading margins (9.4% net) providing resilience.
PCAR at $110 tests key support (3% above 2026 low) with mixed signals: RSI 41.8 suggests neutrality, but price below MA50/MA200 warns of weakening momentum. YTD -1.3% underperforms.
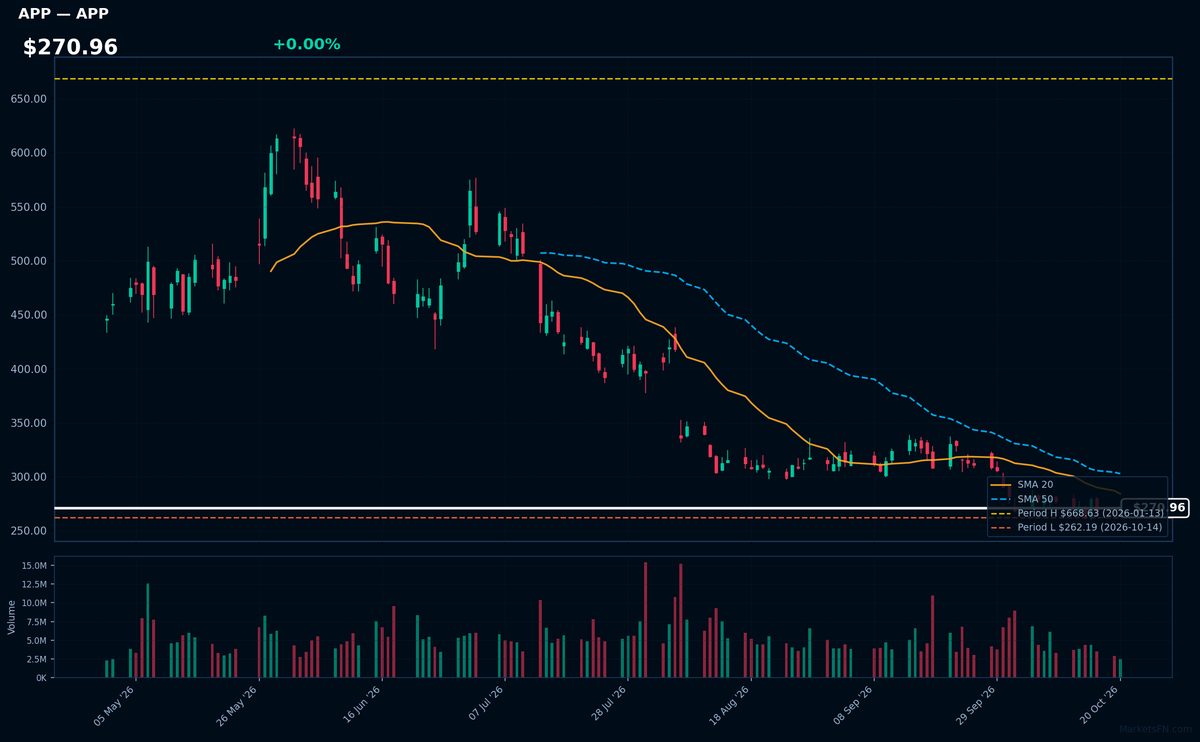
APP | Applovin Corp | Communication Services | Price Last: $272.46 | % Realized: -55.94% | RSI: 40.0 | % above MA200: -36.5% | Trend: Below MA20, MA50, MA200
Applovin Corp operates a mobile app monetization platform, enabling developers to maximize revenue through targeted advertising and analytics. Investors should care because its technology directly impacts app profitability in the $400B+ mobile economy.
Technically, APP shows severe weakness: RSI(14) at 40.0 with bearish MA alignment (price < MA20 < MA50 < MA200) and -55.9% YTD return. Testing 3.9% above YTD lows signals critical support breach risk.
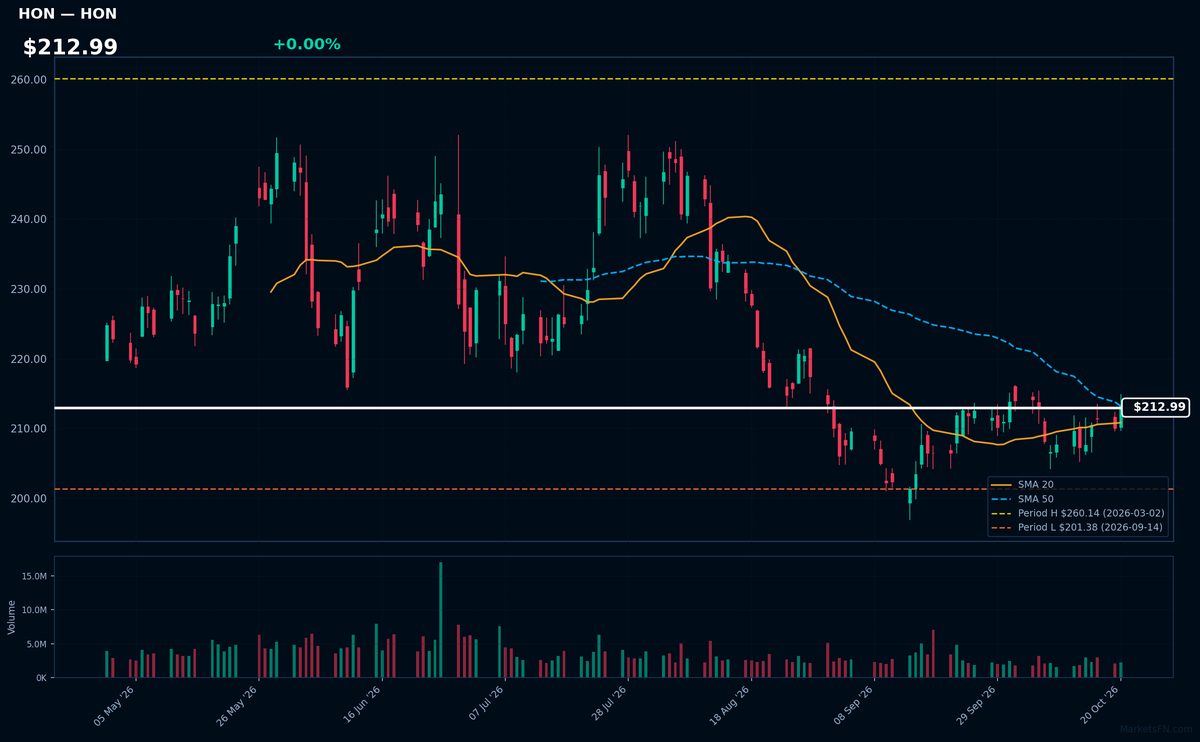
HON | Honeywell International Inc | Industrials | Price Last: $213.32 | % Realized: +3.84% | RSI: 53.8 | % above MA200: -7.5% | Trend: Above MA20, MA50 · Below MA200
Honeywell International Inc operates in aerospace, building technologies, performance materials, and safety solutions, serving industries from defense to smart energy. Investors should care due to its diversified industrial exposure and recurring revenue streams from long-term contracts.
HON shows mixed signals: RSI(14) at 53.8 suggests neutral momentum, while MA alignment (above MA20/MA50 but below MA200) and a 5.9% buffer from YTD lows indicate vulnerability. The 3.8% YTD return reflects tepid performance, warranting caution near support levels.
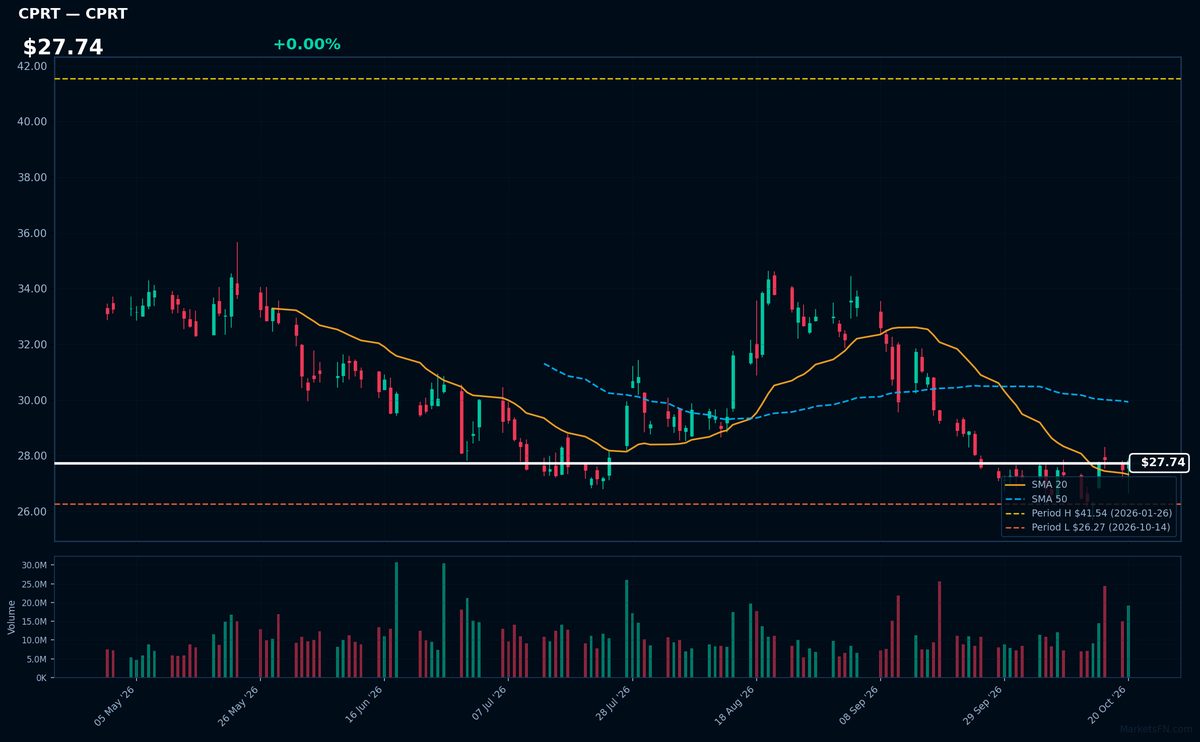
CPRT | Copart, Inc | Industrials | Price Last: $27.83 | % Realized: -26.32% | RSI: 46.9 | % above MA200: -14.9% | Trend: Above MA20 · Below MA50, MA200
Copart operates an online vehicle auction platform, specializing in salvage and used cars for insurers, dealers, and individuals. Investors watch it as a cyclical play on auto insurance claims volume and used vehicle supply-demand dynamics.
Technically mixed at $27.74 (-26.3% YTD), testing support just 5.9% above 2026 lows. RSI 46.9 shows no extreme, while MA alignment (above MA20 but below MA50/200) suggests weak momentum. Caution warranted near support.
Market Commentary
The Nasdaq 100's 2026 YTD extremes reveal a divergence between resilient business services/consumer staples (ADP, CTAS, KDP) and underperforming tech/industrial names (NFLX, HON, PCAR). Stocks at highs—like payroll processor ADP and uniform supplier Cintas—reflect stable recurring revenue models, while Coca-Cola Europacific and Keurig Dr Pepper benefit from defensive demand. Conversely, Netflix's proximity to lows suggests streaming saturation concerns, while Honeywell and Paccar face cyclical industrial pressures.
Macro themes emerge: Low-volatility cash flows (ADP, CTAS) outperform as growth uncertainty persists, while AppLovin's ad-tech struggles (+3.9% from low) hint at digital ad softness. The absence of mega-cap tech in either group indicates mid-cap bifurcation. Near-zero deviations for highs (0.0%) versus wider buffers for lows (+2.4% to +5.9%) suggest stronger downside momentum.
Traders should monitor whether defensive leaders sustain breaks to new highs or see profit-taking, while oversold candidates like Copart (+5.9% from low) test support. Confirmation of Netflix or Honeywell reclaiming key levels may signal reversals. Macro data (rates, consumer spending) will dictate if current extremes mark inflection points or extended trends.
Methodology: All 101 Nasdaq 100 constituents screened. Close prices downloaded from 2026-01-01. Period high = highest close since Jan 1 2026; period low = lowest close since Jan 1 2026. Distance = (current price / period extreme − 1) × 100. Technical indicators computed on up to 1 year of daily OHLCV data.
Disclaimer: For informational purposes only. Not investment advice. Past performance is not indicative of future results.