Nasdaq 100 2026 YTD Highs & Lows Radar: Apple (AAPL), Applovin (APP) and more
MarketsFN Team

Screening all 101 Nasdaq 100 constituents for stocks nearest to their 2026 year-to-date high and their 2026 YTD low. Data as of October 19, 2026. % Realized = total return since Jan 1 2026.
Legend: RSI > 70 = overbought · RSI < 30 = oversold · Green % Realized = positive YTD return · Red = negative.
📈 Nearest to 2026 High
Sectors represented: Technology (2), Consumer Defensive (2), Healthcare (1)
| Ticker | Company | Sector | Price Last | % Realized | 2026 YTD High Date | RSI | % above MA200 | Trend |
|---|---|---|---|---|---|---|---|---|
| AAPL | Apple Inc | Technology | $343.46 | +26.73% | 2026-10-16 | 62.4 | +17.3% | Above MA20, MA50, MA200 |
| ADP | Automatic Data Processing Inc | Technology | $288.90 | +14.24% | 2026-10-16 | 67.7 | +21.0% | Above MA20, MA50, MA200 |
| CCEP | Coca-Cola Europacific Partners Plc | Consumer Defensive | $112.40 | +27.42% | 2026-10-16 | 69.4 | +12.9% | Above MA20, MA50, MA200 |
| KDP | Keurig Dr Pepper Inc | Consumer Defensive | $34.62 | +24.85% | 2026-10-16 | 68.1 | +16.7% | Above MA20, MA50, MA200 |
| GILD | Gilead Sciences, Inc | Healthcare | $156.19 | +28.45% | 2026-10-15 | 63.6 | +13.0% | Above MA20, MA50, MA200 |
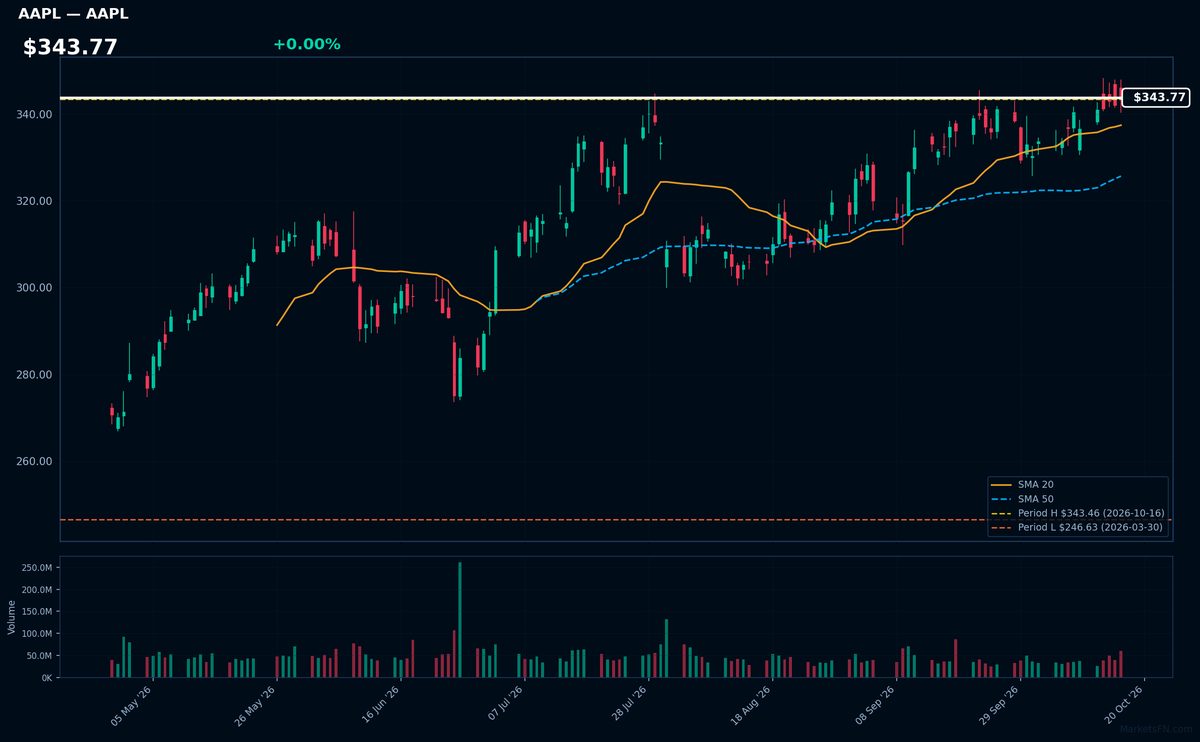
AAPL | Apple Inc | Technology | Price Last: $343.46 | % Realized: +26.73% | RSI: 62.4 | % above MA200: +17.3% | Trend: Above MA20, MA50, MA200
Apple Inc designs premium consumer electronics (iPhone, Mac), services (App Store, iCloud), and wearables (Apple Watch). Investors care due to its ecosystem lock-in, pricing power, and recurring revenue from 1.2B active devices — a rare blend of hardware margins and software scalability.
AAPL shows bullish momentum at $343.77 (RSI 62.4, price > MA20 > MA50 > MA200). The 26.7% YTD gain and 0.0% distance from 2026 highs suggest breakout potential, though RSI nears overbought territory. MA alignment confirms sustained uptrend.
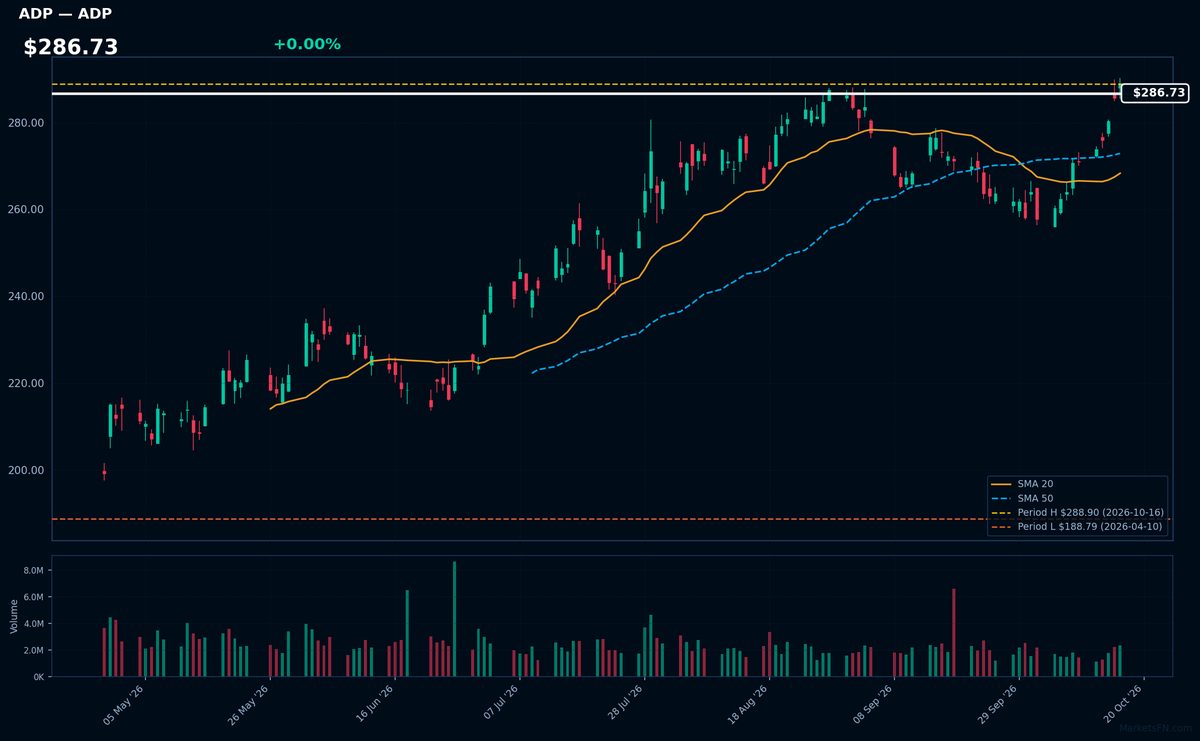
ADP | Automatic Data Processing Inc | Technology | Price Last: $288.90 | % Realized: +14.24% | RSI: 67.7 | % above MA200: +21.0% | Trend: Above MA20, MA50, MA200
Automatic Data Processing Inc (ADP) provides cloud-based HR and payroll solutions, serving 1M+ clients globally. Investors should note its recurring revenue model and sticky enterprise relationships in a growing $150B+ HCM market, with pricing power from compliance complexity.
ADP trades at $286.73 with RSI(14) at 67.7 (near overbought) and mixed MA alignment (above MA20/50/200). The stock is 0.0% below its 2026 high after gaining 14.2% YTD — extended momentum that needs confirmation of fundamental support.
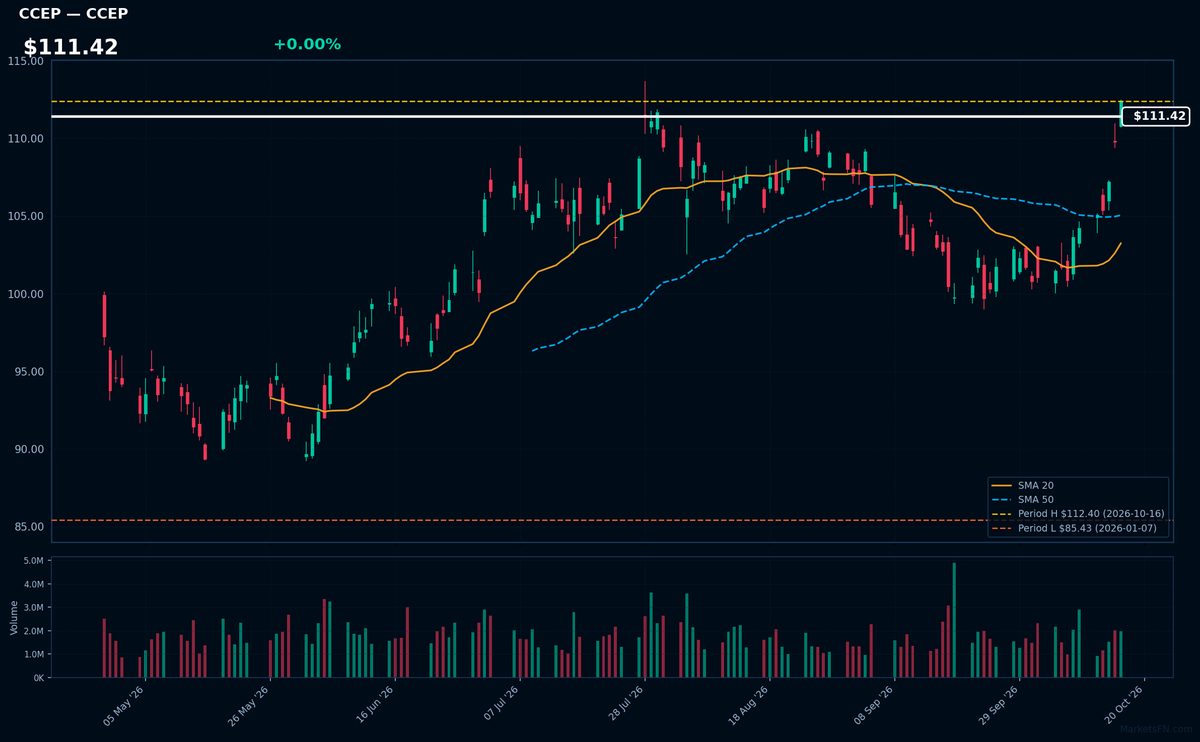
CCEP | Coca-Cola Europacific Partners Plc | Consumer Defensive | Price Last: $112.40 | % Realized: +27.42% | RSI: 69.4 | % above MA200: +12.9% | Trend: Above MA20, MA50, MA200
Coca-Cola Europacific Partners Plc bottles and distributes Coca-Cola products across Europe and Asia-Pacific, offering investors exposure to stable beverage demand and Coca-Cola's global brand strength in key growth markets.
At $111.42, CCEP trades 0.0% below its 2026 YTD high with RSI(14) at 69.4 and above MA20/MA50/MA200. The 27.4% YTD gain suggests strong momentum, though elevated RSI warrants caution.
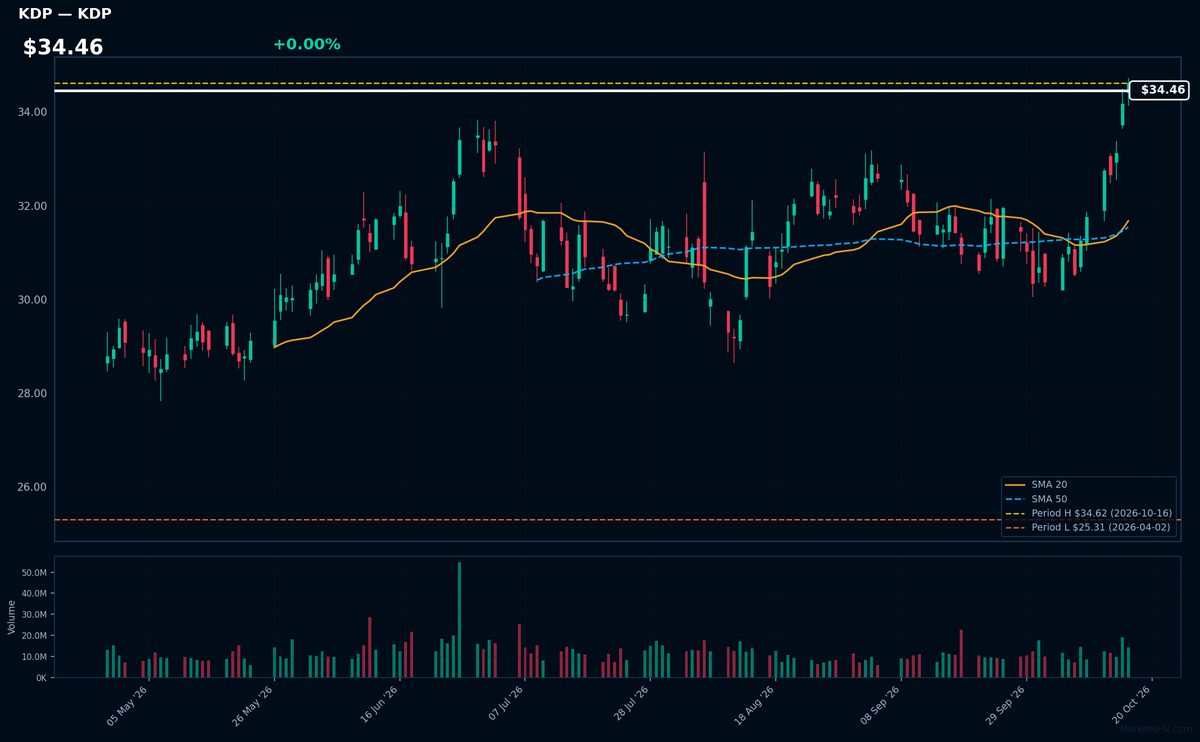
KDP | Keurig Dr Pepper Inc | Consumer Defensive | Price Last: $34.62 | % Realized: +24.85% | RSI: 68.1 | % above MA200: +16.7% | Trend: Above MA20, MA50, MA200
Keurig Dr Pepper Inc (KDP) manufactures and distributes coffee systems (Keurig) and beverages (Dr Pepper, Snapple). Investors care because its dual coffee/soft drink model creates stable cash flows, with pricing power in both at-home coffee pods and branded sodas—a rare hybrid in consumer staples.
KDP shows strong momentum with a bullish MA alignment (price > MA20 > MA50 > MA200) and elevated RSI(14) at 68.1. At 0.0% below its 2026 YTD high after a 24.8% gain, it tests breakout levels—watch for overbought pressure given the RSI nearing 70.
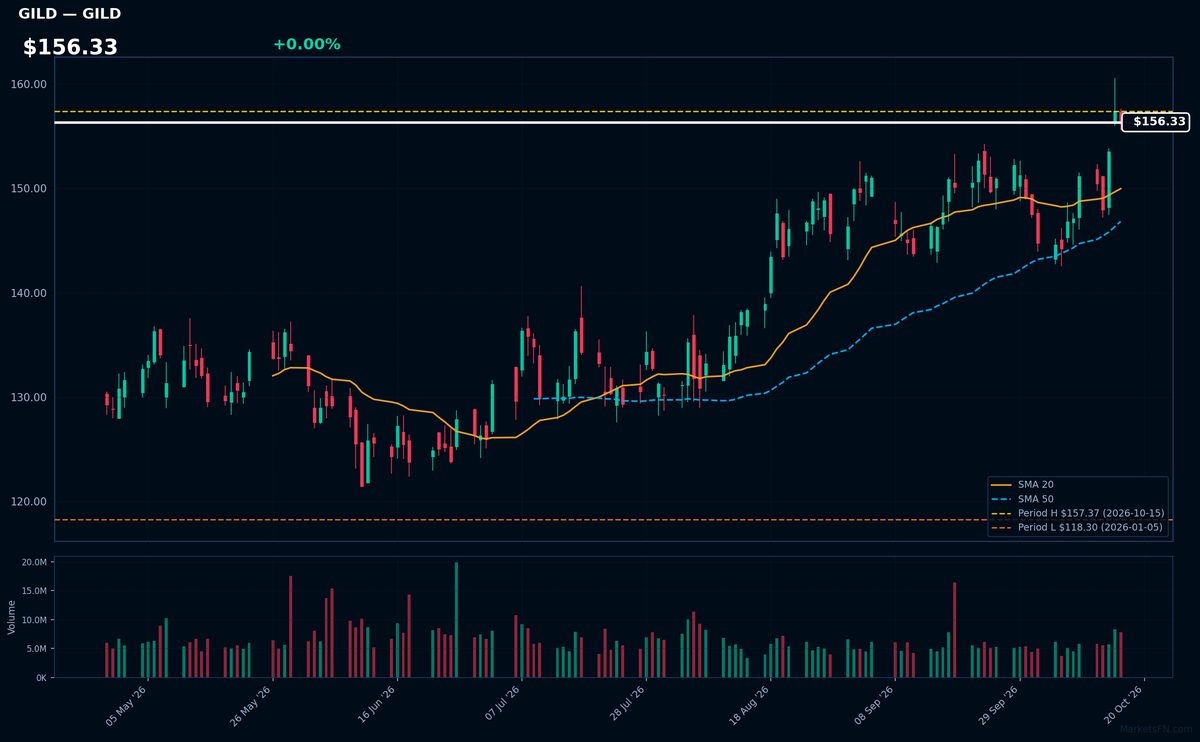
GILD | Gilead Sciences, Inc | Healthcare | Price Last: $156.19 | % Realized: +28.45% | RSI: 63.6 | % above MA200: +13.0% | Trend: Above MA20, MA50, MA200
Gilead Sciences is a biopharmaceutical leader focused on antiviral drugs (including HIV/hepatitis treatments) and oncology therapies. Investors care due to its high-margin specialty drug portfolio and pipeline in lucrative therapeutic areas, driving consistent cash flows.
GILD shows bullish momentum with RSI(14) at 63.6 and price > MA20 > MA50 > MA200. The stock is 0.7% below its YTD high after gaining 28.4% in 2026, suggesting sustained uptrend strength but nearing overbought RSI territory.
📉 Nearest to 2026 Low
Sectors represented: Communication Services (3), Industrials (2)
| Ticker | Company | Sector | Price Last | % Realized | 2026 YTD Low Date | RSI | % above MA200 | Trend |
|---|---|---|---|---|---|---|---|---|
| APP | Applovin Corp | Communication Services | $266.13 | -56.96% | 2026-10-14 | 36.6 | -38.5% | Below MA20, MA50, MA200 |
| TTD | Trade Desk Inc | Communication Services | $12.23 | -67.54% | 2026-10-06 | 40.8 | -42.3% | Below MA20, MA50, MA200 |
| PCAR | Paccar Inc | Industrials | $110.82 | -0.66% | 2026-10-07 | 37.8 | -8.1% | Above MA20 · Below MA50, MA200 |
| HON | Honeywell International Inc | Industrials | $211.41 | +2.91% | 2026-09-14 | 48.4 | -8.3% | Above MA20 · Below MA50, MA200 |
| NFLX | Netflix Inc | Communication Services | $70.53 | -22.49% | 2026-10-02 | 42.8 | -14.8% | Above MA20 · Below MA50, MA200 |
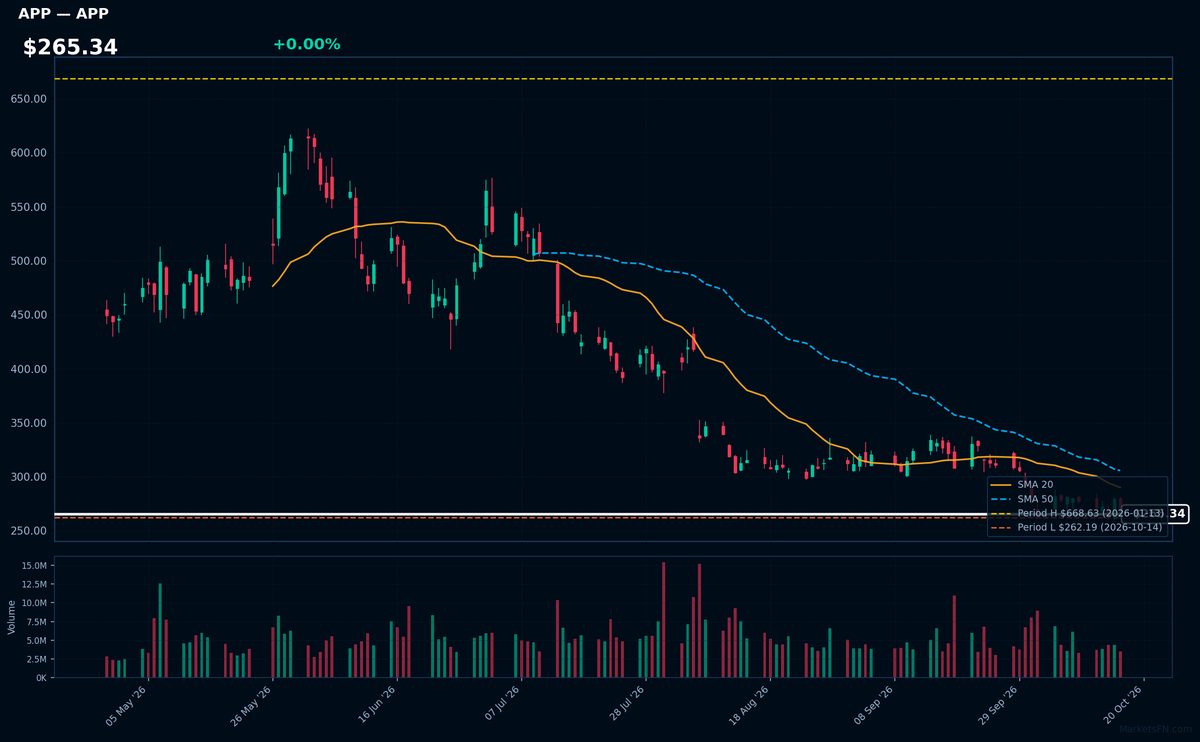
APP | Applovin Corp | Communication Services | Price Last: $266.13 | % Realized: -56.96% | RSI: 36.6 | % above MA200: -38.5% | Trend: Below MA20, MA50, MA200
Applovin operates a mobile app discovery platform and monetization tools for developers. Investors care due to its exposure to the high-growth mobile gaming and advertising markets, where it helps apps optimize user acquisition and revenue.
Technically, APP shows severe weakness: RSI(14) at 36.6, bearish MA alignment (price < MA20 < MA50 < MA200), and -57.0% YTD decline. The stock tests critical support, just 1.5% above its 2026 low—a clear warning sign.
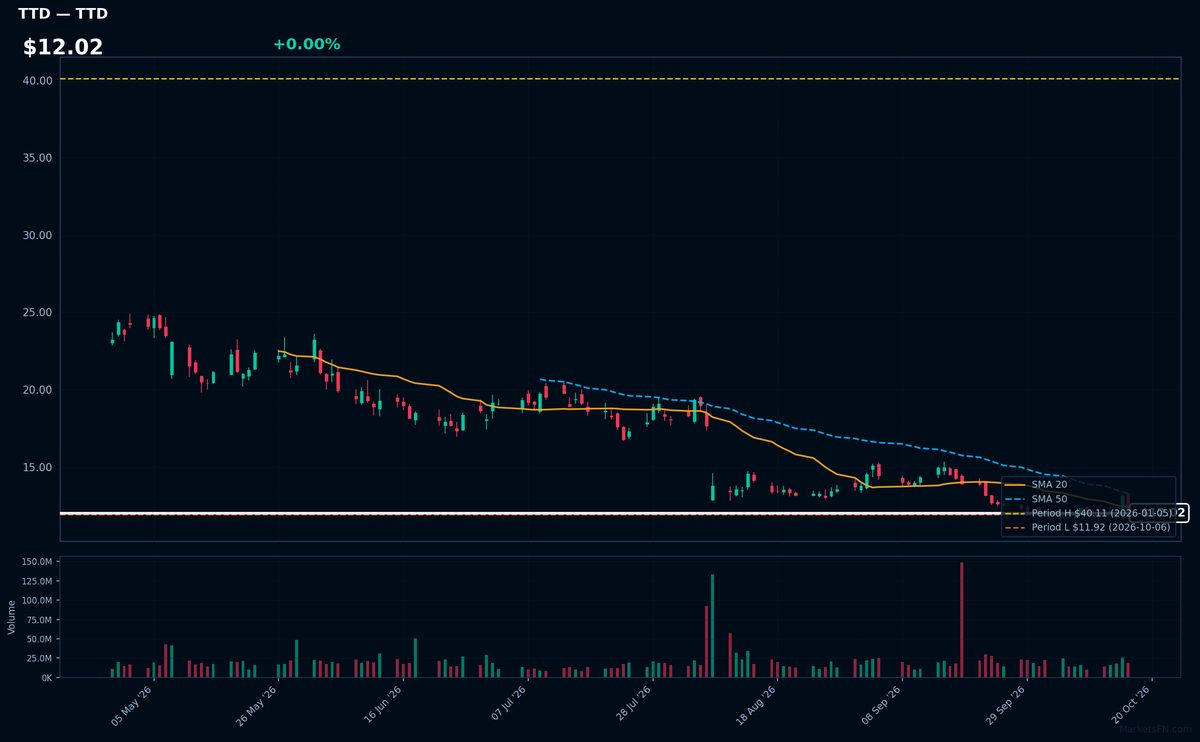
TTD | Trade Desk Inc | Communication Services | Price Last: $12.23 | % Realized: -67.54% | RSI: 40.8 | % above MA200: -42.3% | Trend: Below MA20, MA50, MA200
Trade Desk Inc operates a cloud-based ad buying platform that automates digital media purchases for agencies and brands. Investors watch TTD as a proxy for programmatic advertising growth, where its independent position contrasts with walled gardens like Google and Meta.
TTD shows extreme technical weakness: RSI(14) at 40.8 signals bearish momentum, with confirmed downtrend (price < MA20 < MA50 < MA200). At just 2.6% above YTD lows after a 67.5% 2026 decline, this tests critical support. No fundamental strength evident in these metrics.
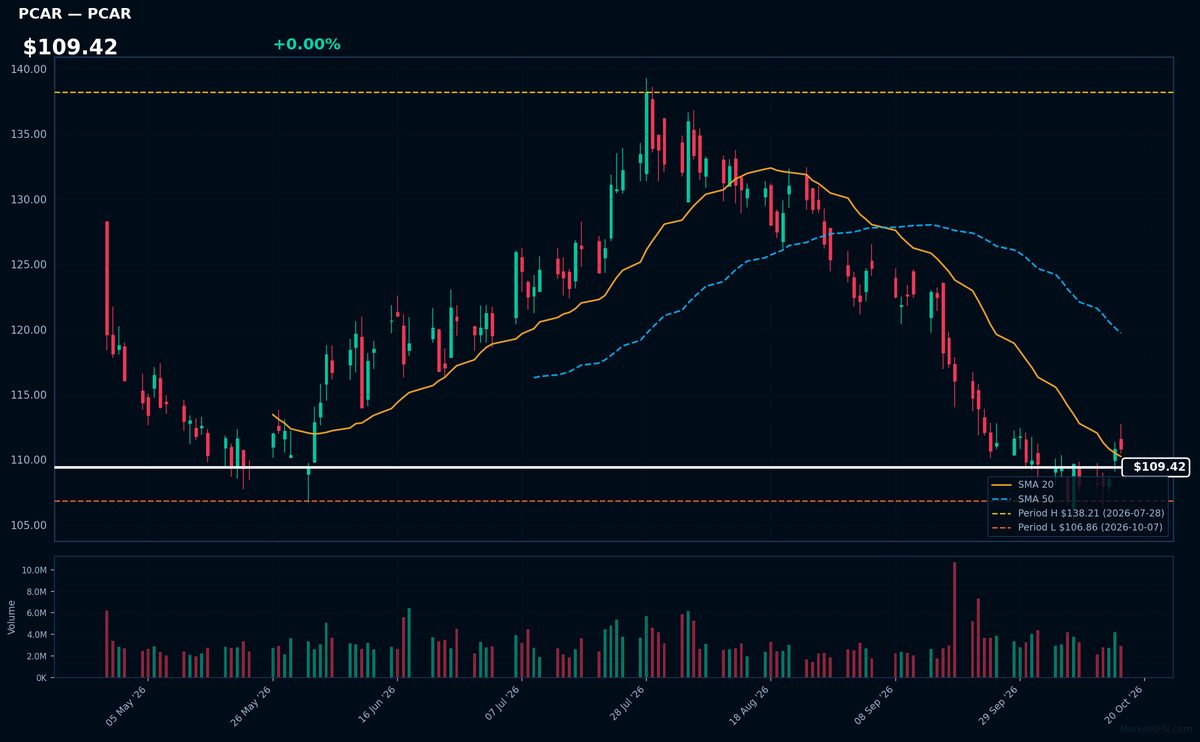
PCAR | Paccar Inc | Industrials | Price Last: $110.82 | % Realized: -0.66% | RSI: 37.8 | % above MA200: -8.1% | Trend: Above MA20 · Below MA50, MA200
Paccar Inc designs/manufactures premium trucks under Kenworth, Peterbilt, and DAF brands, serving commercial freight markets. Investors watch PCAR as a cyclical play on freight demand, fleet replacement cycles, and emissions regulation-driven truck upgrades.
Technically bearish: RSI(14) at 37.8 shows weakening momentum, with price ($109.42) below all key MAs (20/50/200). Testing 2026 lows (-0.7% YTD) signals breakdown risk.
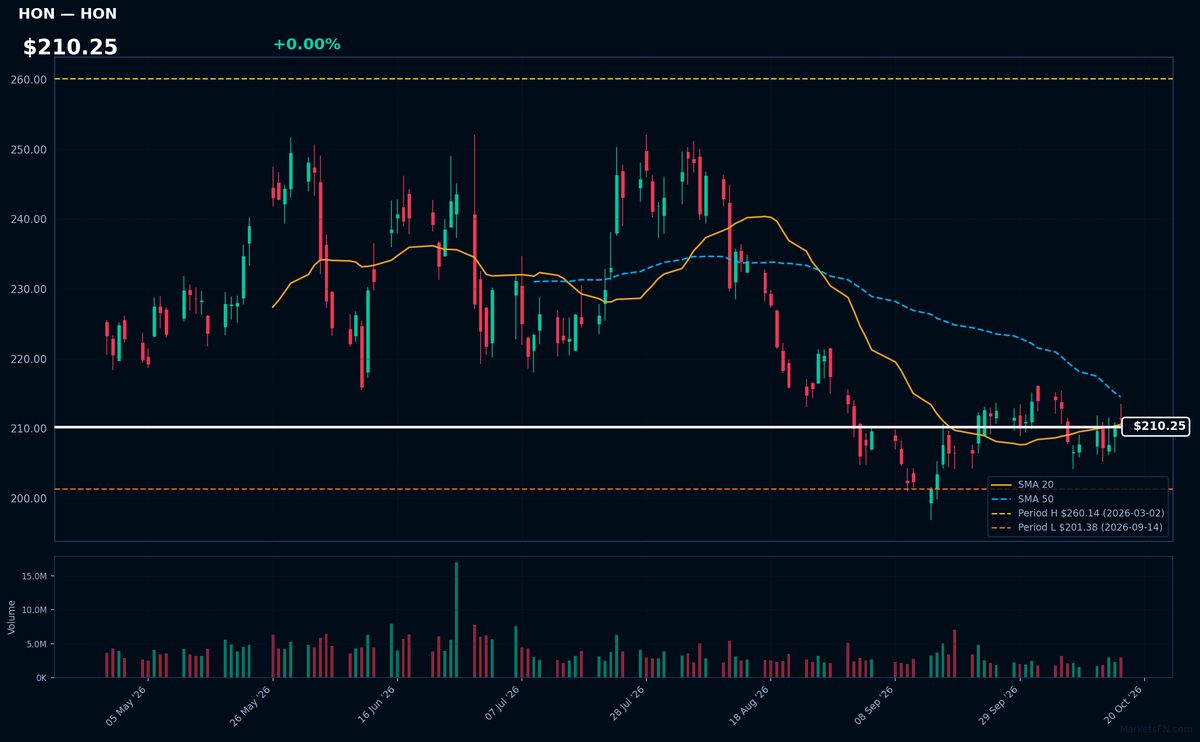
HON | Honeywell International Inc | Industrials | Price Last: $211.41 | % Realized: +2.91% | RSI: 48.4 | % above MA200: -8.3% | Trend: Above MA20 · Below MA50, MA200
Honeywell International Inc operates in aerospace, building technologies, performance materials, and safety solutions, serving critical industrial and commercial markets. Investors watch HON for its diversified industrial exposure and consistent cash flows across economic cycles.
HON shows bearish momentum with RSI(14) at 48.4 and sustained downtrend (price < MA20 < MA50 < MA200). Trading just 5.0% above 2026 lows, this tests key support despite a 2.9% YTD gain—a potential warning sign.
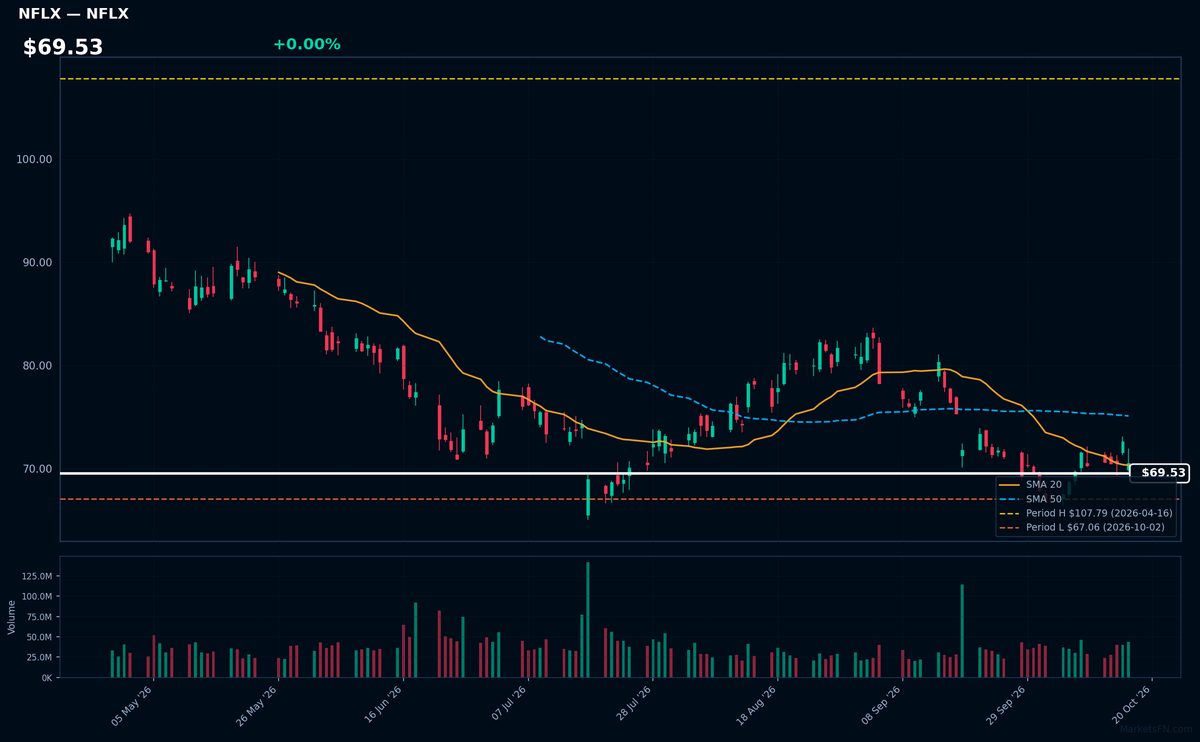
NFLX | Netflix Inc | Communication Services | Price Last: $70.53 | % Realized: -22.49% | RSI: 42.8 | % above MA200: -14.8% | Trend: Above MA20 · Below MA50, MA200
Netflix Inc operates a global streaming platform with 247M subscribers, monetizing content through subscriptions. Investors care due to its industry dominance, pricing power, and shift toward profitable growth via ad-supported tiers and password-sharing crackdowns.
Netflix shows bearish momentum (RSI 42.8, price below MA20/50/200) and tests critical support, down 22.5% YTD. The 5.2% buffer above its YTD low signals vulnerability, not strength.
Market Commentary
The Nasdaq 100's 2026 extremes reveal a stark divergence between resilient defensive names and struggling growth-oriented tech stocks. Apple (AAPL), ADP, Coca-Cola Europacific (CCEP), Keurig Dr Pepper (KDP), and Gilead (GILD) sit at or near all-time highs, benefiting from stable cash flows, low cyclicality, and in some cases, dividend appeal. Meanwhile, AppLovin (APP), Trade Desk (TTD), Paccar (PCAR), Honeywell (HON), and Netflix (NFLX) languish near lows, reflecting pressure on ad-tech, cyclical industrials, and streaming saturation.
This bifurcation underscores a risk-off rotation amid elevated rates and economic uncertainty. Bond-proxy consumer staples (CCEP, KDP) and healthcare (GILD) outperform as growth stocks face multiple compression. Weakness in ad-dependent names (APP, TTD) signals digital ad market fragility, while Netflix's struggles highlight streaming's maturation. Honeywell and Paccar's proximity to lows suggests industrial demand concerns, contrasting with Apple's hardware/services resilience.
Investors should monitor Fed policy shifts that could revive growth appetite, particularly for depressed ad-tech (TTD, APP) and cyclical (HON, PCAR) names. Earnings revisions for high-flyers like AAPL and KDP will test valuation durability, while NFLX's subscriber metrics may signal streaming's next phase. Any break in defensive dominance would require either rate cuts or a soft landing confirmation—neither yet evident in the extremes.
Methodology: All 101 Nasdaq 100 constituents screened. Close prices downloaded from 2026-01-01. Period high = highest close since Jan 1 2026; period low = lowest close since Jan 1 2026. Distance = (current price / period extreme − 1) × 100. Technical indicators computed on up to 1 year of daily OHLCV data.
Disclaimer: For informational purposes only. Not investment advice. Past performance is not indicative of future results.