Hang Seng Index Market Update – April 10, 2026
MarketsFN Team
Hang Seng Index Market Update – April 10, 2026
Published: April 10, 2026 · MarketsFN Team
| Index | Price | Change | RSI(14) | SMA-20 | 52W High | 52W Low |
|---|---|---|---|---|---|---|
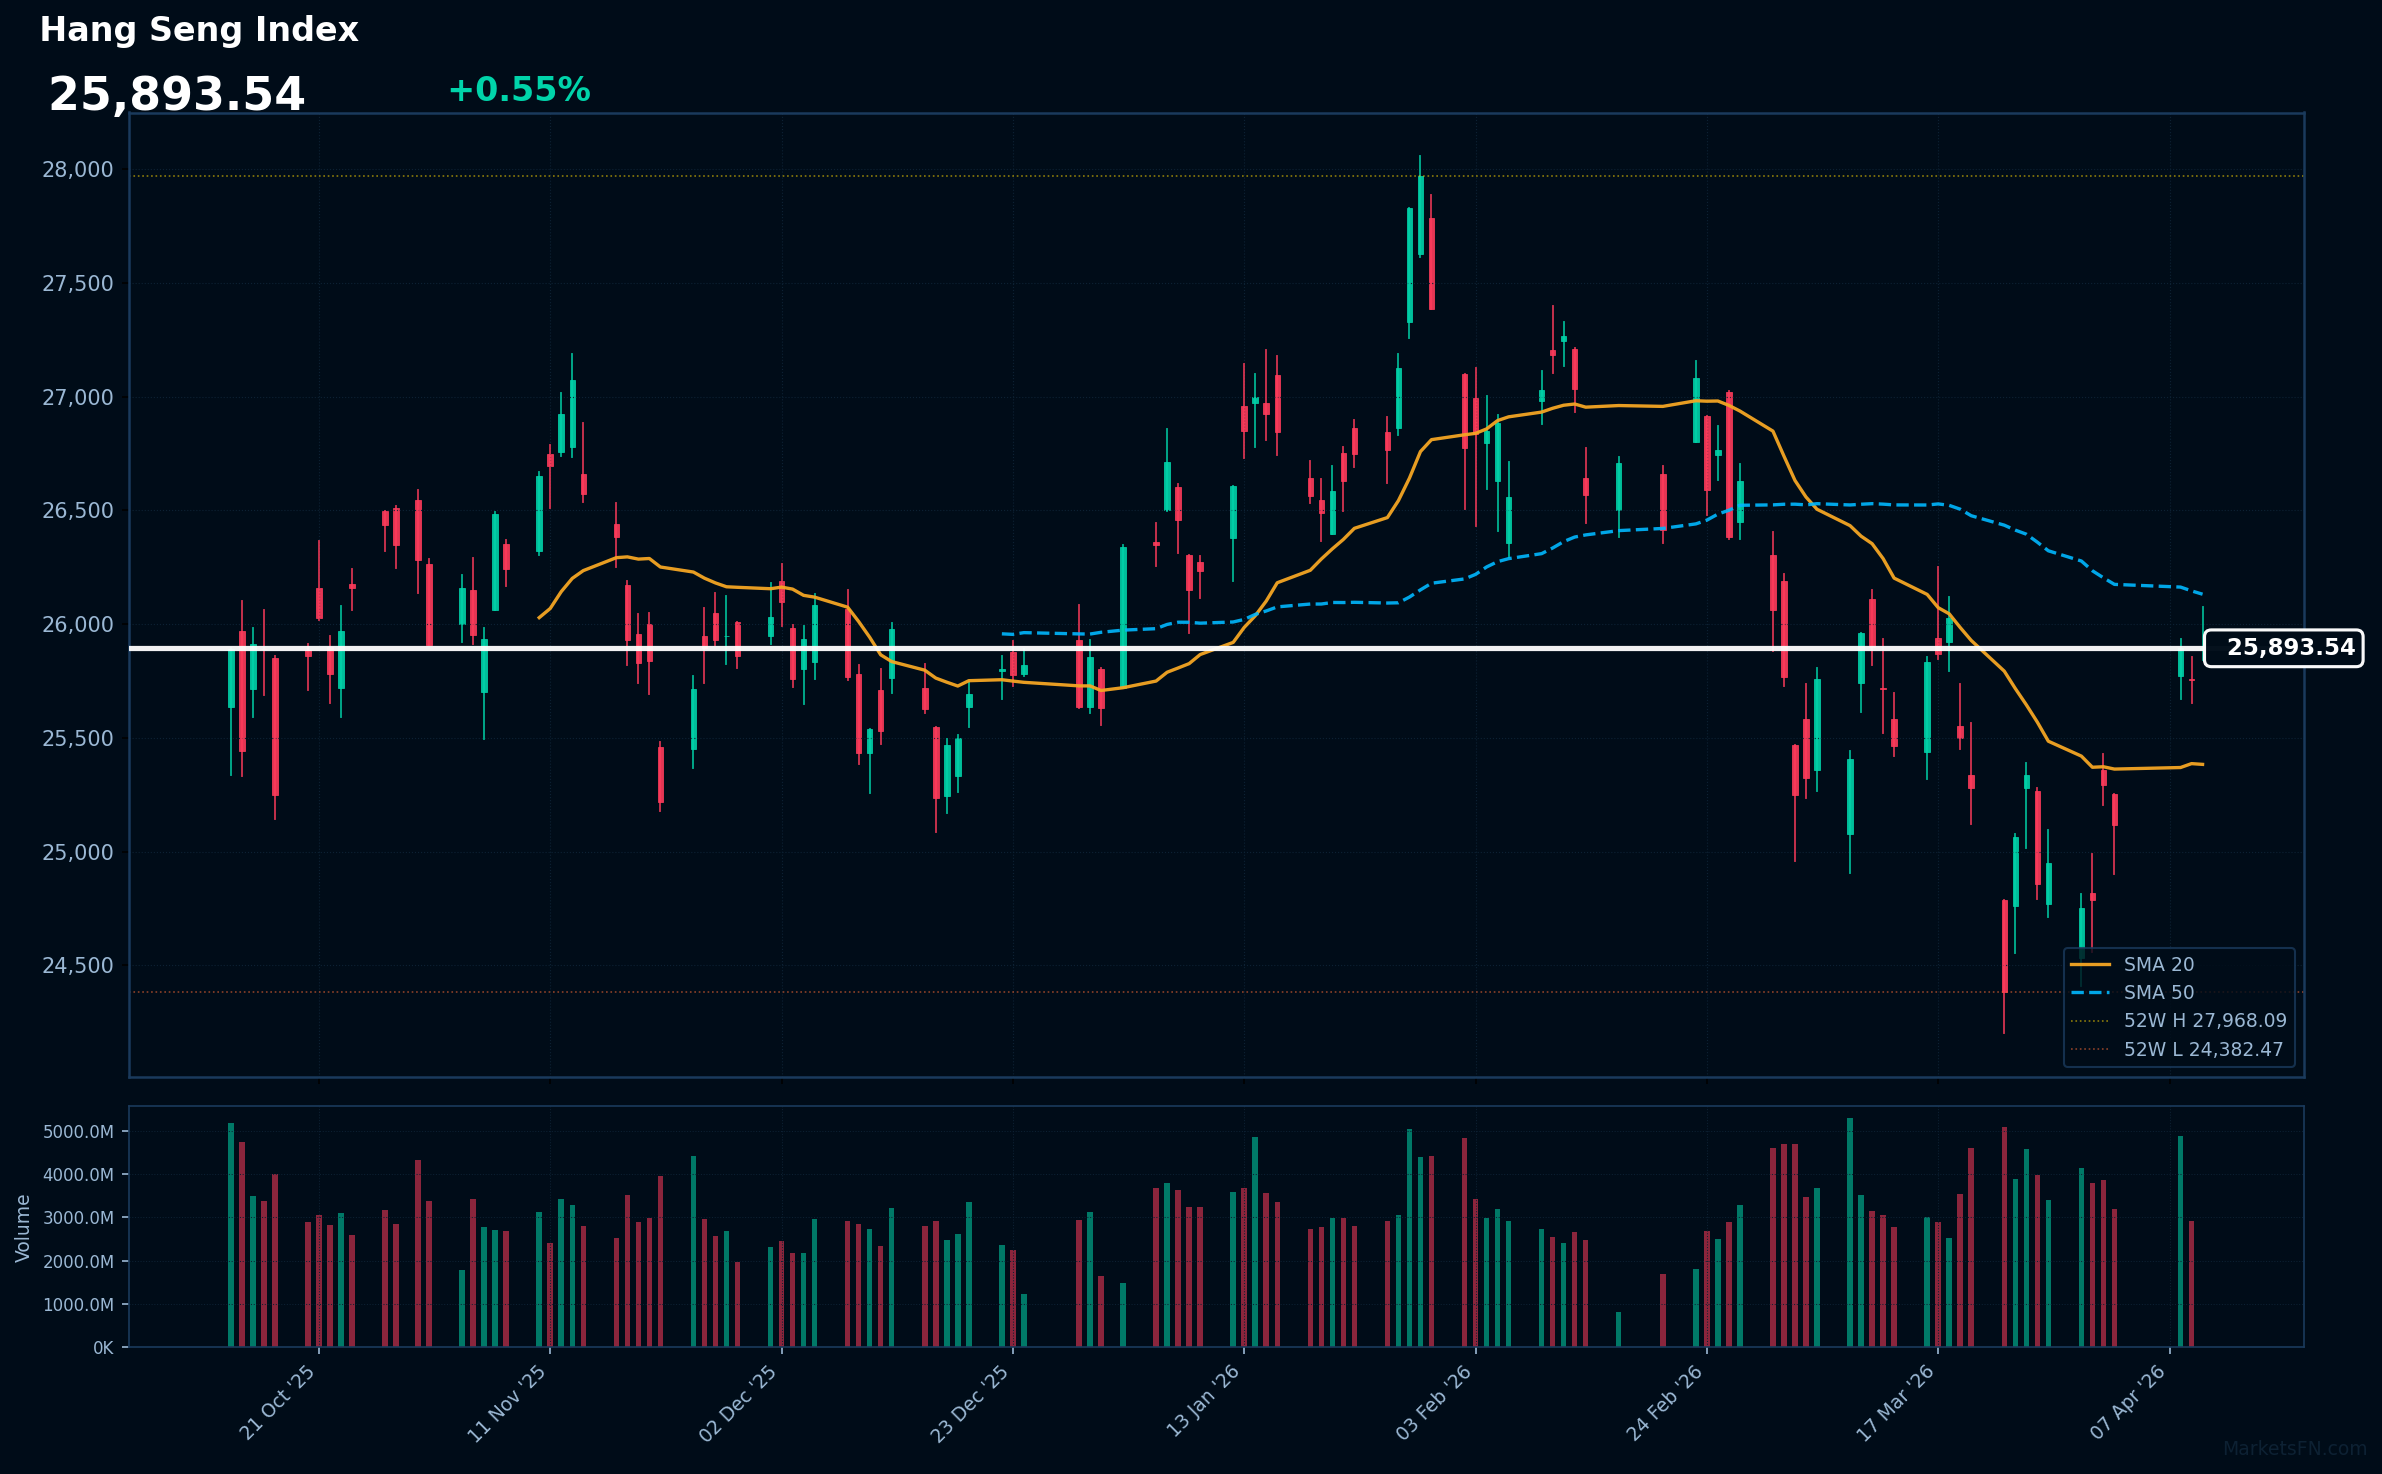
| Hang Seng Index | 25,894 | +0.55% | 48.7 | 25,383 | 27,968 | 24,382 |
The Hang Seng Index closed at 25,894 (+0.55%), marking a modest recovery from the previous trading session. The index traded within a day range of 25,844 to 26,074, indicating slight volatility but maintaining a generally stable performance as it attempts to navigate through recent market uncertainties.
From a technical perspective, the index remains above its 20-day simple moving average (SMA) of 25,383, suggesting short-term bullish momentum; however, it is below the 50-day SMA of 26,131, indicating potential resistance at higher levels. The relative strength index (RSI) is at 48.7, placing it in neutral territory and reflecting a lack of strong directional momentum in either direction.
Looking ahead, key levels to watch include the immediate resistance at the 50-day SMA of 26,131 and support around the recent low of 25,844. A sustained move above 26,074 could signal further upside, while a drop below 25,844 may reignite bearish sentiment.
Disclaimer
The content on MarketsFN.com is provided for educational and informational purposes only. It does not constitute financial advice or investment recommendations. All investments involve risks and past performance does not guarantee future results. You are solely responsible for your investment decisions.