GBP/USD: Up 0.07% to 1.3312 — Ascending Channel
MarketsFN Team
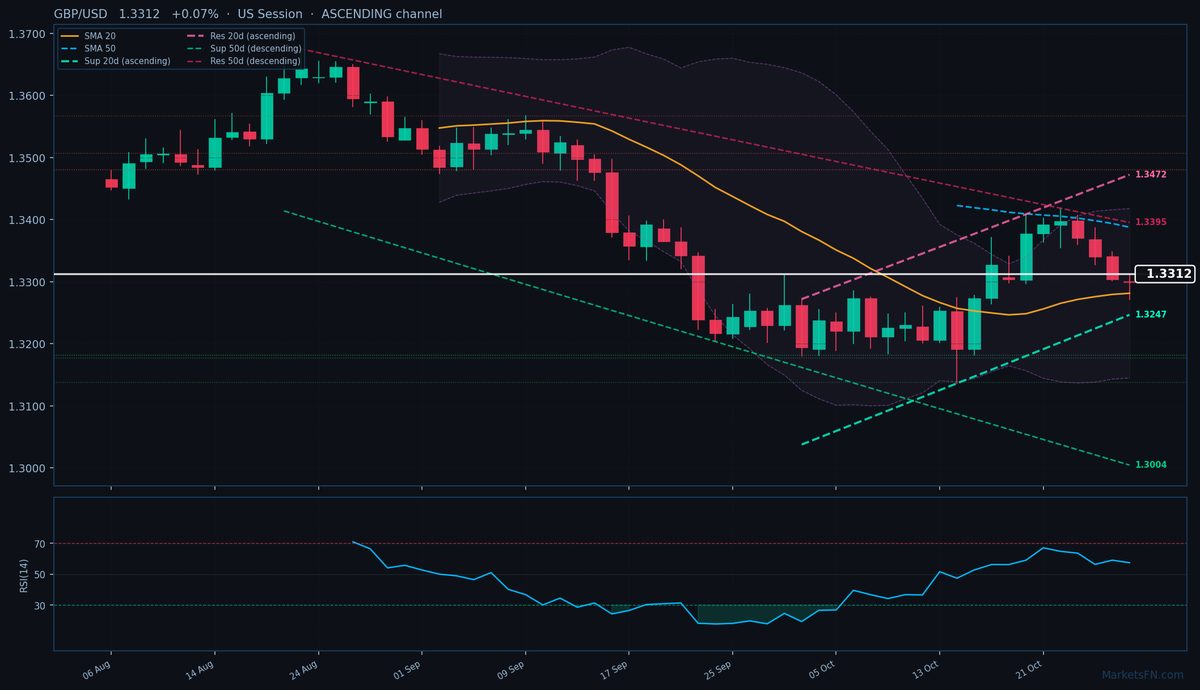
GBP/USD: Up 0.07% to 1.3312 — Ascending Channel
Published: October 28, 2026 · MarketsFN Team · US Session
| Pair | Rate | Change | RSI(14) | SMA-20 | SMA-50 | 52W High | 52W Low | Pivot | R1 | S1 |
|---|---|---|---|---|---|---|---|---|---|---|
| GBP/USD | 1.3312 | +0.07% | 57.5 | 1.3281 | 1.3387 | 1.3846 | 1.3057 | 1.3318 | 1.3333 | 1.3287 |
📊 Support & Resistance Levels
Dynamic Trendlines
| Level | Type | Direction | Distance |
|---|---|---|---|
| 1.3247 | 20d Support | ↗ ascending | -0.49% / 65.6 pips |
| 1.3472 | 20d Resistance | ↗ ascending | +1.20% / 160.0 pips |
| 1.3004 | 50d Support | ↘ descending | -2.31% / 307.6 pips |
| 1.3395 | 50d Resistance | ↘ descending | +0.62% / 83.0 pips |
Static Levels
| Level | Type | Touches | Distance |
|---|---|---|---|
| 1.3567 | Resistance | 2× | +2.02% / 268.1 pips |
| 1.3507 | Resistance | 2× | +1.56% / 207.8 pips |
| 1.3480 | Resistance | 2× | +1.36% / 181.2 pips |
| 1.3182 | Support | 2× | -0.88% / 117.2 pips |
| 1.3177 | Support | 2× | -0.91% / 121.6 pips |
| 1.3138 | Support | 2× | -1.21% / 161.3 pips |
GBP/USD is trading at 1.3312 (+0.07%), trapped in a consolidation phase between its 20-day SMA (1.3281, +31.1 pips above) and 50-day SMA (1.3387, -75.5 pips below). The pair is carving out a short-term ascending channel (20-day dynamic support at 1.3247, -65.6 pips; resistance at 1.3472, +160.0 pips) but remains pressured by a broader descending 50-day channel (resistance at 1.3395, +83.0 pips). This creates a technical tug-of-war — bullish momentum near-term but bearish structural resistance overhead.
Static levels highlight immediate battlegrounds: S1 at 1.3182 (-117.2 pips) and R1 at 1.3480 (+181.2 pips), both tested twice previously. The RSI at 57.5 shows neutral momentum, but the proximity to the 20-day ascending support suggests buyers may defend 1.3280-1.3247. A break above the 50-day descending resistance (1.3395) would signal a bullish reversal, while failure to hold 1.3247 opens a test of S1.
The short-term bias leans cautiously bullish within the 20-day channel, but the 50-day descending resistance remains the ceiling. Watch US session flows — a close above the pivot at 1.3318 could trigger a squeeze toward 1.3333 (R1), while a rejection here may see a retest of 1.3287 (S1). The 1.3395-1.3472 zone is the real litmus test for sustained upside.
Disclaimer
The content on MarketsFN.com is provided for educational and informational purposes only and does not constitute financial advice. All investments involve risk and past performance does not guarantee future results.