FTSE 100: Down 0.29% to 10,458 — Price Below SMA-20
MarketsFN Team
FTSE 100: Down 0.29% to 10,458 — Price Below SMA-20
Published: July 09, 2026 · MarketsFN Team
| Index | Price | Change | RSI(14) | SMA-20 | 52W High | 52W Low |
|---|---|---|---|---|---|---|
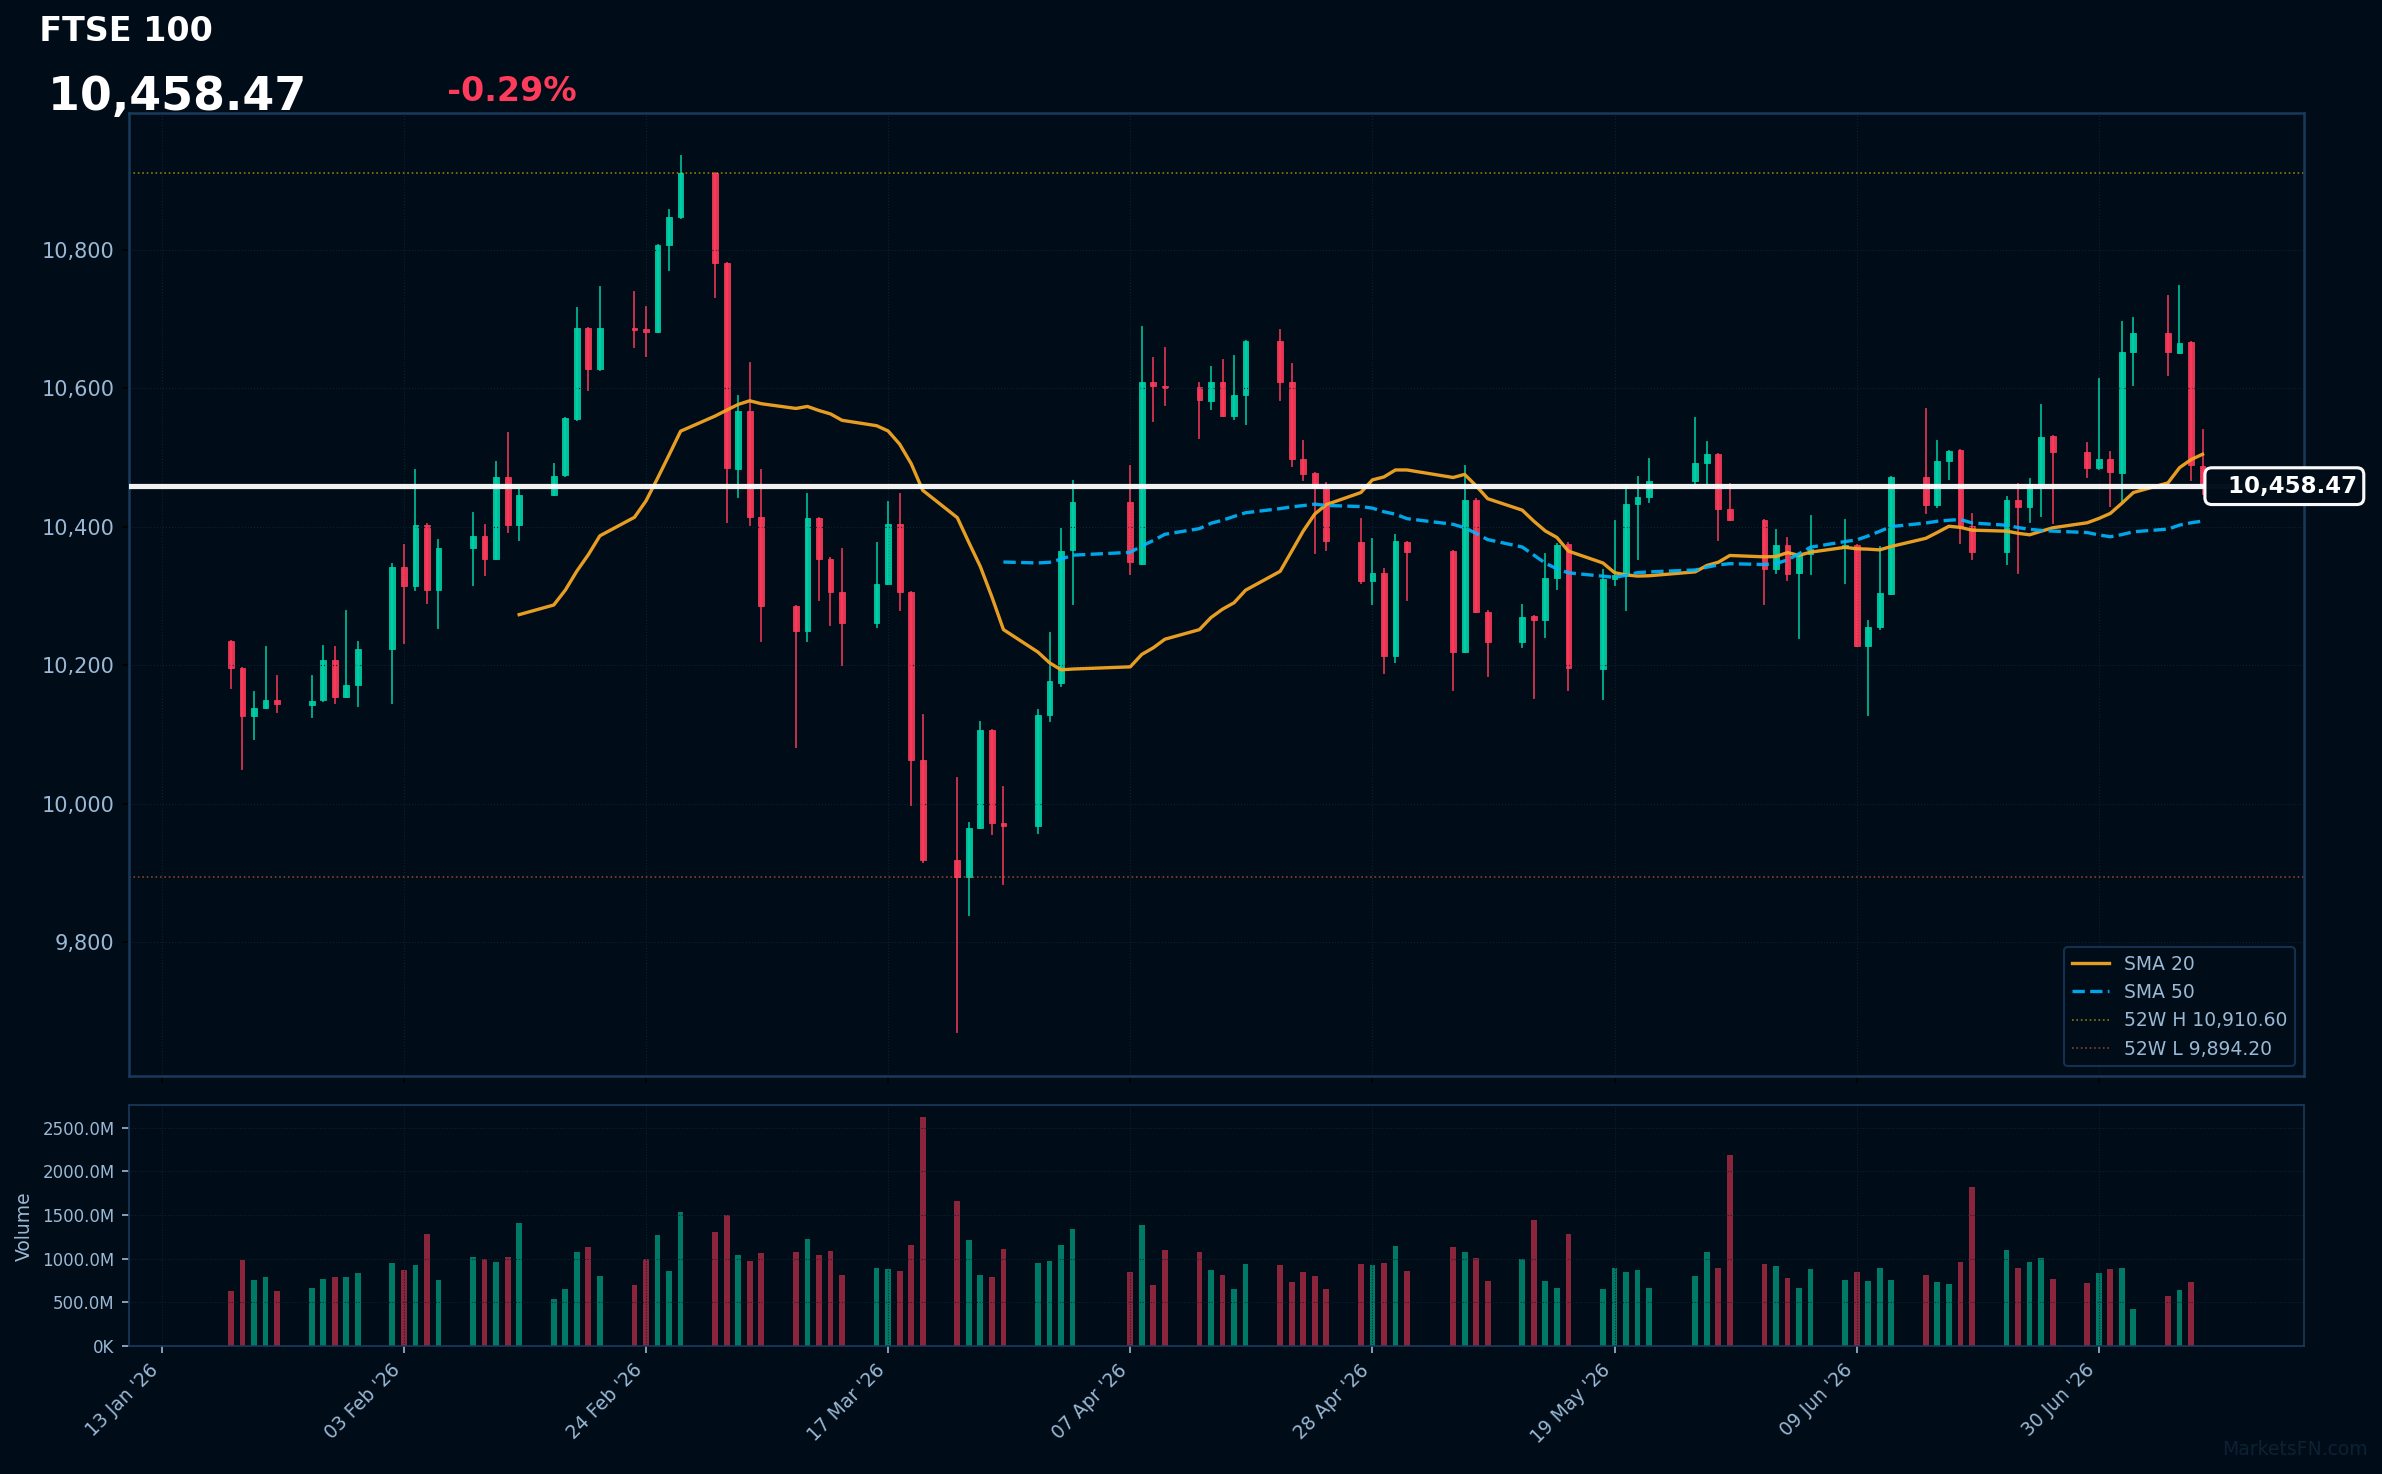
| FTSE 100 | 10,458 | -0.29% | 56.7 | 10,505 | 10,911 | 9,894.20 |
The FTSE 100 is actively quoting at 10,458 (-0.29%), reflecting a slight pullback from the previous close of 10,489. This decline comes amid a broader market sentiment shift, as investors weigh economic data and geopolitical tensions, signaling a cautious approach ahead of potential volatility.
Technically, the index is currently positioned below its 20-day simple moving average (SMA-20) of 10,505, indicating short-term weakness, while it remains above the 50-day SMA of 10,408, suggesting some underlying support. The relative strength index (RSI) stands at 56.7, placing the index in neutral territory, which may indicate a lack of strong momentum in either direction. The FTSE 100 is also trading within a 52-week range, with a high of 10,911 and a low of 9,894.20, highlighting the potential for significant price movement as it approaches these extremes.
Looking ahead, the key resistance level to watch is the 20-day SMA at 10,505, while support is likely to be found near the 50-day SMA at 10,408. A decisive move through these levels could set the tone for the index's direction in the near term.
Disclaimer
The content on MarketsFN.com is provided for educational and informational purposes only. It does not constitute financial advice or investment recommendations. All investments involve risks and past performance does not guarantee future results. You are solely responsible for your investment decisions.