Fibonacci Retracement Analysis: USD/CAD and USD/JPY Near Key Levels
MarketsFN Team
Published: September 16, 2026
Market Overview
The US Dollar remains supported by guidance from Warsh, despite a slight easing from a two-week high as it trades above 99.50 ahead of the Federal Reserve's anticipated rate hike. Asian currencies are mixed as the dollar maintains its strength, with the Japanese yen stabilizing in response. Meanwhile, equity markets face pressure from rising energy costs, impacting consumer sectors.
USD/CAD - U.S. Dollar / Canadian Dollar
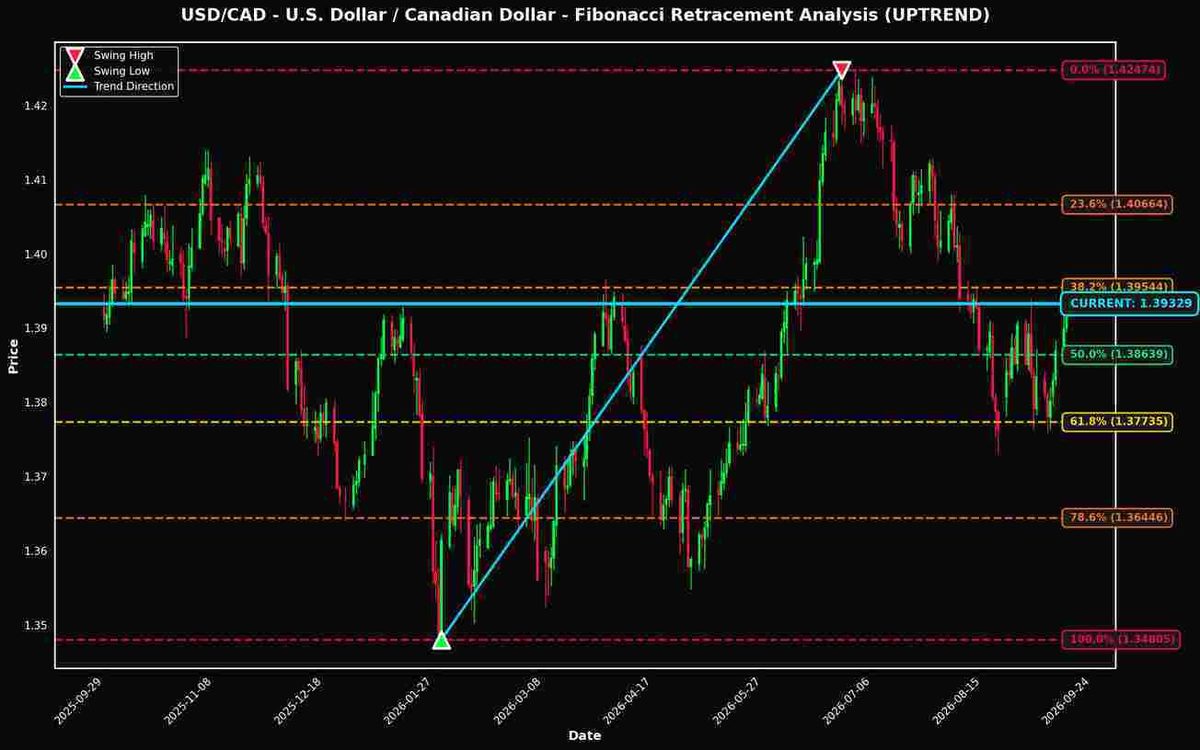
Currently trading at 1.39329 (+0.12% today), USD/CAD is positioned just 0.15% away from the critical 38.2% Fibonacci retracement level, making it a pair to watch closely.

Technical Analysis
### Technical Analysis of USD/CAD Using Fibonacci Retracement Levels As of the current market data, USD/CAD is trading at 1.39329, positioned within an uptrend. The recent swing high of 1.42474 and swing low of 1.34805 provide a solid foundation for Fibonacci retracement analysis. Notably, the price is just 0.15% away from the key 38.2% Fibonacci level, which is situated at 1.39544. The proximity to the 38.2% level is significant as it often acts as a crucial pivot point in trending markets. A close approach to this Fibonacci retracement level can indicate potential reversal or continuation points. If the price breaks above the 38.2% level, it would validate bullish momentum, potentially leading to a test of the next resistance at 23.6% (1.40664). Conversely, a failure to maintain above this level could lead to a retracement towards the 50.0% level at 1.38639, which serves as a critical support zone. Key support and resistance zones are clearly defined in this analysis. Immediate resistance is at 1.39544 (38.2%), followed by 1.40664 (23.6%). On the downside, significant support resides at 1.38639 (50.0%) and further at 1.37735 (61.8%). These levels should be monitored closely, as price action around these zones can provide traders with critical insights into market sentiment. From a trading perspective, traders may consider entering long positions if the price decisively breaks above the 38.2% retracement level, targeting 1.40664 or higher. Conversely, a failure to hold this level may signal a retracement opportunity, prompting potential short positions around 1.38639. In summary, key levels to watch include 1.39544 (38.2%), 1.40664 (23.6%), and 1.38639 (50.0%). Vigilance around these levels will be essential for effective trading strategies in the USD/CAD pair.
Fibonacci Levels
| Level | Price | Distance | Status |
|---|---|---|---|
| 0.0% | 1.42474 | +0.03145 (+2.26%) | ↑ RESISTANCE |
| 23.6% | 1.40664 | +0.01335 (+0.96%) | ↑ RESISTANCE |
| 38.2% | 1.39544 | +0.00215 (+0.15%) | ↑ RESISTANCE |
| 50.0% | 1.38639 | -0.00690 (-0.49%) | ↓ SUPPORT |
| 61.8% | 1.37735 | -0.01594 (-1.14%) | ↓ SUPPORT |
| 78.6% | 1.36446 | -0.02883 (-2.07%) | ↓ SUPPORT |
| 100.0% | 1.34805 | -0.04524 (-3.25%) | ↓ SUPPORT |
USD/JPY - U.S. Dollar / Japanese Yen
Trading at 154.93600 (-0.09% today), USD/JPY is also showing interesting positioning near the 50.0% level (only 0.22% away).
The USD/JPY is currently positioned at 154.93600, just 0.22% above the significant 50.0% Fibonacci retracement level at 155.28350. This proximity suggests that the market is at a critical juncture, with a potential for a bounce or breakdown. The 50.0% level is historically a pivotal area, often acting as a psychological barrier, making it a key support zone in the ongoing uptrend. Above this, resistance can be observed at the 38.2% level of 157.33682 and the 23.6% level of 159.87736, while the swing high of 163.98400 remains the ultimate target. Conversely, should the price break below the 50.0% level, the next support lies at 61.8% around 153.23018. Traders should watch for price action around these Fibonacci levels. A confirmed bounce from 50.0% could signal further upside potential, while a breakdown may indicate a shift in trend dynamics.
Fibonacci Levels
| Level | Price | Distance | Status |
|---|---|---|---|
| 0.0% | 163.98400 | +9.04800 (+5.84%) | ↑ RESISTANCE |
| 23.6% | 159.87736 | +4.94136 (+3.19%) | ↑ RESISTANCE |
| 38.2% | 157.33682 | +2.40082 (+1.55%) | ↑ RESISTANCE |
| 50.0% | 155.28350 | +0.34750 (+0.22%) | ↑ RESISTANCE |
| 61.8% | 153.23018 | -1.70582 (-1.10%) | ↓ SUPPORT |
| 78.6% | 150.30681 | -4.62919 (-2.99%) | ↓ SUPPORT |
| 100.0% | 146.58300 | -8.35300 (-5.39%) | ↓ SUPPORT |
Key Takeaways
- USD/CAD is positioned near the 38.2% Fibonacci level, a historically significant price zone
- USD/JPY is also testing the 50.0% retracement level
- These Fibonacci levels often act as dynamic support and resistance zones
- Traders should monitor price action at these levels for potential trading opportunities
- Risk management remains crucial when trading near Fibonacci retracement levels
Disclaimer
The content on MarketsFN.com is provided for educational and informational purposes only. It does not constitute financial advice, investment recommendations, or trading guidance. All investments involve risks, and past performance does not guarantee future results. You are solely responsible for your investment decisions and should conduct independent research and consult a qualified financial advisor before acting. MarketsFN.com and its authors are not liable for any losses or damages arising from your use of this information.