Fibonacci Retracement Analysis: GBP/USD and USD/JPY Near Key Levels
MarketsFN Team
Published: October 16, 2026
Market Overview
The Japanese Yen is strengthening as the Bank of Japan (BoJ) signals a hawkish stance, with Governor Ueda affirming intentions to raise policy rates. Meanwhile, the US Dollar is facing pressure from a bond rally, which has limited its gains despite strong economic data; this has allowed the Euro to rebound from 17-month lows. Overall, the recent dynamics highlight a shift in market sentiment favoring the Yen and Euro at the Dollar's expense.
GBP/USD - British Pound / U.S. Dollar
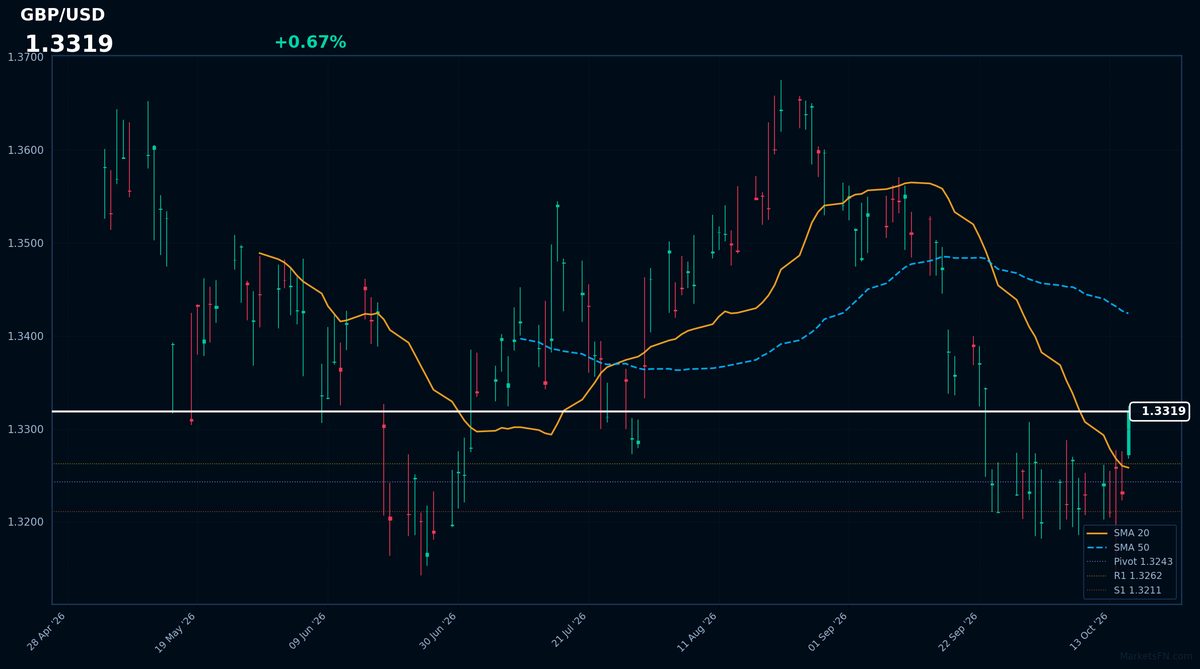
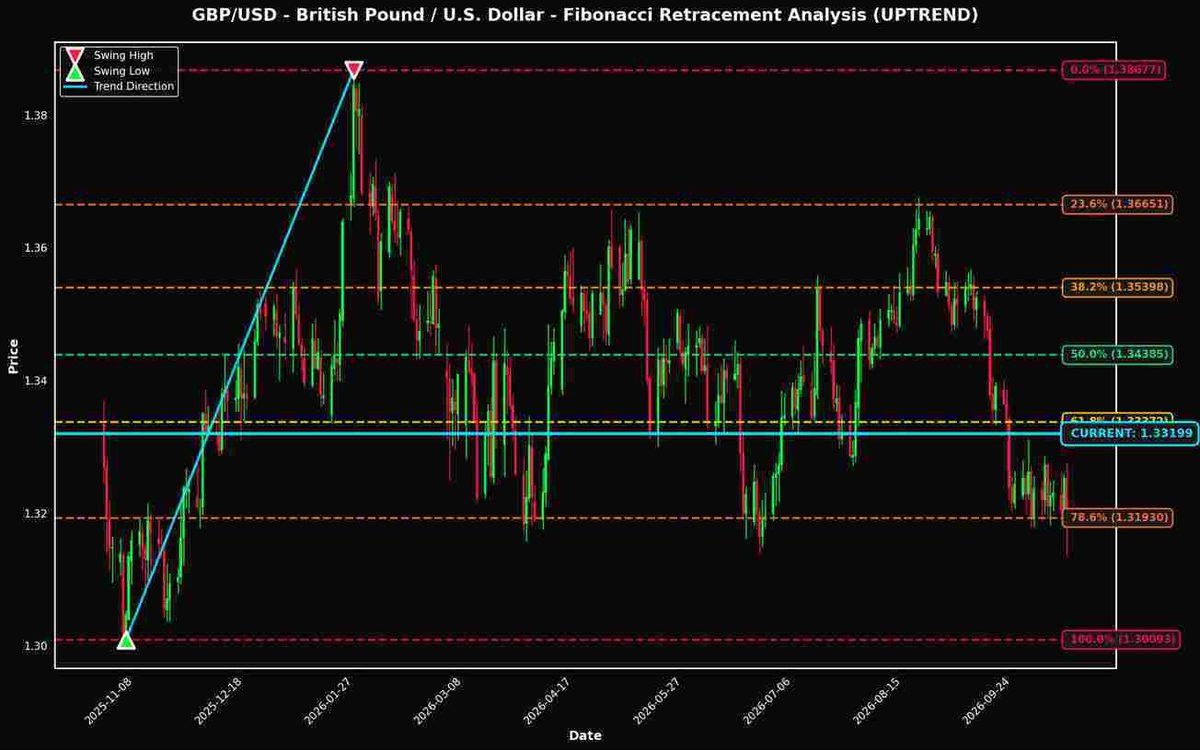
Currently trading at 1.33199 (+1.06% today), GBP/USD is positioned just 0.13% away from the critical 61.8% Fibonacci retracement level, making it a pair to watch closely.

Technical Analysis
**GBP/USD Technical Analysis Using Fibonacci Retracement Levels** As of the current market data, GBP/USD is trading at 1.33199, positioned just 0.13% above the critical 61.8% Fibonacci retracement level of 1.33372. This level is often regarded as a strong support zone, signaling potential reversal points after a significant price movement. Given the prevailing uptrend, the proximity to this Fibonacci level suggests that the market is testing a pivotal area that could either lead to a continuation of the bullish trend or a retracement. The significance of being near the 61.8% level cannot be understated. This level is frequently seen as a major psychological barrier, where buyers may enter the market, bolstering the price if it holds. A sustained breach below this level could indicate weakness, leading to further downside potential towards the 78.6% level at 1.31930. Conversely, if the price remains above 1.33372, it would reinforce bullish sentiment and could propel the currency pair towards the next resistance at the 50.0% level (1.34385) and beyond to the 38.2% level (1.35398). Key support zones are established at 1.31930, while significant resistance levels are identified at the 50.0% and 38.2% Fibonacci retracement levels, which align at 1.34385 and 1.35398, respectively. Traders should monitor price action closely around these levels for potential entry or exit points. In summary, GBP/USD appears to be at a crucial juncture. A close above the 61.8% level may present a buying opportunity, targeting the next resistance levels. However, a failure to hold this level could open the door for a deeper correction. Key levels to watch include 1.33372 (61.8%), 1.31930 (78.6%), and the resistance levels at 1.34385 (50.0%) and 1.35398 (38.2%).
Fibonacci Levels
| Level | Price | Distance | Status |
|---|---|---|---|
| 0.0% | 1.38677 | +0.05478 (+4.11%) | ↑ RESISTANCE |
| 23.6% | 1.36651 | +0.03452 (+2.59%) | ↑ RESISTANCE |
| 38.2% | 1.35398 | +0.02199 (+1.65%) | ↑ RESISTANCE |
| 50.0% | 1.34385 | +0.01186 (+0.89%) | ↑ RESISTANCE |
| 61.8% | 1.33372 | +0.00173 (+0.13%) | ↑ RESISTANCE |
| 78.6% | 1.31930 | -0.01269 (-0.95%) | ↓ SUPPORT |
| 100.0% | 1.30093 | -0.03106 (-2.33%) | ↓ SUPPORT |
USD/JPY - U.S. Dollar / Japanese Yen
Trading at 157.96800 (-0.14% today), USD/JPY is also showing interesting positioning near the 50.0% level (only 0.13% away).
The USD/JPY is currently trading at 157.96800, positioning itself just 0.13% above the critical 50.0% Fibonacci retracement level of 157.75850. This proximity to the 50.0% level, a key psychological barrier, often acts as a strong support zone in an uptrend, suggesting potential for a bounce if tested. Should this level hold, the next resistance is at the 38.2% retracement level of 159.22772, which could attract bullish momentum. Conversely, a break below the 50.0% level would signal a shift in sentiment, with the next support at 61.8% of 156.28928. Traders should watch these Fibonacci levels closely for potential entries or exits. Key price levels to monitor include 157.75850 (50.0%), 159.22772 (38.2%), and 156.28928 (61.8%). The current trend remains bullish, but vigilance is warranted as price approaches these significant retracement levels.
Fibonacci Levels
| Level | Price | Distance | Status |
|---|---|---|---|
| 0.0% | 163.98400 | +6.01600 (+3.81%) | ↑ RESISTANCE |
| 23.6% | 161.04556 | +3.07756 (+1.95%) | ↑ RESISTANCE |
| 38.2% | 159.22772 | +1.25972 (+0.80%) | ↑ RESISTANCE |
| 50.0% | 157.75850 | -0.20950 (-0.13%) | ↓ SUPPORT |
| 61.8% | 156.28928 | -1.67872 (-1.06%) | ↓ SUPPORT |
| 78.6% | 154.19751 | -3.77049 (-2.39%) | ↓ SUPPORT |
| 100.0% | 151.53300 | -6.43500 (-4.07%) | ↓ SUPPORT |
Key Takeaways
- GBP/USD is positioned near the 61.8% Fibonacci level, a historically significant price zone
- USD/JPY is also testing the 50.0% retracement level
- These Fibonacci levels often act as dynamic support and resistance zones
- Traders should monitor price action at these levels for potential trading opportunities
- Risk management remains crucial when trading near Fibonacci retracement levels
Disclaimer
The content on MarketsFN.com is provided for educational and informational purposes only. It does not constitute financial advice, investment recommendations, or trading guidance. All investments involve risks, and past performance does not guarantee future results. You are solely responsible for your investment decisions and should conduct independent research and consult a qualified financial advisor before acting. MarketsFN.com and its authors are not liable for any losses or damages arising from your use of this information.