Fibonacci Retracement Analysis: GBP/USD and AUD/USD Near Key Levels
MarketsFN Team
Fibonacci Retracement Analysis: GBP/USD and AUD/USD Near Key Levels
Published: July 30, 2026
Market Overview
The forex market is reacting to a mix of geopolitical tensions and monetary policy signals, with the Indian Rupee declining as US Treasury yields rise. The dollar experienced its largest drop in nearly a month after the Federal Reserve decided to hold interest rates steady, while Asian currencies remain subdued in anticipation of upcoming decisions from the Bank of England and Bank of Japan. Additionally, the spike in WTI oil prices following US strikes in Iran may further influence currency dynamics, particularly in oil-dependent economies.
GBP/USD - British Pound / U.S. Dollar
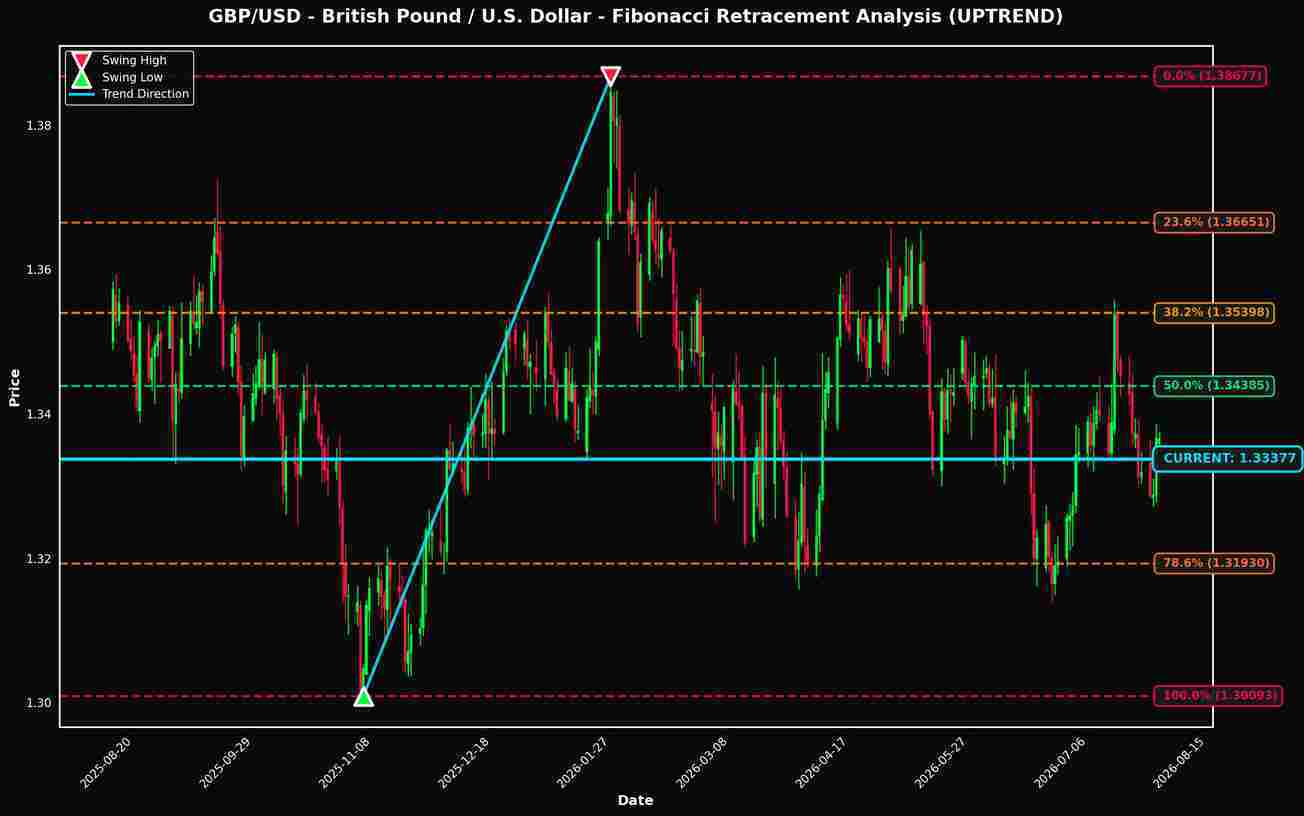
Currently trading at 1.33377 (-0.22% today), GBP/USD is positioned just 0.00% away from the critical 61.8% Fibonacci retracement level, making it a pair to watch closely.

Technical Analysis
**GBP/USD Technical Analysis: Fibonacci Retracement Levels** As of the current market data, GBP/USD is trading at 1.33377, positioning itself near the critical 61.8% Fibonacci retracement level at 1.33372, making it a focal point for traders. This level is significant as it is often regarded as a strong area of potential support within an uptrend, indicating a high probability of price reversal or consolidation. The proximity to the 61.8% retracement suggests that the market may experience buying interest, particularly given the prevailing uptrend. A bounce off this level could indicate continued bullish momentum, with the next resistance target at the 50.0% level of 1.34385, which aligns with a potential bullish breakout scenario. Conversely, if the price fails to hold above the 61.8% level, it could trigger a retracement towards the 78.6% level at 1.31930, a critical support zone where further bullish interest may emerge. Key support and resistance zones are delineated as follows: immediate support is found at 1.33372 (61.8%), with secondary support at 1.31930 (78.6%). On the resistance front, levels to watch include 1.34385 (50.0%) and further up at 1.36651 (23.6%), both of which could serve as targets for bullish traders should the upward momentum persist. In terms of trading implications, holding above the 61.8% level could present an attractive buying opportunity for traders looking to capitalize on potential upward movement, targeting the resistance at 1.34385. Alternatively, a decisive break below 1.33372 could trigger a more significant bearish sentiment, leading traders to reassess long positions and consider shorting opportunities. In summary, the key levels to monitor are 1.33372 (61.8%), 1.34385 (50.0%), and 1.31930 (78.6%). Traders should remain vigilant for price action around these levels to make informed trading decisions.
Fibonacci Levels
| Level | Price | Distance | Status |
|---|---|---|---|
| 0.0% | 1.38677 | +0.05300 (+3.97%) | ↑ RESISTANCE |
| 23.6% | 1.36651 | +0.03274 (+2.45%) | ↑ RESISTANCE |
| 38.2% | 1.35398 | +0.02021 (+1.52%) | ↑ RESISTANCE |
| 50.0% | 1.34385 | +0.01008 (+0.76%) | ↑ RESISTANCE |
| 61.8% | 1.33372 | -0.00005 (-0.00%) | ↓ SUPPORT |
| 78.6% | 1.31930 | -0.01447 (-1.08%) | ↓ SUPPORT |
| 100.0% | 1.30093 | -0.03284 (-2.46%) | ↓ SUPPORT |
AUD/USD - Australian Dollar / U.S. Dollar
Trading at 0.69509 (-0.03% today), AUD/USD is also showing interesting positioning near the 38.2% level (only 0.05% away).
The AUD/USD is currently positioned at 0.69509, just 0.05% above the critical 38.2% Fibonacci retracement level of 0.69473. This proximity suggests a pivotal moment, as the 38.2% level often serves as a strong support in an uptrend. Should the price hold above this level, it could reaffirm bullish sentiment, potentially targeting the 23.6% retracement at 0.70734 for further gains. Key support is established at the 50.0% level of 0.68454, which would be a significant zone to monitor if the market retraces. Conversely, resistance is poised at the swing high of 0.72772, marking an important psychological barrier. Traders should watch for price action around these critical levels. A decisive move above 0.70734 could signal further bullish momentum, while a break below 0.69473 may indicate a trend reversal, necessitating caution in long positions.
Fibonacci Levels
| Level | Price | Distance | Status |
|---|---|---|---|
| 0.0% | 0.72772 | +0.03263 (+4.69%) | ↑ RESISTANCE |
| 23.6% | 0.70734 | +0.01225 (+1.76%) | ↑ RESISTANCE |
| 38.2% | 0.69473 | -0.00036 (-0.05%) | ↓ SUPPORT |
| 50.0% | 0.68454 | -0.01055 (-1.52%) | ↓ SUPPORT |
| 61.8% | 0.67434 | -0.02075 (-2.98%) | ↓ SUPPORT |
| 78.6% | 0.65983 | -0.03526 (-5.07%) | ↓ SUPPORT |
| 100.0% | 0.64135 | -0.05374 (-7.73%) | ↓ SUPPORT |
Key Takeaways
- GBP/USD is positioned near the 61.8% Fibonacci level, a historically significant price zone
- AUD/USD is also testing the 38.2% retracement level
- These Fibonacci levels often act as dynamic support and resistance zones
- Traders should monitor price action at these levels for potential trading opportunities
- Risk management remains crucial when trading near Fibonacci retracement levels
Disclaimer
The content on MarketsFN.com is provided for educational and informational purposes only. It does not constitute financial advice, investment recommendations, or trading guidance. All investments involve risks, and past performance does not guarantee future results. You are solely responsible for your investment decisions and should conduct independent research and consult a qualified financial advisor before acting. MarketsFN.com and its authors are not liable for any losses or damages arising from your use of this information.