Fibonacci Retracement Analysis: EUR/USD and USD/JPY Near Key Levels
MarketsFN Team
Fibonacci Retracement Analysis: EUR/USD and USD/JPY Near Key Levels
Published: September 03, 2026
Market Overview
The US dollar faces upside risks according to ING, while the USD/CAD pair has declined to near 1.3850 after dropping below its nine-day EMA. Asian currencies are gaining strength, particularly the yen, which is approaching the 158 level amid renewed intervention risks, indicating a potential shift in market sentiment.
EUR/USD - Euro / U.S. Dollar
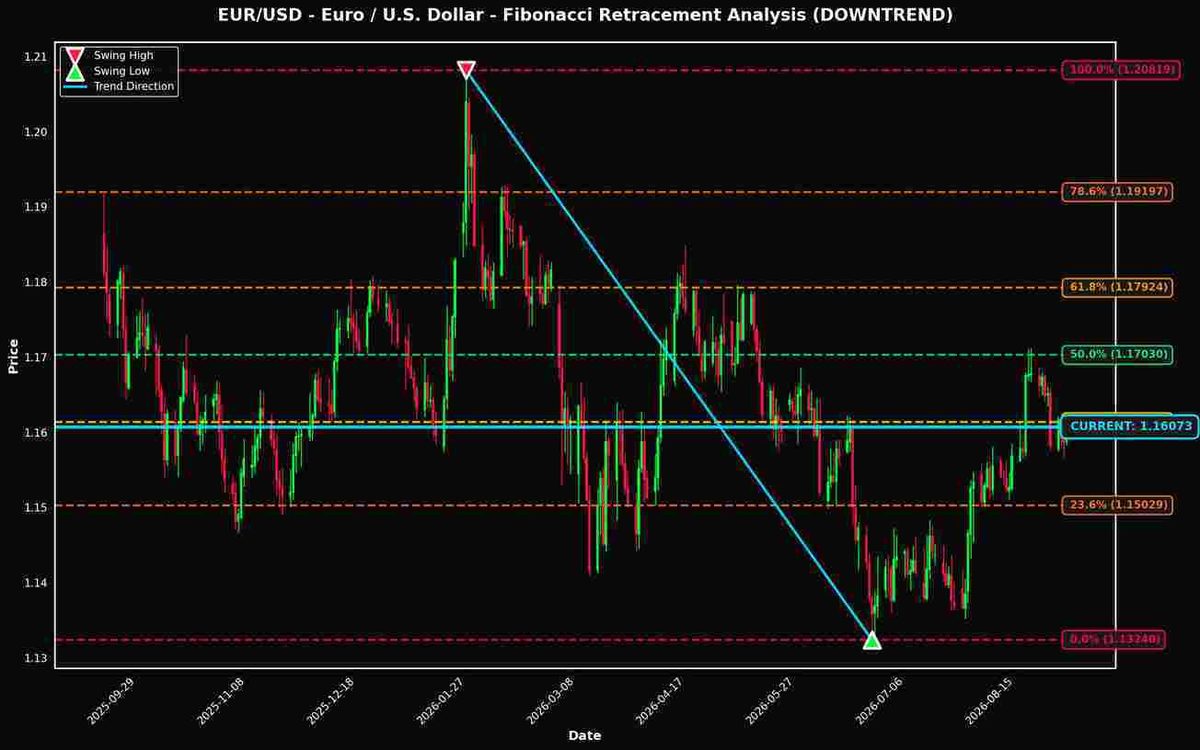
Currently trading at 1.16073 (+0.17% today), EUR/USD is positioned just 0.05% away from the critical 38.2% Fibonacci retracement level, making it a pair to watch closely.

Technical Analysis
As of the current market data, the EUR/USD pair is trading at 1.16073, positioned just slightly above the key Fibonacci retracement level of 38.2% at 1.16135. This proximity (only 0.05% away) suggests that the market is experiencing heightened volatility and could be at a critical juncture. Given the prevailing downtrend, this level acts as a potential resistance point where sellers may emerge, reaffirming the bearish sentiment. The 38.2% retracement level is often regarded as a significant pivot point in Fibonacci analysis. It typically serves as a psychological barrier, where traders anticipate either a continuation of the downtrend or a potential reversal. If the price fails to breach this level convincingly, it reinforces the downtrend, potentially targeting the next support at the 23.6% retracement at 1.15029. Key resistance zones are evident around the 50.0% level at 1.17030 and the 61.8% level at 1.17924. A move back above 1.17030 could signal a shift in momentum and invalidate the immediate downtrend, prompting buyers to step in. Conversely, should the price descend below the 23.6% level, it may trigger further selling pressure, bringing the swing low of 1.13240 into focus. From a trading perspective, the immediate implications suggest a cautious approach. A rejection at the 38.2% Fibonacci level could provide short-selling opportunities, targeting the next support zones. Conversely, if the price can breach and sustain above 1.16135, traders may consider long positions with targets set at the 50.0% level. In summary, traders should closely monitor the 38.2% retracement level at 1.16135, as well as the critical support at 1.15029 and resistance at 1.17030. These levels will play a vital role in determining the short-term directional bias for the EUR/USD pair.
Fibonacci Levels
| Level | Price | Distance | Status |
|---|---|---|---|
| 100.0% | 1.20819 | +0.04746 (+4.09%) | ↑ RESISTANCE |
| 78.6% | 1.19197 | +0.03124 (+2.69%) | ↑ RESISTANCE |
| 61.8% | 1.17924 | +0.01851 (+1.59%) | ↑ RESISTANCE |
| 50.0% | 1.17030 | +0.00957 (+0.82%) | ↑ RESISTANCE |
| 38.2% | 1.16135 | +0.00062 (+0.05%) | ↑ RESISTANCE |
| 23.6% | 1.15029 | -0.01044 (-0.90%) | ↓ SUPPORT |
| 0.0% | 1.13240 | -0.02833 (-2.44%) | ↓ SUPPORT |
USD/JPY - U.S. Dollar / Japanese Yen
Trading at 156.63800 (-1.30% today), USD/JPY is also showing interesting positioning near the 38.2% level (only 0.18% away).
As of the current price of 156.63800, USD/JPY is positioned just 0.18% below the crucial 38.2% Fibonacci retracement level at 156.91433. This proximity indicates potential support, reinforcing the bullish trend. The significance of the 38.2% level lies in its role as a critical reversal point; a bounce from this zone could confirm ongoing bullish momentum. Key resistance is identified at the 23.6% level (159.61635), while strong support exists at the 50.0% level (154.73050). A breach below the 50.0% could indicate a shift in market sentiment, warranting caution. Traders should monitor these Fibonacci levels closely for potential entry points. A confirmed reversal at the 38.2% level could present a buying opportunity, while a break below the 50.0% level could signal a trend reversal. Overall, the 156.91433 and 154.73050 levels are critical markers for upcoming price action.
Fibonacci Levels
| Level | Price | Distance | Status |
|---|---|---|---|
| 0.0% | 163.98400 | +7.34600 (+4.69%) | ↑ RESISTANCE |
| 23.6% | 159.61635 | +2.97835 (+1.90%) | ↑ RESISTANCE |
| 38.2% | 156.91433 | +0.27633 (+0.18%) | ↑ RESISTANCE |
| 50.0% | 154.73050 | -1.90750 (-1.22%) | ↓ SUPPORT |
| 61.8% | 152.54667 | -4.09133 (-2.61%) | ↓ SUPPORT |
| 78.6% | 149.43750 | -7.20050 (-4.60%) | ↓ SUPPORT |
| 100.0% | 145.47700 | -11.16100 (-7.13%) | ↓ SUPPORT |
Key Takeaways
- EUR/USD is positioned near the 38.2% Fibonacci level, a historically significant price zone
- USD/JPY is also testing the 38.2% retracement level
- These Fibonacci levels often act as dynamic support and resistance zones
- Traders should monitor price action at these levels for potential trading opportunities
- Risk management remains crucial when trading near Fibonacci retracement levels
Disclaimer
The content on MarketsFN.com is provided for educational and informational purposes only. It does not constitute financial advice, investment recommendations, or trading guidance. All investments involve risks, and past performance does not guarantee future results. You are solely responsible for your investment decisions and should conduct independent research and consult a qualified financial advisor before acting. MarketsFN.com and its authors are not liable for any losses or damages arising from your use of this information.