EUR/USD: Up 0.29% to 1.1621 — Ascending Channel
MarketsFN Team
EUR/USD: Up 0.29% to 1.1621 — Ascending Channel
Published: September 03, 2026 · MarketsFN Team · US Session
| Pair | Rate | Change | RSI(14) | SMA-20 | SMA-50 | 52W High | 52W Low | Pivot | R1 | S1 |
|---|---|---|---|---|---|---|---|---|---|---|
| EUR/USD | 1.1621 | +0.29% | 57.8 | 1.1604 | 1.1503 | 1.2041 | 1.1358 | 1.1587 | 1.1609 | 1.1566 |
📊 Support & Resistance Levels
Dynamic Trendlines
| Level | Type | Direction | Distance |
|---|---|---|---|
| 1.1570 | 20d Support | ↗ ascending | -0.44% / 51.0 pips |
| 1.1746 | 20d Resistance | ↗ ascending | +1.08% / 125.1 pips |
| 1.1548 | 50d Support | ↗ ascending | -0.62% / 72.3 pips |
| 1.1779 | 50d Resistance | ↗ ascending | +1.36% / 158.5 pips |
Static Levels
| Level | Type | Touches | Distance |
|---|---|---|---|
| 1.1779 | Resistance | 2× | +1.36% / 158.1 pips |
| 1.1729 | Resistance | 2× | +0.93% / 107.9 pips |
| 1.1668 | Resistance | 2× | +0.40% / 46.8 pips |
| 1.1616 | Support | 2× | -0.04% / 4.7 pips |
| 1.1575 | Support | 3× | -0.40% / 46.1 pips |
| 1.1505 | Support | 2× | -0.99% / 115.3 pips |
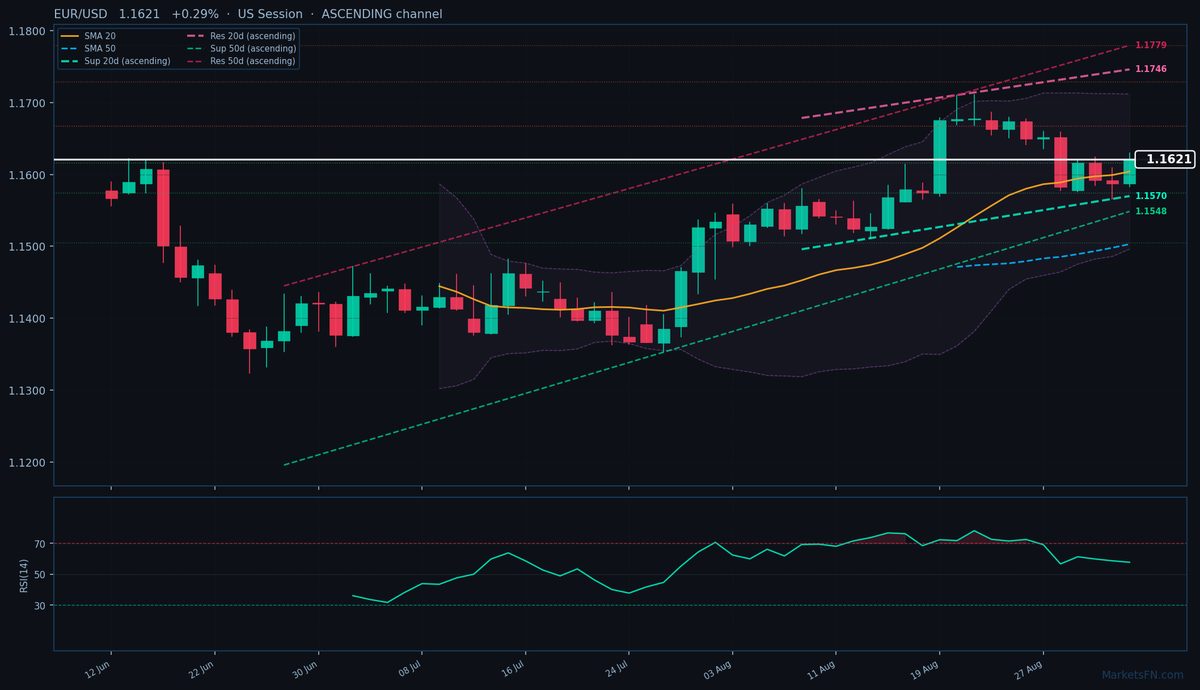
EUR/USD is trading at 1.1621 (+0.29%), extending its grind higher within a well-defined ascending channel as both 20-day and 50-day dynamic trendlines slope upward. The pair is now trading above both its 20-day SMA (1.1604) and 50-day SMA (1.1503), confirming the short-to-medium-term uptrend. Immediate dynamic support sits at 1.1570 (-51.0 pips), while overhead dynamic resistance looms at 1.1746 (+125.1 pips) — a break above which could accelerate gains toward the 50-day channel top at 1.1779 (+158.5 pips).
Static levels show congestion near current prices, with S1 at 1.1616 (-4.7 pips) acting as intraday support and R1 at 1.1668 (+46.8 pips) as the nearest resistance. The RSI at 57.8 suggests neutral momentum, leaving room for further upside before overbought conditions emerge. With the ATR(14) at 0.0046, today’s 47-pip range (1.1583–1.1630) is in line with recent volatility.
The short-term bias remains bullish as long as price holds above the 20-day SMA (1.1604) and the ascending dynamic support at 1.1570. A close above R1 (1.1668) would confirm bullish continuation toward the 20-day dynamic resistance (1.1746). Conversely, failure to hold S1 (1.1616) could trigger a retest of the 20-day SMA. The US session’s price action relative to 1.1616 will be key — a rejection here would signal persistent buying pressure.
Disclaimer
The content on MarketsFN.com is provided for educational and informational purposes only and does not constitute financial advice. All investments involve risk and past performance does not guarantee future results.