EUR/USD: Down 0.43% to 1.1548 — RSI Oversold
MarketsFN Team
EUR/USD: Down 0.43% to 1.1548 — RSI Oversold
Published: September 14, 2026 · MarketsFN Team · US Session
| Pair | Rate | Change | RSI(14) | SMA-20 | SMA-50 | 52W High | 52W Low | Pivot | R1 | S1 |
|---|---|---|---|---|---|---|---|---|---|---|
| EUR/USD | 1.1548 | -0.43% | 30.0 | 1.1625 | 1.1530 | 1.2041 | 1.1358 | 1.1595 | 1.1620 | 1.1572 |
📊 Support & Resistance Levels
Dynamic Trendlines
| Level | Type | Direction | Distance |
|---|---|---|---|
| 1.1523 | 20d Support | → flat | -0.22% / 25.1 pips |
| 1.1640 | 20d Resistance | ↘ descending | +0.80% / 92.3 pips |
| 1.1523 | 50d Support | ↗ ascending | -0.22% / 25.2 pips |
| 1.1853 | 50d Resistance | ↗ ascending | +2.64% / 304.7 pips |
Static Levels
| Level | Type | Touches | Distance |
|---|---|---|---|
| 1.1668 | Resistance | 2× | +1.04% / 119.8 pips |
| 1.1654 | Resistance | 2× | +0.92% / 106.7 pips |
| 1.1640 | Resistance | 2× | +0.80% / 92.3 pips |
| 1.1505 | Support | 2× | -0.37% / 42.3 pips |
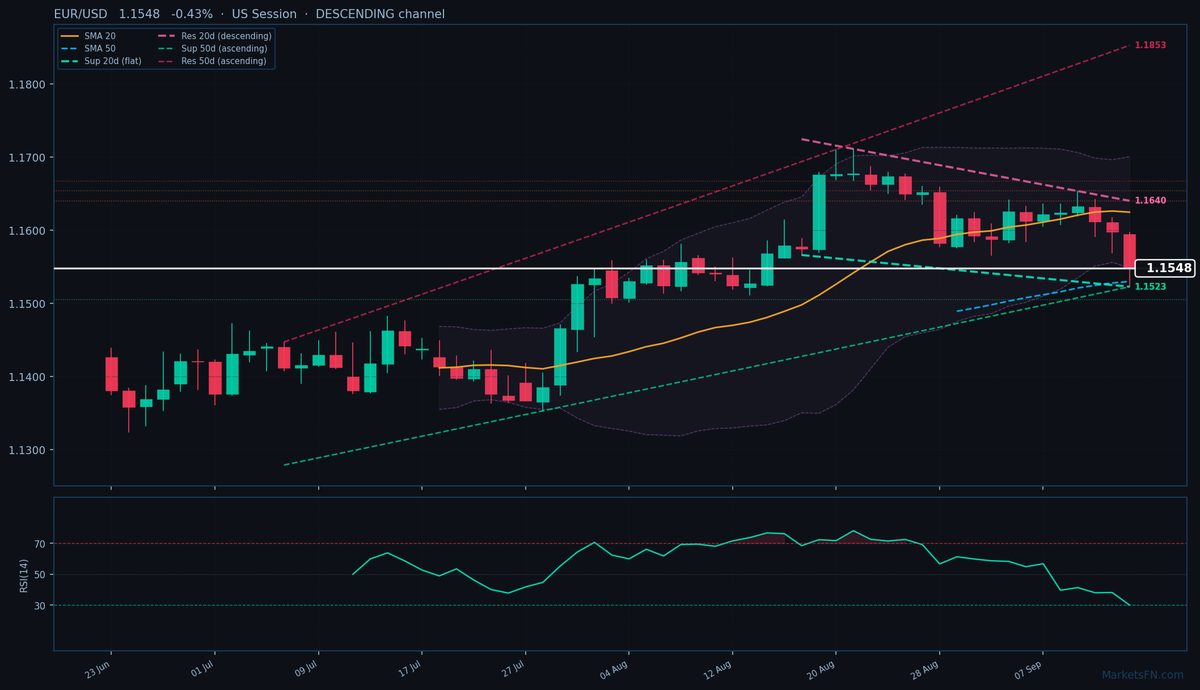
EUR/USD is trading at 1.1548 (-0.43%), caught in a consolidation phase between its SMA-50 (1.1530, support) and SMA-20 (1.1625, resistance). The pair is testing the lower bounds of its descending 20-day channel, with dynamic resistance at 1.1640 (92.3 pips above) and flat dynamic support at 1.1523 (25.1 pips below). The broader 50-day channel remains ascending, but the near-term downtrend dominates as price action struggles below the 20-day SMA.
Static levels frame the immediate range, with S1 support at 1.1505 (42.3 pips below) and R1 resistance at 1.1640 (92.3 pips above), aligning with the 20-day dynamic resistance. The RSI at 30.0 signals oversold conditions, suggesting potential for a technical bounce, but the descending channel and failure to reclaim the SMA-20 keep bears in control. Today’s low at 1.1523 — coinciding with dynamic support — is critical; a break could accelerate losses toward the 1.1505 static level.
Short-term, the pair faces pressure unless it clears 1.1620 (R1 pivot) to challenge the SMA-20. The descending 20-day channel’s slope (-0.22% daily) versus the ascending 50-day channel (+0.03% daily) highlights conflicting signals. Watch for a close above 1.1572 (S1 pivot) to confirm stabilization, while a break below 1.1523 risks testing the 1.1505 static support. US session liquidity will determine whether oversold RSI conditions trigger a relief rally or further downside.
Disclaimer
The content on MarketsFN.com is provided for educational and informational purposes only and does not constitute financial advice. All investments involve risk and past performance does not guarantee future results.