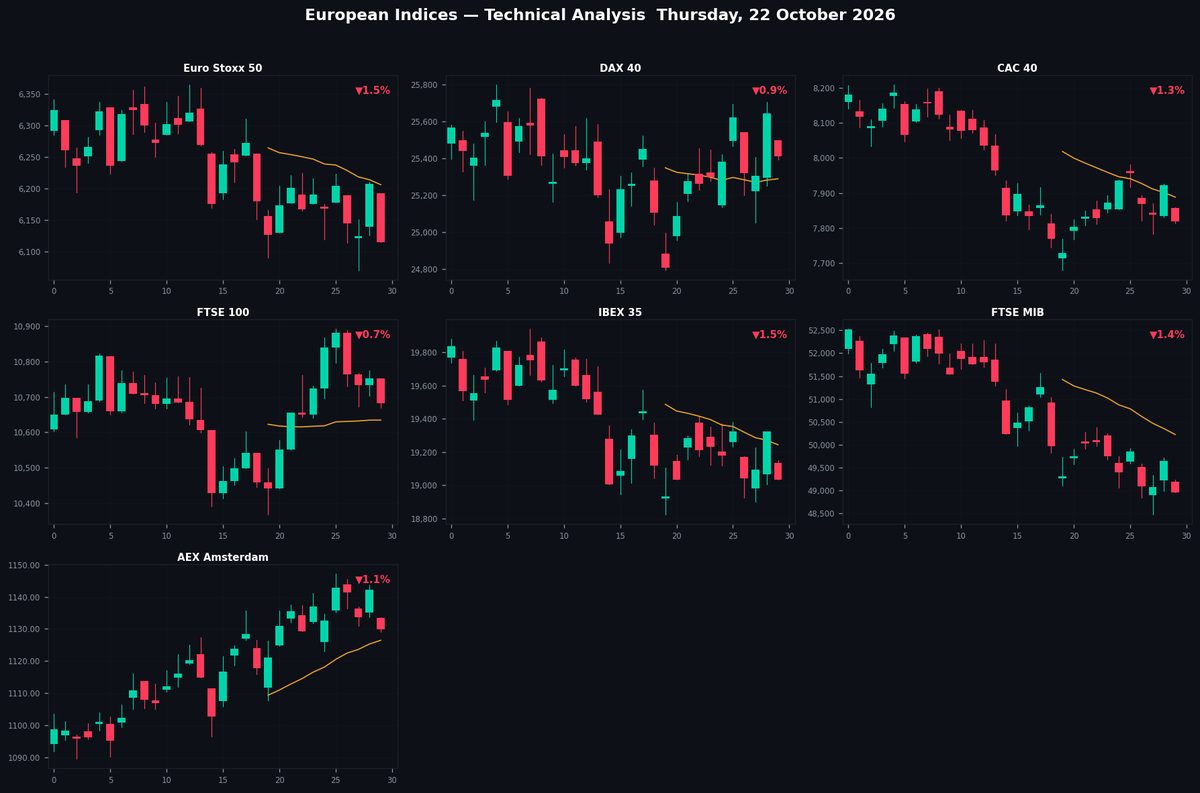
Technical analysis update for the seven major European equity indices on Thursday, 22 October 2026.
Charts cover 65 sessions (daily bars) with SMA-20, SMA-50, Bollinger Bands (20,2),
dynamic support/resistance trendlines (20-day and 50-day), and pivot-cluster S/R levels.
| Code |
Index |
Last |
Chg% |
RSI |
52W H |
52W L |
| STOXX50 | Euro Stoxx 50 | 6,115 | ▼1.49% | 40.2 | 6,577 | 5,377 |
| DAX | DAX 40 | 25,412 | ▼0.91% | 46.3 | 26,619 | 21,864 |
| CAC40 | CAC 40 | 7,818 | ▼1.31% | 44.9 | 8,755 | 7,505 |
| FTSE100 | FTSE 100 | 10,682 | ▼0.66% | 55.7 | 10,990 | 9,424 |
| IBEX35 | IBEX 35 | 19,034 | ▼1.50% | 41.8 | 20,356 | 15,725 |
| FTSEMIB | FTSE MIB | 48,961 | ▼1.38% | 38.6 | 54,042 | 41,616 |
| AEX | AEX Amsterdam | 1,129.92 | ▼1.08% | 49.5 | 1,147.35 | 916.79 |
STOXX50
Euro Stoxx 50
6,115
▼1.49%
RSI 40

Double Top — Bearish 57%Double Bottom — Bullish 50%Flag — Bullish 69%
20d: Sup descending 6,011 (-1.7%) Res descending 6,201 (+1.4%)
50d: Sup descending 6,023 (-1.5%) Res descending 6,257 (+2.3%)
S/R Levels
| R3 | 6,538 | +6.9% | ★★★☆☆ |
| R2 | 6,369 | +4.1% | ★★★★☆ |
| R1 | 6,165 | +0.8% | ★★★★★ |
|
6,115
52W 5,377–6,577
|
| S1 | 5,975 | -2.3% | ★★★★★ |
| S2 | 5,729 | -6.3% | ★★★★☆ |
| S3 | 5,438 | -11.1% | ★★★☆☆ |
Moving Averages
| SMA 20 | 6,206 | below -1.5% |
| SMA 50 | 6,309 | below -3.1% |
| SMA 200 | 6,104 | above +0.2% |
Price below SMA20 & SMA50 — bearish structure
Price above SMA200 (+0.2%) — long-term uptrend
Analysis
The Euro Stoxx 50 trades at 6,115, down 1.49%, with the RSI-14 at 40 indicating neutral momentum. The index remains below the SMA20 (6,206) and SMA50 (6,309), signaling short-term bearish pressure, though it hovers just above the SMA200 (6,104), a key long-term support. Resistance levels are seen at 6,165 (R1), 6,369 (R2), and 6,538 (R3), while supports lie at 5,975 (S1), 5,729 (S2), and 5,438 (S3). Multiple bearish double-top patterns suggest potential downside, though confirmation remains weak. Descending trendlines reinforce resistance near 6,201 (20-day) and 6,257 (50-day). A break below SMA200 could accelerate declines, while reclaiming SMA20 may ease bearish pressure. The near-term bias remains cautiously negative.
DAX
DAX 40
25,412
▼0.91%
RSI 46

Double Top — Bearish 50%Double Bottom — Bullish 50%
20d: Sup ascending 24,880 (-2.1%) Res ascending 25,717 (+1.2%)
50d: Sup descending 24,411 (-3.9%) Res descending 25,683 (+1.1%)
S/R Levels
| R2 | 26,596 | +4.7% | ★★★★☆ |
| R1 | 25,662 | +1.0% | ★★★★★ |
|
25,412
52W 21,864–26,619
|
| S1 | 24,731 | -2.7% | ★★★★★ |
| S2 | 24,171 | -4.9% | ★★★★☆ |
| S3 | 23,523 | -7.4% | ★★★☆☆ |
Moving Averages
| SMA 20 | 25,289 | above +0.5% |
| SMA 50 | 25,647 | below -0.9% |
| SMA 200 | 24,880 | above +2.1% |
Price between SMA20 and SMA50 — mixed signal
Price above SMA200 (+2.1%) — long-term uptrend
Analysis
The DAX 40 trades at 25,412, down 0.91%, with the RSI-14 at 46 indicating neutral momentum. The index remains above the SMA20 (25,289) but below the SMA50 (25,647), reflecting short-term consolidation within a broader downtrend. Key resistance levels are R1 at 25,662 and R2 at 26,596, while supports sit at S1 (24,731), S2 (24,171), and S3 (23,523). Multiple bearish double-top patterns suggest potential downside, with confidence levels ranging from 50% to 91%. Trendlines show ascending 20-day support at 24,880 and resistance at 25,717, while the 50-day descending resistance at 25,683 reinforces overhead pressure. A break below SMA20 could accelerate declines toward S1.
CAC40
CAC 40
7,818
▼1.31%
RSI 45

Double Top — Bearish 50%Double Bottom — Bullish 50%Flag — Bullish 68%
20d: Sup descending 7,616 (-2.6%) Res descending 7,937 (+1.5%)
50d: Sup descending 7,481 (-4.3%) Res descending 7,923 (+1.3%)
S/R Levels
| R3 | 8,464 | +8.3% | ★★★☆☆ |
| R2 | 8,266 | +5.7% | ★★★★☆ |
| R1 | 7,984 | +2.1% | ★★★★★ |
|
7,818
52W 7,505–8,755
|
| S1 | 7,705 | -1.4% | ★★★★★ |
| S2 | 7,514 | -3.9% | ★★★★☆ |
Moving Averages
| SMA 20 | 7,888 | below -0.9% |
| SMA 50 | 8,133 | below -3.9% |
| SMA 200 | 8,214 | below -4.8% |
Price below SMA20 & SMA50 — bearish structure
Price below SMA200 (-4.8%) — long-term downtrend
Analysis
The CAC 40 trades at 7,818, down 1.31%, with the RSI-14 at 45 indicating neutral momentum. The index remains below key SMAs (20d: 7,888; 50d: 8,133; 200d: 8,214), confirming bearish pressure. Resistance levels are noted at 7,984 (R1), 8,266 (R2), and 8,464 (R3), while support sits at 7,705 (S1) and 7,514 (S2). Multiple bearish Double Top patterns (50%-95% confidence) suggest further downside potential. Short-term trendlines show descending resistance at 7,937 (20d) and 7,923 (50d), reinforcing the bearish bias. A break below 7,705 may accelerate declines toward 7,514, while a move above 7,984 could signal a near-term reversal. The broader trend remains weak unless SMA resistance is reclaimed.
FTSE100
FTSE 100
10,682
▼0.66%
RSI 56

Double Top — Bearish 93%Double Bottom — Bullish 81%
20d: Sup ascending 10,490 (-1.8%) Res ascending 10,930 (+2.3%)
50d: Sup descending 10,320 (-3.4%) Res descending 10,883 (+1.9%)
S/R Levels
| R1 | 10,851 | +1.6% | ★★★★★ |
|
10,682
52W 9,424–10,990
|
| S1 | 10,372 | -2.9% | ★★★★★ |
| S2 | 10,115 | -5.3% | ★★★★☆ |
| S3 | 9,622 | -9.9% | ★★★☆☆ |
Moving Averages
| SMA 20 | 10,635 | above +0.4% |
| SMA 50 | 10,707 | below -0.2% |
| SMA 200 | 10,506 | above +1.7% |
Price between SMA20 and SMA50 — mixed signal
Price above SMA200 (+1.7%) — long-term uptrend
Analysis
The FTSE 100 trades at 10,682, down 0.66%, as bearish pressure persists following multiple confirmed Double Top patterns with high confidence levels. The index remains caught between key SMAs, with the 20-day (10,635) providing near-term support and the 50-day (10,707) acting as resistance. The RSI-14 at 56 suggests neutral momentum, though the pattern breakdown risks further downside. Immediate resistance sits at 10,851, while support levels are layered at 10,372, 10,115, and 9,622. Trendlines show a short-term ascending channel (10,490-10,930), but the 50-day descending resistance (10,883) reinforces bearish bias. A break below 10,635 could accelerate declines toward 10,372.
IBEX35
IBEX 35
19,034
▼1.50%
RSI 42

Double Top — Bearish 82%Double Bottom — Bullish 50%
20d: Sup descending 18,631 (-2.1%) Res descending 19,296 (+1.4%)
50d: Sup descending 18,556 (-2.5%) Res descending 19,545 (+2.7%)
S/R Levels
| R3 | 20,342 | +6.9% | ★★★☆☆ |
| R2 | 20,008 | +5.1% | ★★★★☆ |
| R1 | 19,495 | +2.4% | ★★★★★ |
|
19,034
52W 15,725–20,356
|
| S1 | 18,015 | -5.4% | ★★★★★ |
| S2 | 17,468 | -8.2% | ★★★★☆ |
| S3 | 16,545 | -13.1% | ★★★☆☆ |
Moving Averages
| SMA 20 | 19,244 | below -1.1% |
| SMA 50 | 19,607 | below -2.9% |
| SMA 200 | 18,642 | above +2.1% |
Price below SMA20 & SMA50 — bearish structure
Price above SMA200 (+2.1%) — long-term uptrend
Analysis
The IBEX 35 trades at 19,034, down 1.50%, with the RSI-14 at 42 indicating neutral momentum. The index remains below key SMAs (20d: 19,244; 50d: 19,607), signaling bearish near-term pressure, though the 200d SMA at 18,642 offers long-term support. Resistance levels are noted at 19,495 (R1), 20,008 (R2), and 20,342 (R3), while supports sit at 18,015 (S1), 17,468 (S2), and 16,545 (S3). Multiple bearish Double Top patterns (82%, 50%, 95% confidence) suggest potential downside. Trendlines show descending resistance at 19,296 (20d) and 19,545 (50d), with descending supports at 18,631 (20d) and 18,556 (50d). The technical setup favors caution amid bearish signals and weakening price structure.
FTSEMIB
FTSE MIB
48,961
▼1.38%
RSI 39

Double Top — Bearish 94%Double Bottom — Bullish 66%
20d: Sup descending 47,771 (-2.4%) Res descending 49,671 (+1.4%)
50d: Sup descending 48,317 (-1.3%) Res descending 51,004 (+4.2%)
S/R Levels
| R3 | 54,042 | +10.4% | ★★★☆☆ |
| R2 | 52,925 | +8.1% | ★★★★☆ |
| R1 | 50,214 | +2.6% | ★★★★★ |
|
48,961
52W 41,616–54,042
|
| S1 | 45,246 | -7.6% | ★★★★★ |
| S2 | 42,862 | -12.5% | ★★★★☆ |
| S3 | 41,669 | -14.9% | ★★★☆☆ |
Moving Averages
| SMA 20 | 50,224 | below -2.5% |
| SMA 50 | 51,480 | below -4.9% |
| SMA 200 | 49,281 | below -0.6% |
Price below SMA20 & SMA50 — bearish structure
Price below SMA200 (-0.6%) — long-term downtrend
Analysis
The FTSE MIB declines 1.38% to 48,961, reinforcing bearish momentum as price remains below key SMAs (20d: 50,224; 50d: 51,480). The RSI-14 at 39 suggests mild oversold conditions but lacks bullish divergence. A confirmed Double Top pattern (94% confidence) signals further downside risk, with immediate resistance at descending trendlines (20d: 49,671; 50d: 51,004). Support holds at the 200d SMA (49,281), though a break could target S1 (45,246). The index faces layered resistance at R1 (50,214) and R2 (52,925), while sustained selling pressure below the 20d/50d SMAs favors bearish continuation. Near-term bias remains negative unless recovery reclaims 50,224.
AEX
AEX Amsterdam
1,129.92
▼1.08%
RSI 50

Double Top — Bearish 95%Double Bottom — Bullish 68%
20d: Sup ascending 1,129.04 (-0.1%) Res ascending 1,153.18 (+2.1%)
50d: Sup ascending 1,103.13 (-2.4%) Res ascending 1,149.43 (+1.7%)
S/R Levels
| R1 | 1,147.35 | +1.5% | ★★★★★ |
|
1,129.92
52W 916.79–1,147.35
|
| S1 | 1,092.00 | -3.4% | ★★★★★ |
| S2 | 988.23 | -12.5% | ★★★★☆ |
| S3 | 944.33 | -16.4% | ★★★☆☆ |
Moving Averages
| SMA 20 | 1,126.46 | above +0.3% |
| SMA 50 | 1,113.83 | above +1.4% |
| SMA 200 | 1,052.90 | above +7.3% |
Price above SMA20 & SMA50 — bullish structure
Price above SMA200 (+7.3%) — long-term uptrend
Analysis
The AEX Amsterdam trades at 1,130, down 1.08%, testing near-term support at the ascending 20-day SMA (1,126). The RSI-14 at 50 reflects neutral momentum, while the price remains above key moving averages (SMA50 at 1,114, SMA200 at 1,053), suggesting a broader uptrend. However, three double-top patterns—two with high confidence (95%)—signal potential bearish reversal risks. Immediate resistance sits at R1 (1,147), with support at S1 (1,092). The 20-day trendline support (1,129) is under pressure, while resistance converges near 1,149–1,153. A break below 1,126 could accelerate declines toward 1,092, whereas holding above may retest resistance. Caution is warranted given the bearish patterns.
Disclaimer
The content on MarketsFN.com is provided for educational and informational purposes only. It does not constitute financial advice or investment recommendations. All investments involve risks and past performance does not guarantee future results. You are solely responsible for your investment decisions.