Ethereum, Dogecoin, and Ripple Lead Crypto Market Gains Today.
QuoteReporter
•5 min read
Ethereum, Dogecoin, and Ripple Lead Crypto Market Gains Today.
Crypto Market Report | September 11, 2026
📊 Crypto Market Overview
The cryptocurrency market is currently exhibiting a positive sentiment, with most major assets trading in the green. Bitcoin, the largest cryptocurrency by market capitalization, is trading at $77,365.9688, having risen by 1.04% over the past 24 hours. The Relative Strength Index (RSI) for Bitcoin stands at 48.3, indicating a neutral position, while the Moving Average Convergence Divergence (MACD) is at 2034.9222, suggesting a potential for continued upward momentum.
Other major cryptocurrencies, such as Ethereum and Solana, are also seeing gains, with Ethereum up 1.52% to $2,474.0300 and Solana rising by 1.17% to $99.8400. The RSI values for these assets are 53.0 and 42.6, respectively, indicating a relatively neutral to slightly oversold condition. BNB is also trading positively, having risen by 0.75% to $714.4800, with an RSI of 55.7.
The macro context remains relevant, with recent news headlines highlighting developments in the regulatory and technological landscape. For instance, the introduction of the revised CLARITY Act targets 'non-decentralized' DeFi operators, while India is making strides in tokenizing its $620 billion corporate bond market using digital rupee settlement. Additionally, Ripple is incorporating AI agents into its $1 billion corporate treasury bet, underscoring the ongoing integration of artificial intelligence in cryptocurrency and blockchain applications.
From a technical perspective, the MACD values for the major cryptocurrencies are generally positive, with Ethereum and BNB displaying values above their respective signal lines. However, the RSI values for most assets are not indicating extreme oversold or overbought conditions, suggesting a relatively balanced market at present. Overall, the cryptocurrency market is currently characterized by a positive sentiment, driven by a combination of technological advancements and ongoing developments in the regulatory environment.
Other major cryptocurrencies, such as Ethereum and Solana, are also seeing gains, with Ethereum up 1.52% to $2,474.0300 and Solana rising by 1.17% to $99.8400. The RSI values for these assets are 53.0 and 42.6, respectively, indicating a relatively neutral to slightly oversold condition. BNB is also trading positively, having risen by 0.75% to $714.4800, with an RSI of 55.7.
The macro context remains relevant, with recent news headlines highlighting developments in the regulatory and technological landscape. For instance, the introduction of the revised CLARITY Act targets 'non-decentralized' DeFi operators, while India is making strides in tokenizing its $620 billion corporate bond market using digital rupee settlement. Additionally, Ripple is incorporating AI agents into its $1 billion corporate treasury bet, underscoring the ongoing integration of artificial intelligence in cryptocurrency and blockchain applications.
From a technical perspective, the MACD values for the major cryptocurrencies are generally positive, with Ethereum and BNB displaying values above their respective signal lines. However, the RSI values for most assets are not indicating extreme oversold or overbought conditions, suggesting a relatively balanced market at present. Overall, the cryptocurrency market is currently characterized by a positive sentiment, driven by a combination of technological advancements and ongoing developments in the regulatory environment.
📰 Crypto News
- Bitwise to put down Dogecoin ETF less than a year after launch
- SBF asks Supreme Court to overturn conviction, $11B forfeiture: Report
- Here’s what happened in crypto today
- Revised CLARITY Act targets ‘non-decentralized’ DeFi operators
- Brevo login flaw enabled phishing email targeting 347K Trezor subscribers
- Metaplanet equity backlash, SE Asia crypto funding doubles: Asia Express
- Kalshi wants 24/7 Tesla and Nvidia perps as Wall Street fights over who regulates them
- India starts tokenizing $620 billion corporate bond market with digital rupee settlement
- Bitcoin below $77,000, Zcash leads losses as traders bet on a Fed rate hike
- Ripple puts AI agents inside its $1 billion corporate treasury bet
- Senate Republicans Release Revised Clarity Act Ahead of September 15 Vote
- DeepSeek's New Model Nearly Matches GPT-6 Astra on Design—at 1.4% of the Cost
- AI Agents Just Slashed the Cost of a Quantum Attack on Bitcoin
🔍 Technical Analysis
Bitcoin (BTC) — +1.04%
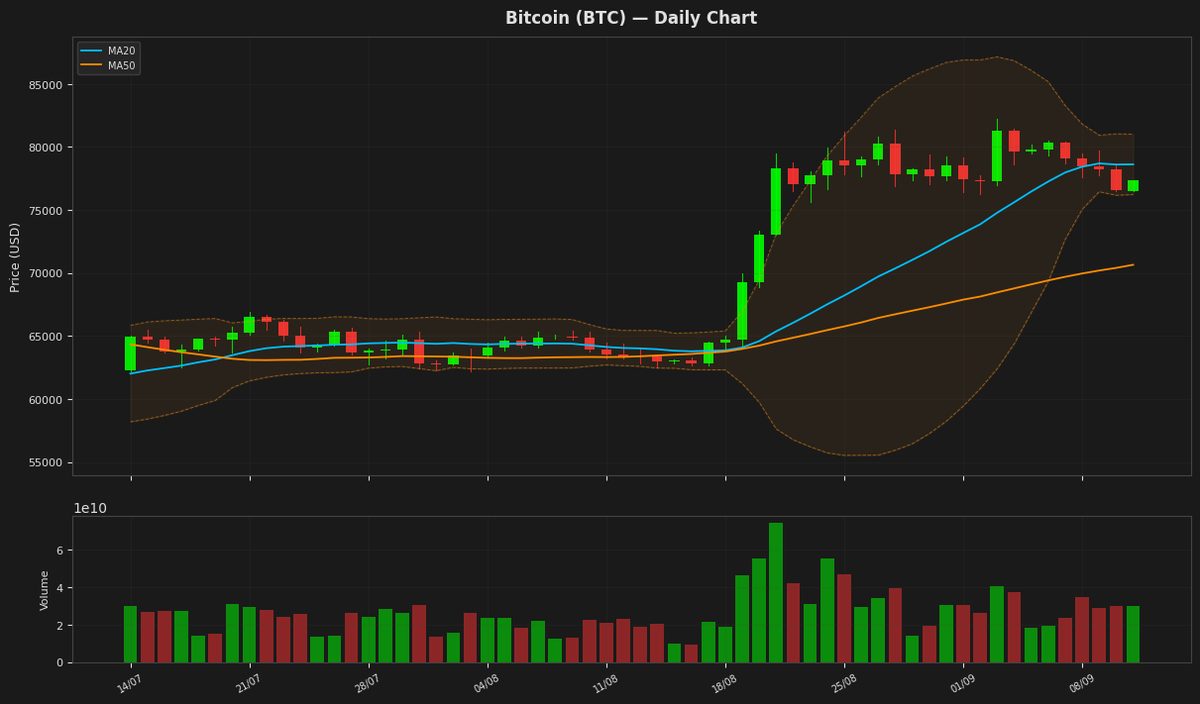
$77,365.97 52W: $57,747.77 — $97,860.60
Bitcoin is currently trading at $77,365.97 with a slight increase of 1.04% in a day, positioned between the Bollinger Band upper and lower limits of $81,022.72 and $76,220.46 respectively. The RSI of 48.34 indicates a neutral market sentiment, while the MACD being below its signal line suggests a potential bearish trend. The price is above both the MA20 and MA50, indicating a generally positive trend.
Ethereum (ETH) — +1.52%
$2,474.03 52W: $1,506.51 — $3,397.90
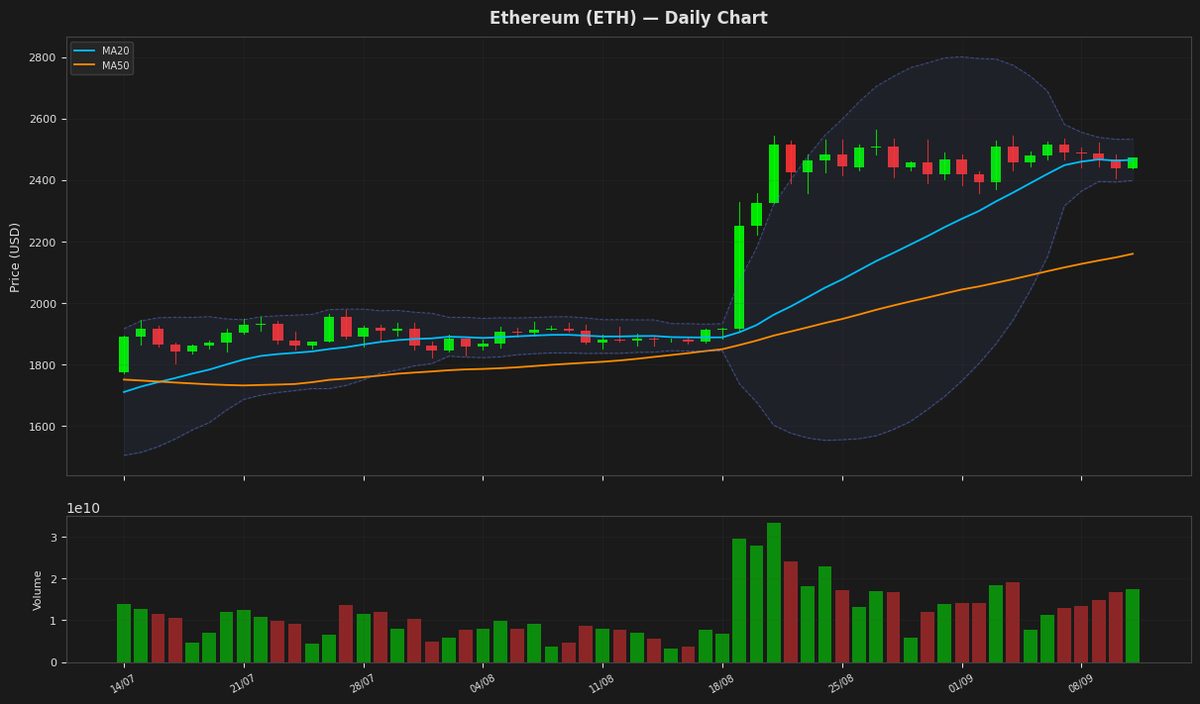
Ethereum is currently trading at $2,474.03, near its 20-day moving average of $2,465.66, indicating a lack of strong directional momentum. The RSI reading of 53.03 suggests a neutral market sentiment, while the MACD line being below its signal line indicates a potential bearish signal. The price is also within the Bollinger Bands, with the upper and lower bands at $2,532.92 and $2,398.40 respectively, indicating moderate volatility.
Ripple (XRP) — +1.23%
$1.3518 52W: $0.988422 — $2.4103
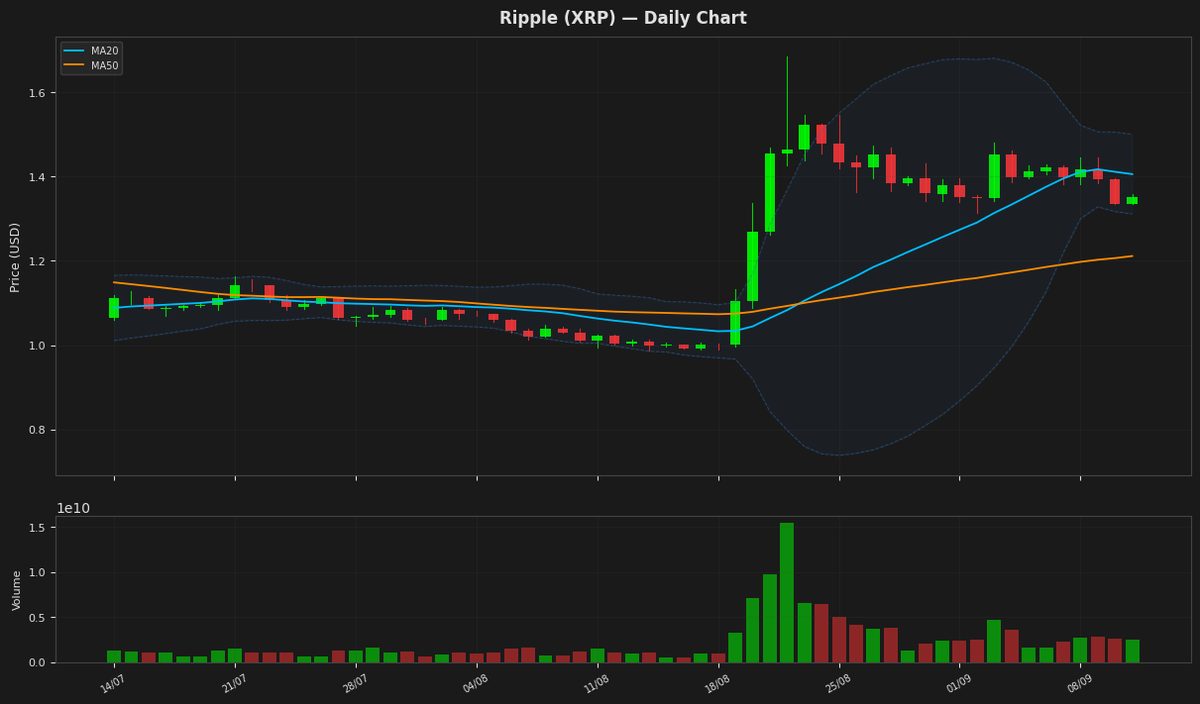
Ripple's price is currently at $1.351800, showing a slight increase, and is positioned between its 20-day and 50-day moving averages, indicating a potential consolidation phase. The RSI is near the neutral zone, suggesting a lack of strong momentum. The MACD is below its signal line, indicating a potential bearish signal. The Bollinger Bands suggest that the price is relatively close to the lower band.
Solana (SOL) — +1.17%
$99.8400 52W: $60.4147 — $148.2160
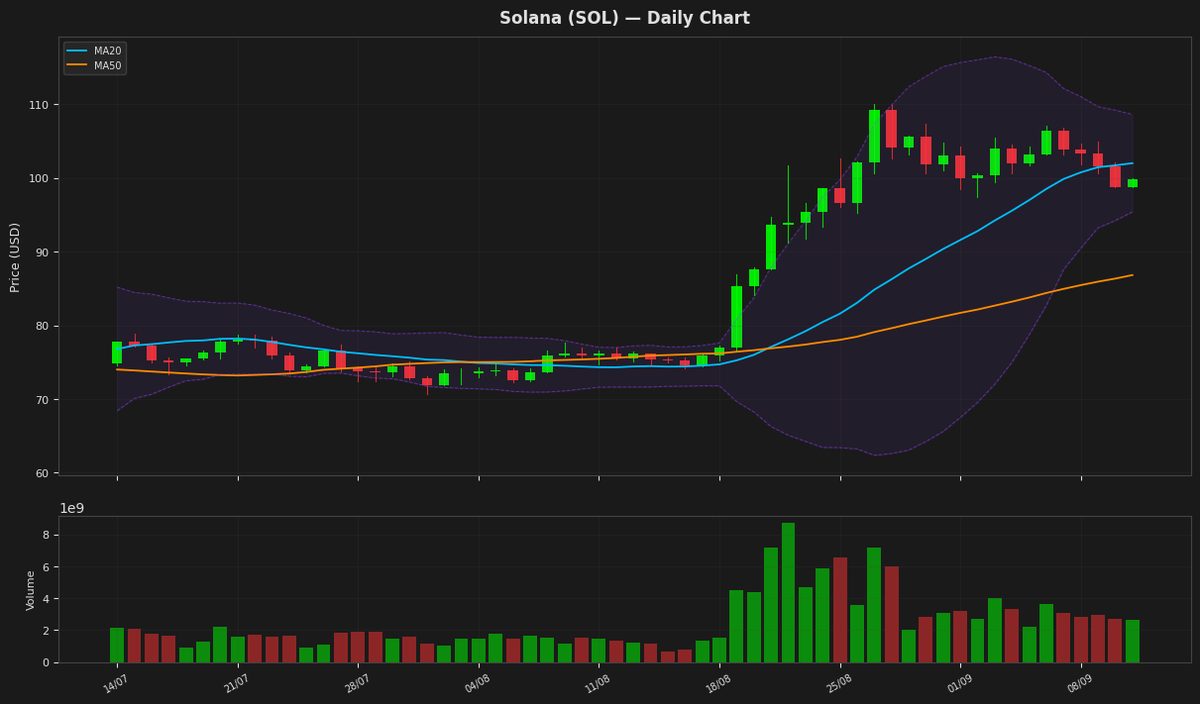
Solana's price is currently at $99.84, showing a slight increase of 1.17% for the day, and is positioned between its 20-day moving average of $101.99 and the lower Bollinger Band at $95.38. The RSI indicates a neutral to slightly oversold condition at 42.57, while the MACD is below its signal line, suggesting a potential bearish trend. The ATR indicates moderate volatility.
BNB (BNB) — +0.75%
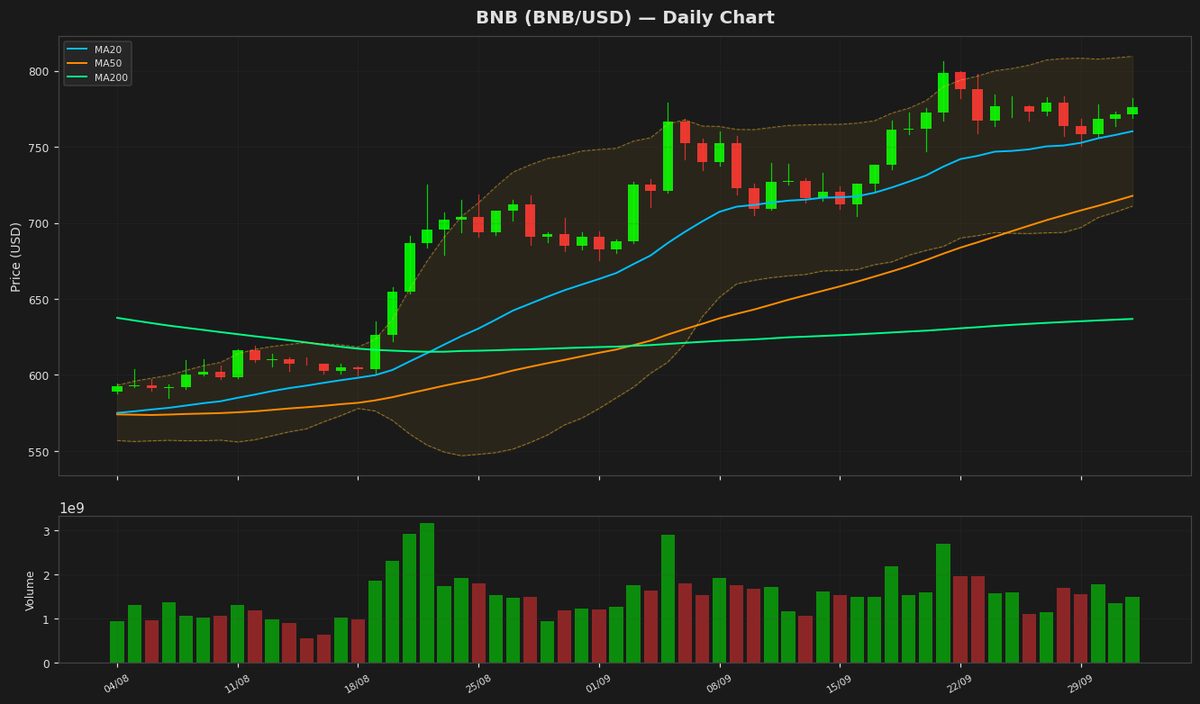
$714.4800 52W: $538.5992 — $954.8583
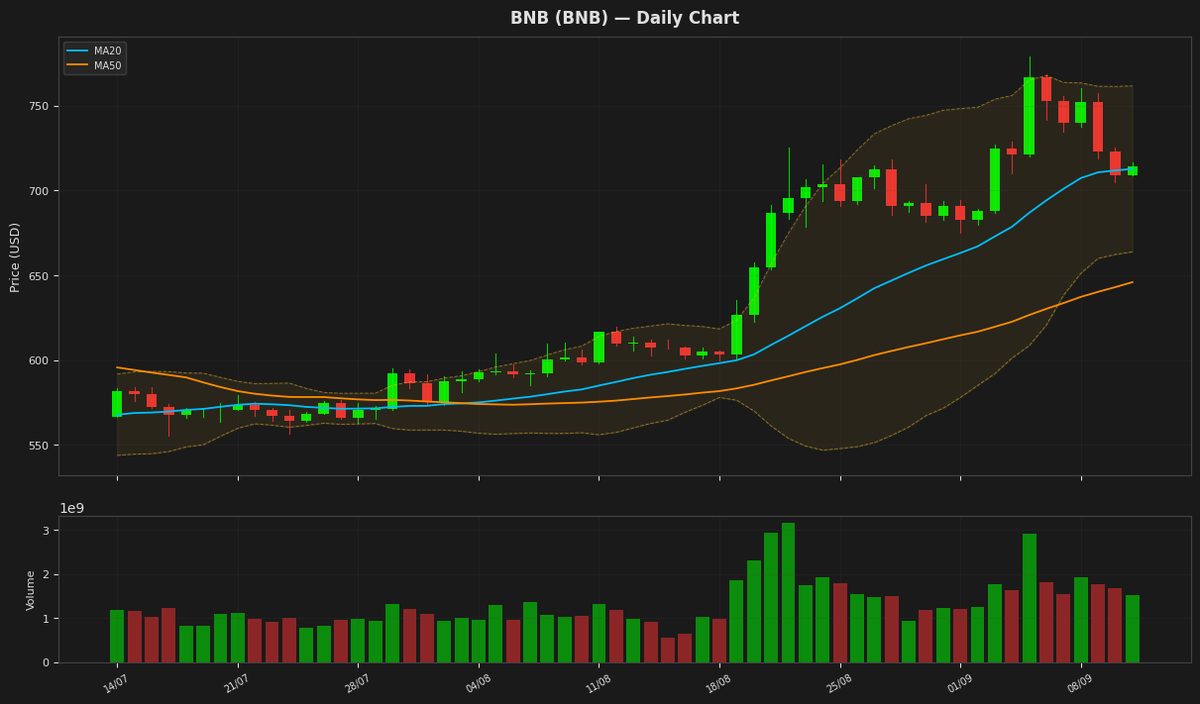
BNB is trading at $714.48 with a slight increase of 0.75% and is currently positioned above its 20-day moving average of $712.72, indicating a potential continuation of the uptrend. The Relative Strength Index (RSI) at 55.74 suggests a neutral to slightly bullish sentiment, while the MACD below its signal line may indicate a potential short-term correction. The price is also within the Bollinger Bands, with the upper band at $761.68 and lower band at $663.75.
Tron (TRX) — -0.37%
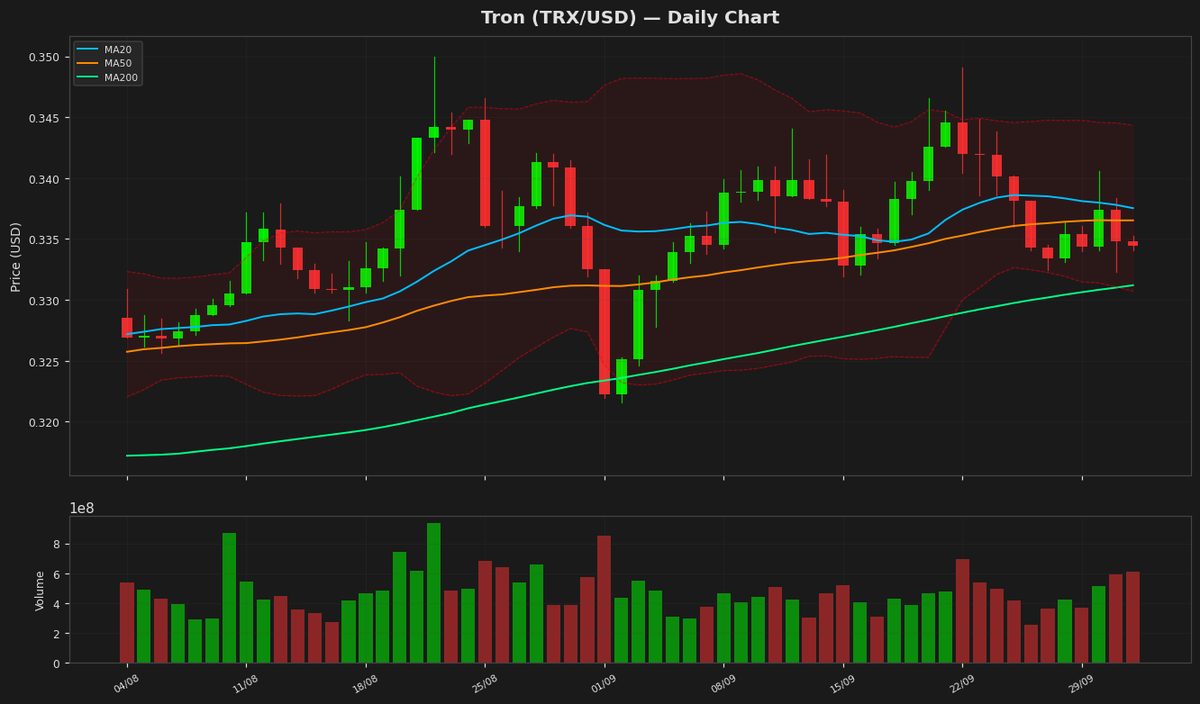
$0.338615 52W: $0.268138 — $0.376332
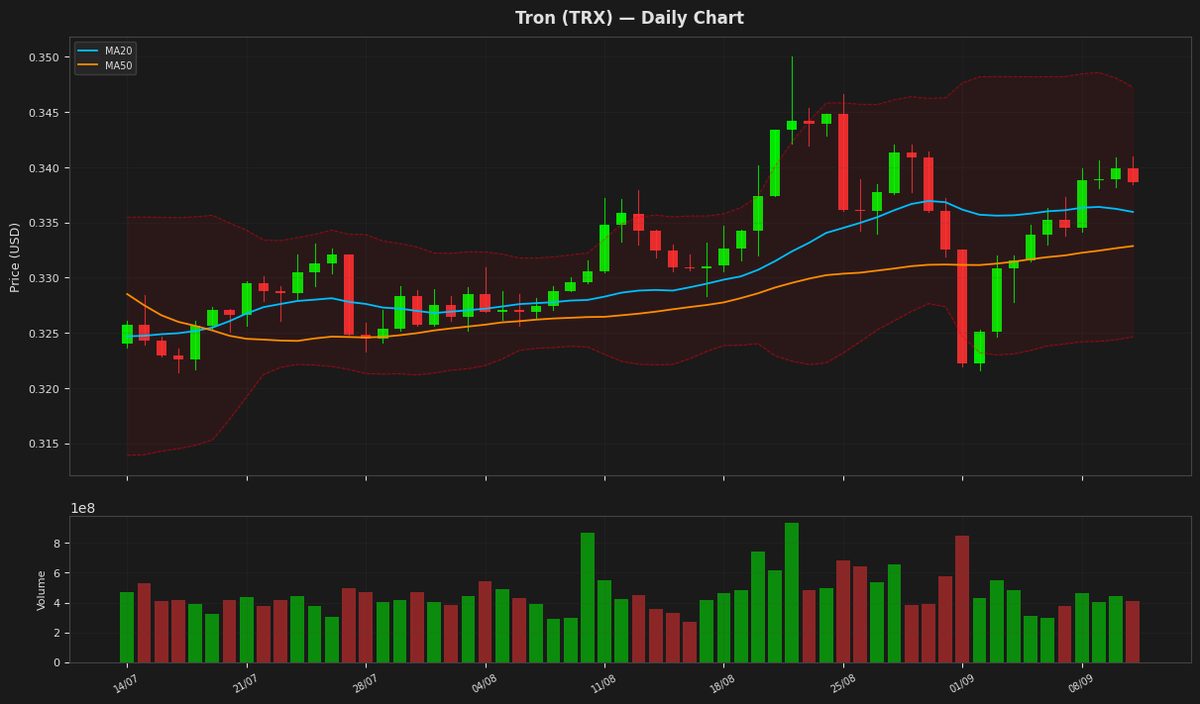
Tron's price is currently at $0.338615, slightly above its MA20 and MA50, indicating a neutral trend. The RSI is at 46.532809, suggesting a balanced market with no extreme buying or selling pressure. The MACD is above its signal line, indicating a potential bullish crossover. The price is also within the Bollinger Bands, with the upper and lower bands at $0.347253 and $0.324641 respectively.
Dogecoin (DOGE) — +1.24%
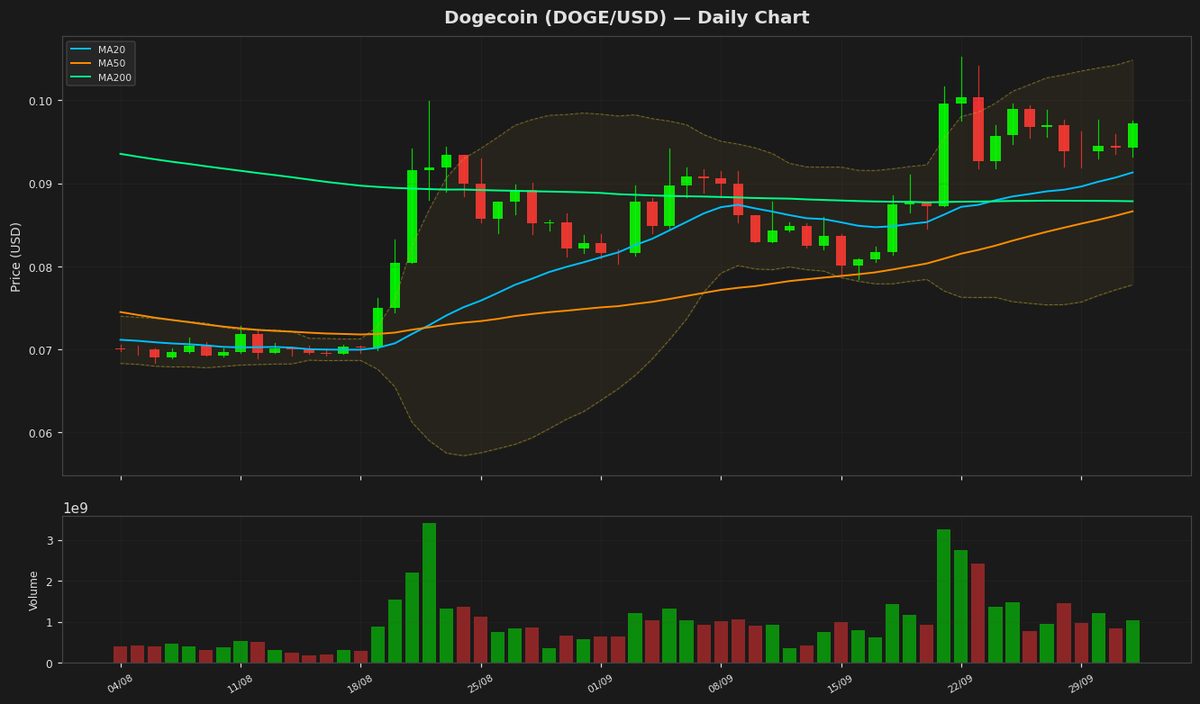
$0.083940 52W: $0.067973 — $0.156091
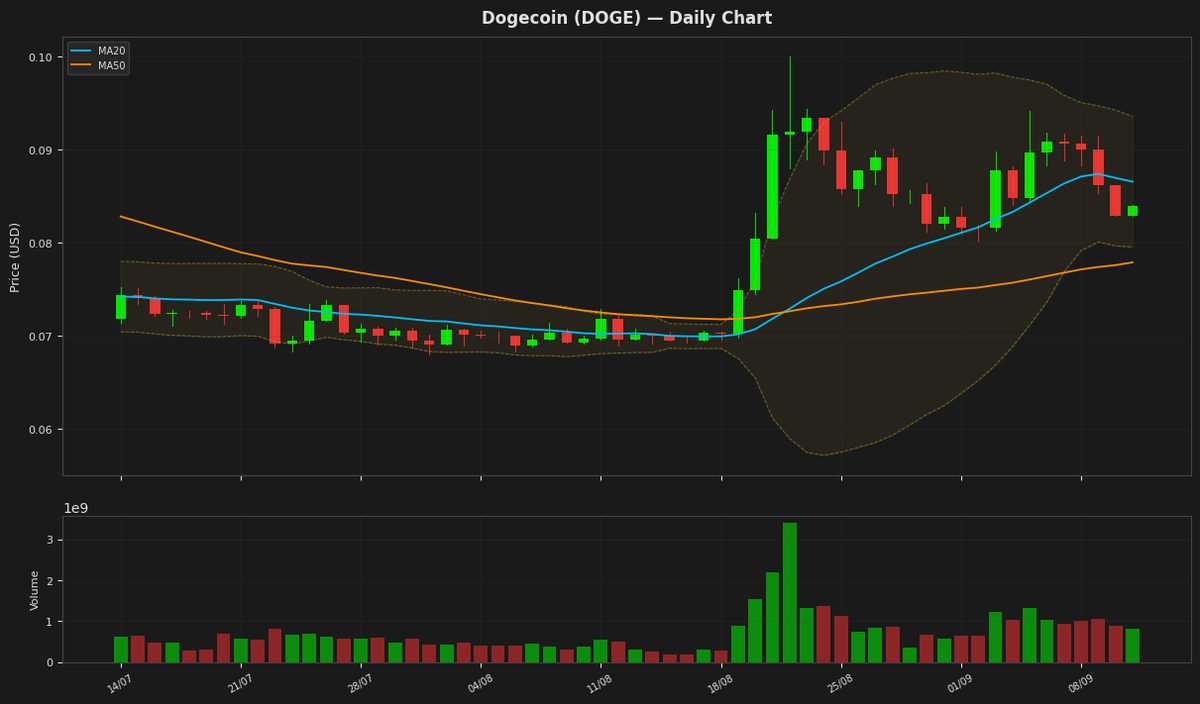
Dogecoin is currently trading at $0.083940, showing a slight increase of 1.24% in its daily price. The RSI value of 47.808948 indicates a neutral market sentiment, while the MACD line is below its signal line, suggesting a potential bearish trend. The price is also below the MA20 and within the Bollinger Bands, indicating a relatively stable but potentially downward movement. The ATR suggests moderate volatility.
Disclaimer
The content on MarketsFN.com is provided for educational and informational purposes only. It does not constitute financial advice or investment recommendations. All investments involve risk. Past performance does not guarantee future results.