Ethereum Dips Below $1,750 as Bearish Pressure Mounts
QuoteReporter
•3 min read
Ethereum Dips Below $1,750 as Bearish Pressure Mounts
Ethereum (ETH/USD) | June 17, 2026 $1,740.0000 -2.81%
🔍 Technical Analysis
### Ethereum (ETH) Technical Analysis
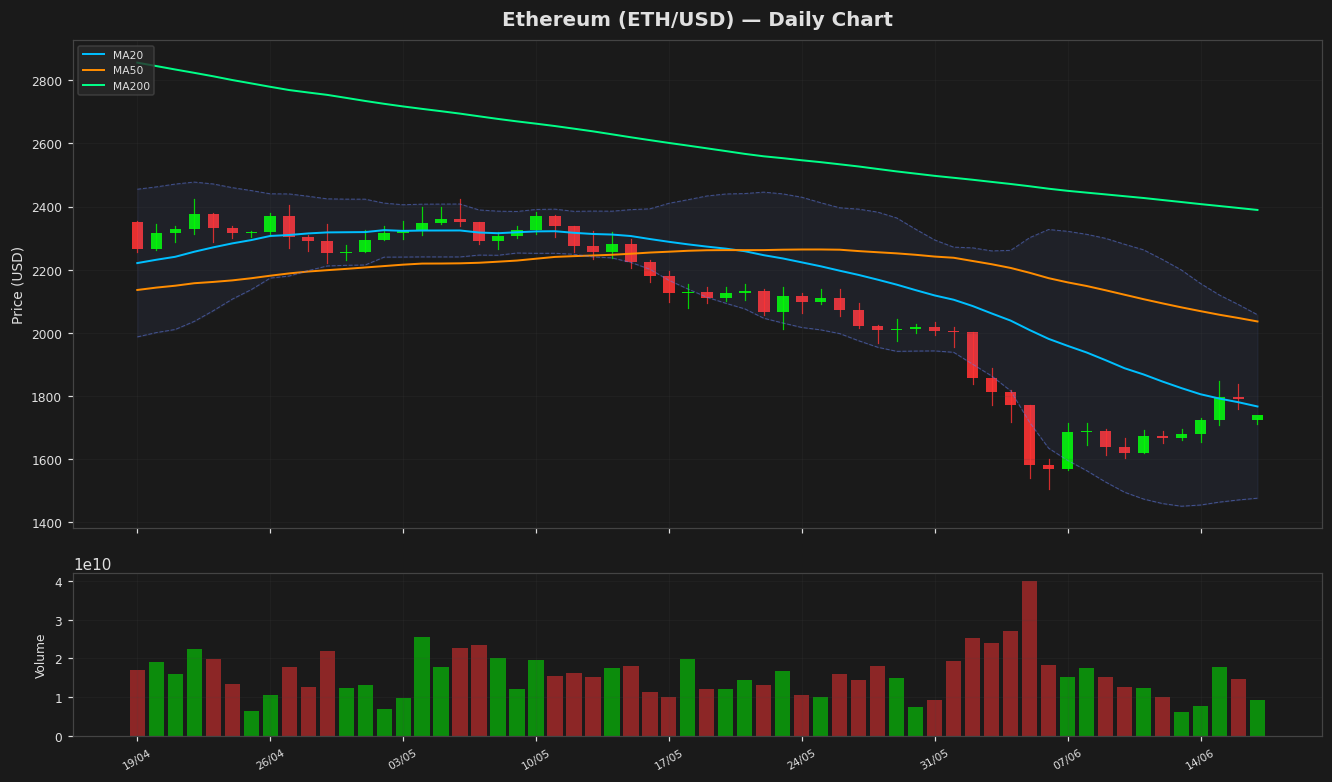
Ethereum is currently trading at **$1,740**, down **2.81%** on the day, reflecting bearish momentum. The price remains below key moving averages, with the **20-day MA at $1,766**, **50-day MA at $2,036**, and **200-day MA at $2,389**, indicating a sustained downtrend. The widening gap between the 50-day and 200-day MA reinforces bearish sentiment.
Bollinger Bands show **upper resistance at $2,057** and **lower support at $1,477**, with price hovering near the lower band, suggesting potential oversold conditions. However, volatility remains elevated, as indicated by the **ATR(14) of $92.98**.
The **RSI(14) at 44.71** is neutral but leaning toward bearish territory, lacking strong momentum for a reversal. The **MACD histogram at -87.97** remains below the signal line (-112.59), confirming bearish pressure.
Key resistance levels to watch are **$1,766 (20-day MA)** and **$2,036 (50-day MA)**. On the downside, immediate support lies at **$1,477 (lower Bollinger Band)**, followed by the **52-week low of $1,506**. A break below this level could trigger further downside toward **$1,400**.
Given the weak technical structure, Ethereum remains in a downtrend unless it reclaims the **20-day MA** with strong volume. Traders should monitor RSI for potential divergence and MACD for bullish crossover signals.
Ethereum is currently trading at **$1,740**, down **2.81%** on the day, reflecting bearish momentum. The price remains below key moving averages, with the **20-day MA at $1,766**, **50-day MA at $2,036**, and **200-day MA at $2,389**, indicating a sustained downtrend. The widening gap between the 50-day and 200-day MA reinforces bearish sentiment.
Bollinger Bands show **upper resistance at $2,057** and **lower support at $1,477**, with price hovering near the lower band, suggesting potential oversold conditions. However, volatility remains elevated, as indicated by the **ATR(14) of $92.98**.
The **RSI(14) at 44.71** is neutral but leaning toward bearish territory, lacking strong momentum for a reversal. The **MACD histogram at -87.97** remains below the signal line (-112.59), confirming bearish pressure.
Key resistance levels to watch are **$1,766 (20-day MA)** and **$2,036 (50-day MA)**. On the downside, immediate support lies at **$1,477 (lower Bollinger Band)**, followed by the **52-week low of $1,506**. A break below this level could trigger further downside toward **$1,400**.
Given the weak technical structure, Ethereum remains in a downtrend unless it reclaims the **20-day MA** with strong volume. Traders should monitor RSI for potential divergence and MACD for bullish crossover signals.
Technical Metrics
| Metric | Value |
|---|---|
| Current Price | $1,740.0000 |
| Daily Change | -2.81% |
| MA 20 | $1,766.4821 |
| % from MA20 | -1.50% |
| MA 50 | $2,035.9036 |
| % from MA50 | -14.53% |
| MA 200 | $2,389.3295 |
| % from MA200 | -27.18% |
| BB Upper | $2,057.2095 |
| % from BB Upper | -15.42% |
| BB Lower | $1,475.7547 |
| % from BB Lower | +17.91% |
| RSI (14) | 44.71 |
| MACD | -87.974602 |
| MACD Signal | -112.591144 |
| ATR (14) | 92.983337 |
| 3-Day High | $1,847.7698 |
| 3-Day Low | $1,709.2537 |
| 52-Week High | $4,531.7168 |
| % from 52W High | -61.60% |
| 52-Week Low | $1,506.5057 |
| % from 52W Low | +15.50% |
| YTD High | $3,397.8977 |
| % from YTD High | -48.79% |
| YTD Low | $1,506.5057 |
| % from YTD Low | +15.50% |
📊 Market Commentary
Ethereum (ETH) is trading at $1,740, down 2.81% today, reflecting broader market weakness as traders remain cautious amid mixed sentiment. The Relative Strength Index (RSI) at 44.7 suggests ETH is neither overbought nor oversold, hovering near neutral territory. Over the past 52 weeks, ETH has fluctuated between $1,506 and $4,531, with the current price sitting closer to the lower end of that range, indicating lingering bearish pressure despite recent consolidation.
Market sentiment around Ethereum remains divided. On one hand, anticipation around Ethereum’s ongoing network upgrades and layer-2 adoption provides long-term optimism. On the other, macroeconomic uncertainty and regulatory concerns continue to weigh on short-term momentum. Traders are closely watching the $1,700 level as immediate support; a sustained break below could open the door to a retest of the yearly low near $1,506. Conversely, resistance is seen around $1,800, with a push above potentially signaling renewed bullish interest.
Volume and on-chain activity remain subdued compared to earlier this year, suggesting many participants are sidelined awaiting clearer signals. ETH’s correlation with Bitcoin (BTC) remains strong, meaning broader crypto market trends will likely dictate near-term price action. For now, traders are monitoring key technical levels, macroeconomic developments, and any shifts in network activity to gauge ETH’s next directional move.
Market sentiment around Ethereum remains divided. On one hand, anticipation around Ethereum’s ongoing network upgrades and layer-2 adoption provides long-term optimism. On the other, macroeconomic uncertainty and regulatory concerns continue to weigh on short-term momentum. Traders are closely watching the $1,700 level as immediate support; a sustained break below could open the door to a retest of the yearly low near $1,506. Conversely, resistance is seen around $1,800, with a push above potentially signaling renewed bullish interest.
Volume and on-chain activity remain subdued compared to earlier this year, suggesting many participants are sidelined awaiting clearer signals. ETH’s correlation with Bitcoin (BTC) remains strong, meaning broader crypto market trends will likely dictate near-term price action. For now, traders are monitoring key technical levels, macroeconomic developments, and any shifts in network activity to gauge ETH’s next directional move.
Disclaimer
The content on MarketsFN.com is provided for educational and informational purposes only. It does not constitute financial advice or investment recommendations. All investments involve risk. Cryptocurrency markets are highly volatile. Past performance does not guarantee future results.