Dow Jones Industrial Avg: Up 0.25% to 53,411 — Testing 52-Week High
MarketsFN Team
Dow Jones Industrial Avg: Up 0.25% to 53,411 — Testing 52-Week High
Published: August 24, 2026 · MarketsFN Team
| Index | Price | Change | RSI(14) | SMA-20 | 52W High | 52W Low |
|---|---|---|---|---|---|---|
| Dow Jones Industrial Avg | 53,411 | +0.25% | 39.4 | 53,370 | 54,349 | 45,167 |
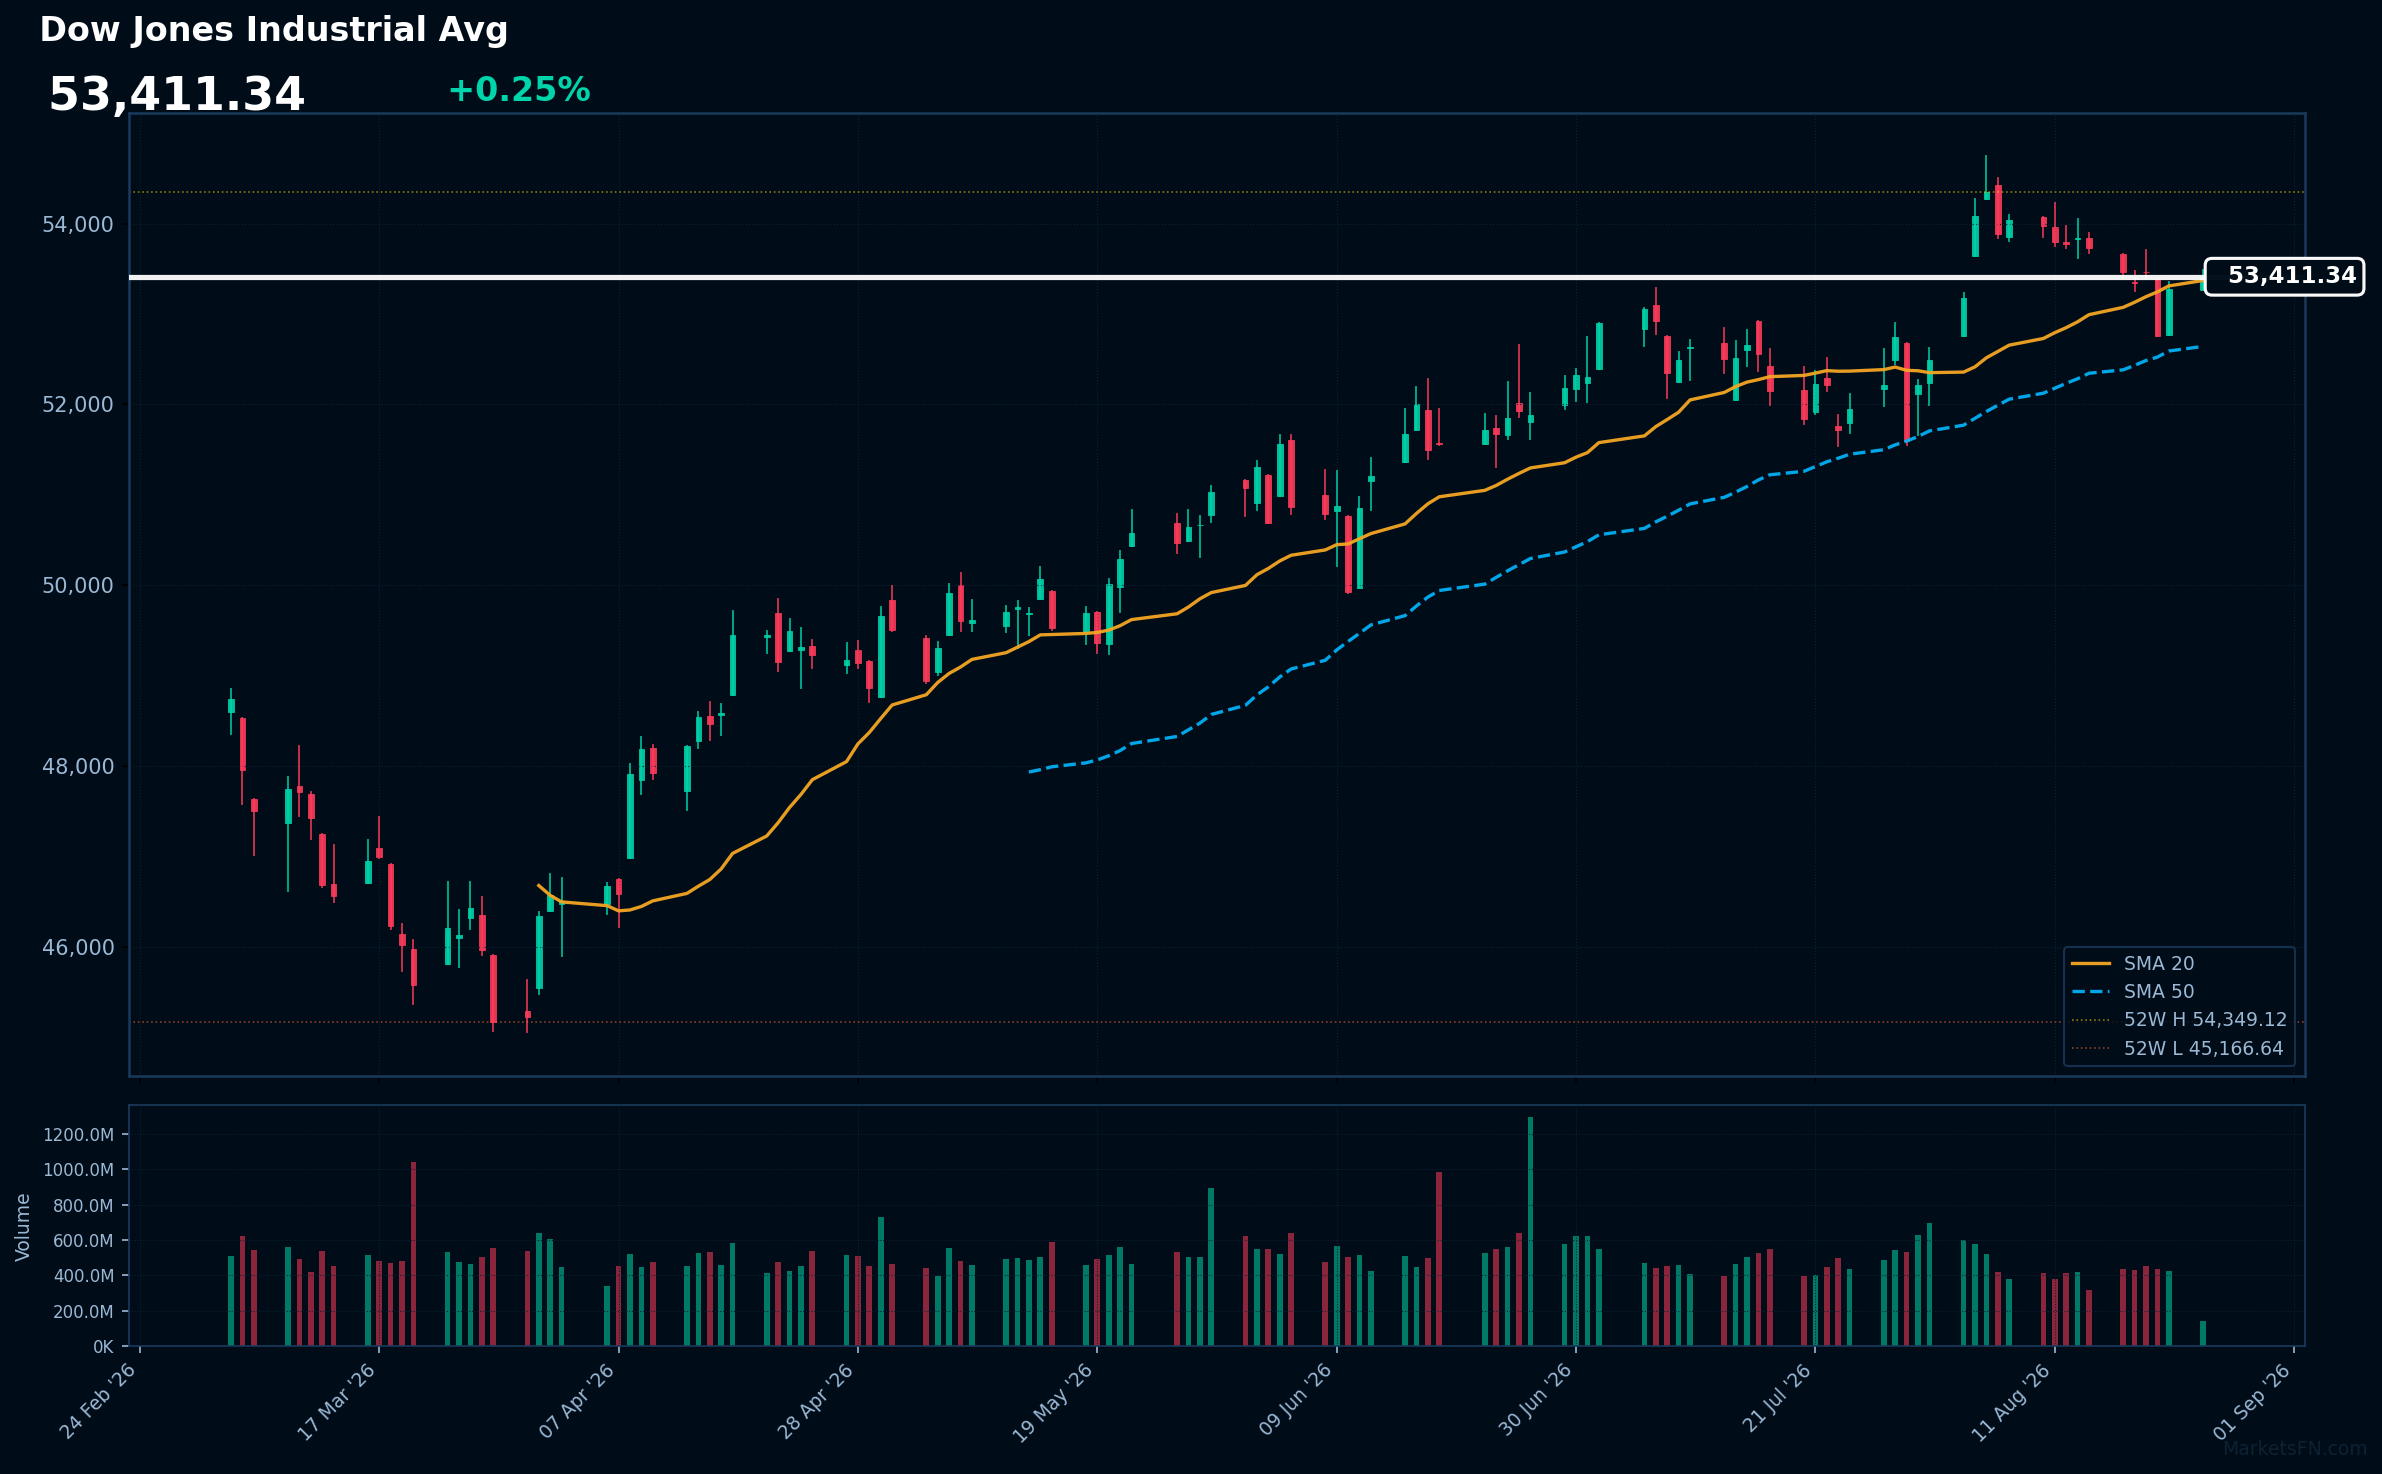
The Dow Jones Industrial Avg is actively quoting at 53,411 (+0.25%) as market participants react to a mix of economic data and corporate earnings reports, signaling a cautious optimism in the face of ongoing inflation concerns. This slight uptick follows a previous close of 53,277, indicating a potential shift in sentiment as investors weigh the implications of recent developments.
From a technical perspective, the index is currently above both its 20-day simple moving average (SMA-20) at 53,370 and its 50-day simple moving average (SMA-50) at 52,641, suggesting a bullish trend in the short to medium term. The relative strength index (RSI) stands at 39.4, placing it in neutral territory, while the index remains well within its 52-week range of 45,167 to 54,349, indicating room for movement in either direction.
Looking ahead, the Dow faces immediate resistance at the 52-week high of 54,349, while support is established at the recent low of 53,262. A decisive move beyond these levels could provide clearer direction for the index in the coming sessions.
Disclaimer
The content on MarketsFN.com is provided for educational and informational purposes only. It does not constitute financial advice or investment recommendations. All investments involve risks and past performance does not guarantee future results. You are solely responsible for your investment decisions.