Dogecoin Dips to $0.092: RSI Hints at Potential Rebound Ahead
QuoteReporter
•2 min read
Dogecoin Dips to $0.092: RSI Hints at Potential Rebound Ahead
Dogecoin (DOGE/USD) | September 28, 2026 $0.0923 -4.90%
🔍 Technical Analysis
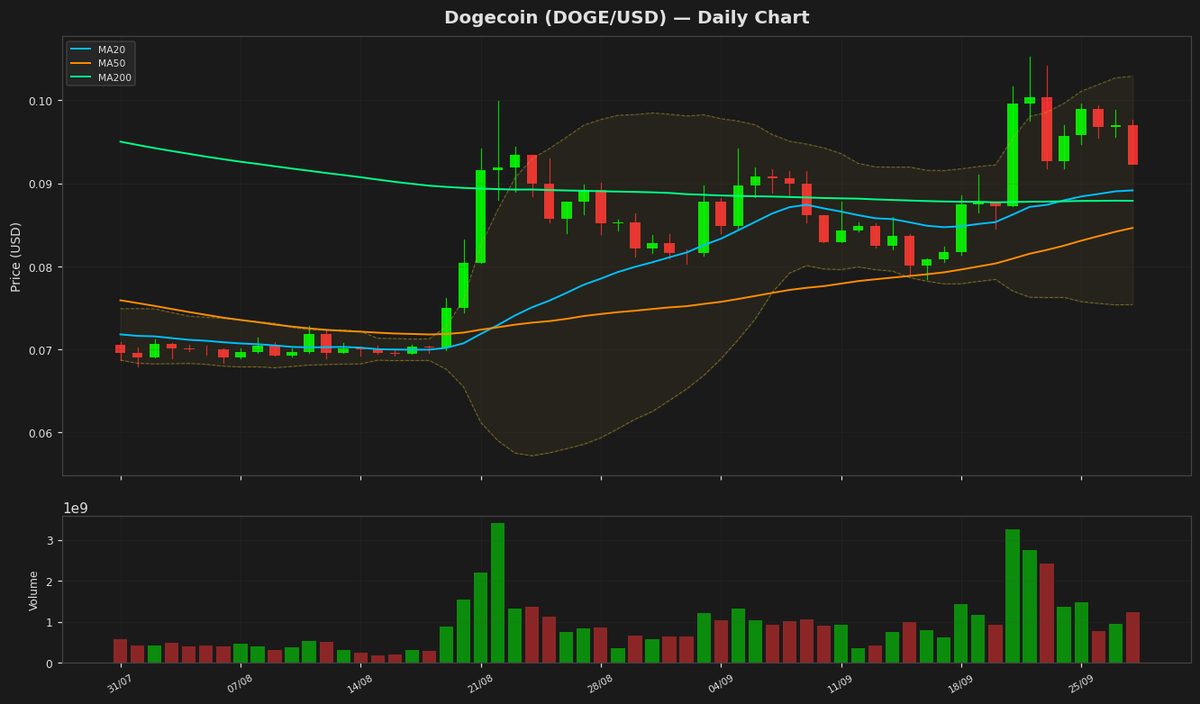
Dogecoin (DOGE) is currently trading at $0.092280, down 4.90% on the daily chart, reflecting short-term bearish pressure. The price remains above key moving averages, with the MA20 at $0.08914 and MA50 at $0.084618, indicating a bullish medium-term trend. However, the proximity of the MA200 at $0.087887 suggests potential consolidation if the price retests this level. Bollinger Bands show a narrowing range, with the upper band at $0.102889 and the lower band at $0.075391, signaling reduced volatility and a possible breakout in the near term. The RSI(14) at 59.427873 is neutral, neither overbought nor oversold, while the MACD histogram is positive at 0.003451, with the signal line at 0.003031, suggesting weak but present bullish momentum. Key support levels are at $0.08914 (MA20) and $0.084618 (MA50), with resistance at $0.102889 (Bollinger upper band) and the psychological $0.10 level. The ATR(14) of $0.005806 indicates moderate volatility. Dogecoin remains below its 52-week high of $0.129135 and YTD high of $0.156091, but well above the 52-week low of $0.067973. A break above $0.10 could reignite bullish sentiment, while a drop below $0.084618 may signal further downside.
Technical Metrics
| Metric | Value |
|---|---|
| Current Price | $0.0923 |
| Daily Change | -4.90% |
| MA 20 | $0.0891 |
| % from MA20 | +3.52% |
| MA 50 | $0.0846 |
| % from MA50 | +9.05% |
| MA 200 | $0.0879 |
| % from MA200 | +5.00% |
| BB Upper | $0.1029 |
| % from BB Upper | -10.31% |
| BB Lower | $0.0754 |
| % from BB Lower | +22.40% |
| RSI (14) | 59.43 |
| MACD | 0.003451 |
| MACD Signal | 0.003031 |
| ATR (14) | 0.005806 |
| 3-Day High | $0.0994 |
| 3-Day Low | $0.0923 |
| 52-Week High | $0.1291 |
| % from 52W High | -28.54% |
| 52-Week Low | $0.0680 |
| % from 52W Low | +35.76% |
| YTD High | $0.1561 |
| % from YTD High | -40.88% |
| YTD Low | $0.0680 |
| % from YTD Low | +35.76% |
📊 Market Commentary
Dogecoin (DOGE) is trading at $0.0923, down 4.90% today, as the broader cryptocurrency market experiences a pullback. The Relative Strength Index (RSI) at 59.4 suggests DOGE is neither overbought nor oversold, hovering near neutral territory. Over the past 52 weeks, DOGE has fluctuated between $0.0680 and $0.1291, with the current price sitting closer to the middle of this range.
Market sentiment for DOGE remains mixed. While the meme coin retains a strong community following, recent declines reflect broader risk-off trends in crypto, with traders cautious amid macroeconomic uncertainty. Key support levels to watch include $0.0900, a psychological level that could stabilize further downside, followed by $0.0850. On the upside, resistance is seen near $0.0950, with a break above potentially testing $0.1000.
Traders are monitoring Bitcoin’s price action for directional cues, as DOGE often moves in tandem with the broader market. Additionally, whale activity and exchange flows are being scrutinized for signs of accumulation or distribution. Despite the dip, DOGE’s high liquidity and social media presence continue to drive short-term volatility. The absence of major catalysts keeps the focus on technical levels and macro sentiment. For now, DOGE remains range-bound, with traders awaiting a decisive breakout or breakdown for clearer momentum.
Market sentiment for DOGE remains mixed. While the meme coin retains a strong community following, recent declines reflect broader risk-off trends in crypto, with traders cautious amid macroeconomic uncertainty. Key support levels to watch include $0.0900, a psychological level that could stabilize further downside, followed by $0.0850. On the upside, resistance is seen near $0.0950, with a break above potentially testing $0.1000.
Traders are monitoring Bitcoin’s price action for directional cues, as DOGE often moves in tandem with the broader market. Additionally, whale activity and exchange flows are being scrutinized for signs of accumulation or distribution. Despite the dip, DOGE’s high liquidity and social media presence continue to drive short-term volatility. The absence of major catalysts keeps the focus on technical levels and macro sentiment. For now, DOGE remains range-bound, with traders awaiting a decisive breakout or breakdown for clearer momentum.
Disclaimer
The content on MarketsFN.com is provided for educational and informational purposes only. It does not constitute financial advice or investment recommendations. All investments involve risk. Cryptocurrency markets are highly volatile. Past performance does not guarantee future results.